CERN-EP-2017-283 2018/04/17
CMS-SUS-17-004
Combined search for electroweak production of charginos
and neutralinos in proton-proton collisions at
√
s
=
13 TeV
The CMS Collaboration
∗Abstract
A statistical combination of several searches for the electroweak production of charginos and neutralinos is presented. All searches use proton-proton collision data at√s= 13 TeV, recorded with the CMS detector at the LHC in 2016 and correspond-ing to an integrated luminosity of 35.9 fb−1. In addition to the combination of previ-ous searches, a targeted analysis requiring three or more charged leptons (electrons or muons) is presented, focusing on the challenging scenario in which the difference in mass between the two least massive neutralinos is approximately equal to the mass of the Z boson. The results are interpreted in simplified models of chargino-neutralino or neutralino pair production. For chargino-neutralino production, in the case when the lightest neutralino is massless, the combination yields an observed (expected) limit at the 95% confidence level on the chargino mass of up to 650 (570) GeV, im-proving upon the individual analysis limits by up to 40 GeV. If the mass difference between the two least massive neutralinos is approximately equal to the mass of the Z boson in the chargino-neutralino model, the targeted search requiring three or more leptons obtains observed and expected exclusion limits of around 225 GeV on the sec-ond neutralino mass and 125 GeV on the lightest neutralino mass, improving the ob-served limit by about 60 GeV in both masses compared to the previous CMS result. In the neutralino pair production model, the combined observed (expected) exclusion limit on the neutralino mass extends up to 650–750 (550–750) GeV, depending on the branching fraction assumed. This extends the observed exclusion achieved in the in-dividual analyses by up to 200 GeV. The combined result additionally excludes some intermediate gaps in the mass coverage of the individual analyses.
Published in the Journal of High Energy Physics as doi:10.1007/JHEP03(2018)160.
c
2018 CERN for the benefit of the CMS Collaboration. CC-BY-4.0 license
∗See Appendix A for the list of collaboration members
1
Introduction
Supersymmetry (SUSY) [1–8] is an extension of the standard model (SM) of particle physics. It posits a new symmetry such that for each boson (fermion) in the SM, there exists a fermionic (bosonic) superpartner. Supersymmetry can potentially address several of the open questions in particle physics, including the hierarchy problem [9–11] and the unification of the gauge couplings at high energy scales [12, 13]. If R-parity [14] is conserved, the lightest SUSY particle (LSP) is stable and could be a potential dark matter candidate [15, 16].
This paper focuses on searches for electroweak production of SUSY particles, under the as-sumption that the strongly-coupled SUSY particles are too massive to be directly produced. The superpartners of the bosons from the SM SU(2) and U(1) gauge fields before electroweak symmetry breaking are denoted as the winos and bino, respectively. We consider SUSY models assuming two complex Higgs doublets, and the superpartners of the Higgs bosons are denoted as higgsinos. The bino, winos, and higgsinos form mass eigenstates of two charginos (χe
±) and
four neutralinos (χe
0) and in general can mix among one another. In this paper, we focus on the lightest neutralino (χe
0
1), the next-to-lightest neutralino (χe 0
2), and the lightest chargino (χe
± 1). If the superpartners of the SM leptons, the sleptons, are much heavier than the charginos and neu-tralinos, decays of the charginos and neutralinos proceed through the W, Z, and Higgs bosons. The branching fractions of neutralinos to the Z and Higgs bosons depend on the mixing among the bino, winos, and higgsinos to form mass eigenstates.
Searches performed at LEP exclude promptly-decaying charginos below a mass of 103.5 GeV [17]. At the LHC, several searches have been performed by the ATLAS [18–29] and CMS [30–43] Collaborations looking for direct production of charginos and neutralinos. Given the various possible decay modes, a SUSY signal could simultaneously populate multiple final states. This paper implements a statistical combination of the searches performed by CMS in Refs. [38–43] covering several final states to improve upon the sensitivity of the individual analyses, partic-ularly in models where the neutralino has a nonzero branching fraction to both Z and Higgs bosons. In addition, we present an extension of a search selecting events with three or more charged leptons [38]. It targets the difficult region of phase space where the difference in mass between theχe
0
2andχe
0
1is approximately equal to the Z boson mass, and the signal has similar kinematic properties to the dominant background of SM WZ production. All searches use a data sample of LHC proton-proton collisions at√s =13 TeV collected by the CMS experiment in 2016, corresponding to an integrated luminosity of 35.9 fb−1.
2
Signal models
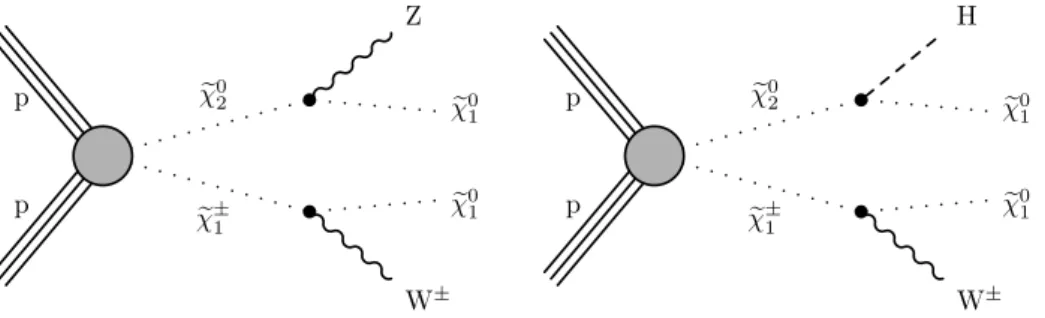
Simplified models of SUSY [44–47] are used to interpret the combined search results presented below. In this paper, “H” refers to the 125 GeV scalar boson [48], interpreted as the lightest CP-even state of an extended Higgs sector. The H boson is expected to have SM-like properties if all of the other Higgs bosons are much heavier [49]. All signal models considered involve the production of two bosons (W, Z, or H) through SUSY decays, and we denote each model by the specific bosons produced. The W, Z, and H bosons are always assumed to decay according to their SM branching fractions. The sleptons are always assumed to have much higher masses than the charginos and neutralinos such that they do not contribute to the interactions.
The first class of models assumesχe
± 1χe
0
2 production. Theχe 0
1is assumed to be the LSP. The χe
± 1 always decays to the W boson and theχe
0
1, while theχe 0
2can decay to either of the Z or H bosons plus the χe
0
1. We consider three choices for the χe 0
2 decay: a branching fraction of 100% to Zχe 0 1 (WZ topology), of 100% to Hχe
0
topology). This model is depicted in Fig. 1, showing the two possible decays. The production cross sections are computed in the limit of mass-degenerate winos χe
±
1 andχe
0
2, and light bino e
χ01, with all other sparticles assumed to be heavy and decoupled.
p p χe02 e χ±1 W± e χ01 e χ01 Z p p χe02 e χ±1 W± e χ01 e χ01 H Figure 1: Production ofχe ± 1χe 0 2with theχe ±
1 decaying to a W boson and the LSP,χe 0
1, and the χe 0 2 decaying to either (left) a Z boson and theχe
0
1or (right) a H boson and theχe 0 1. The second class of models assumesχe
0 1χe
0
1production. For bino- or wino-like neutralinos, the neutralino pair production cross section is very small, and thus we consider a specific gauge-mediated SUSY breaking (GMSB) model with quasidegenerate higgsinos as next-to-lightest SUSY particles and an effectively massless gravitino ( eG) as the LSP [50–52]. In the production of any two of these,χe
± 1 orχe
0
2decays immediately toχe 0
1and low-momentum particles that do not impact the analysis, effectively yielding pair production ofχe
0 1χe 0 1. Theχe 0 1 then decays to a e
G and either a Z or H boson, and we consider varying branching fractions from 100% decay into the Z boson to 100% decay into the H boson including intermediate values. The possible decays in this model are shown in Fig. 2.
The production cross sections for the GMSB scenario are computed in a limit of mass-degenerate higgsino statesχe ± 1,χe 0 2, andχe 0
1, with all the other sparticles assumed to be heavy and decoupled. Following the convention of real mixing matrices and signed neutralino masses [53], we set the sign of the mass ofχe
0 1 (χe
0
2) to+1 (−1). The lightest two neutralino states are defined as sym-metric (antisymsym-metric) combinations of higgsino states by setting the product of the elements Ni3and Ni4of the neutralino mixing matrix N to +0.5 (−0.5) for i = 1 (2). The elements U12 and V12of the chargino mixing matrices U and V are set to 1.
p p χe01 e χ01 Z e G e G Z p p χe01 e χ01 Z e G e G H p p χe01 e χ01 H e G e G H
Figure 2: A GMSB model withχe 0 1χe
0
1pair production. The twoχe 0
1particles decay into the eG LSP and (left) both to Z bosons, (center) a Z and a H boson, or (right) both to H bosons.
Cross section calculations to next-to-leading order (NLO) plus next-to-leading-logarithmic (NLL) accuracy [54–59] in perturbative quantum chromodynamics (QCD) are used to normalize the signal samples for the results presented in Sections 6 and 7. In this section, we present cross sections calculated to NLO accuracy [56] to demonstrate the dependence of the cross section values on assumptions made in decoupling other SUSY particles. The same qualitative conclu-sions also hold for the NLO+NLL calculations used in the final results.
Figure 3 shows the NLO cross section for χe ± 1χe 0 2 production at √
s = 13 TeV assuming mass-degenerate winos χe
±
1 andχe
0
2. The various curves show different assumptions on the masses of squarks (eq) and gluinos (eg), as described in the legend. The cross section depends signifi-cantly on the masses of the strongly coupled particles until they reach masses of at least 10 TeV. For the range ofχe
±
1 andχe
0
2masses considered here, the reduction can make up to 90% in the cross section value. This is due to large destructive interference effects from t-channel dia-grams involving squark exchange. The cross section calculation used in the interpretations of the analysis results assumes a mass of 100 TeV for the squarks and gluinos to have them fully decoupled. The obtained results would be less stringent if lower masses were assumed for the squarks and gluinos. We performed the same study forχe
± 1χe 0 2,χe ± 1χe 0 1,χe ± 1χe ∓ 1, andχe 0 2χe 0 1 produc-tion with the assumpproduc-tion of mass-degenerate higgsinosχe
± 1,χe
0
2, andχe 0
1. The dependence of the production cross section on the decoupling mass assumption was found to be much smaller in the higgsino case, at most a few percent, and it is small compared to the uncertainty in the cross section calculation.
Cross section [pb] 5 − 10 4 − 10 3 − 10 2 − 10 1 − 10 1 10 2 10 = 0.3 TeV g ~ = m q ~ m = 0.5 TeV g ~ = m q ~ m = 1 TeV g ~ = m q ~ m = 2 TeV g ~ = m q ~ m = 5 TeV g ~ = m q ~ m = 10 TeV g ~ = m q ~ m = 100 TeV g ~ = m q ~ m [GeV] 1 ± χ∼ = m 2 0 χ∼ m 200 400 600 800 1000 1200 1400 = 100 TeVg ~ = mq ~ m xsec = xg ~ = mq ~ m xsec 0 0.2 0.4 0.6 0.8 1 1.2
Figure 3: Cross section forχe
± 1χe
0
2production at √
s = 13 TeV versus the wino mass, calculated to NLO accuracy in QCD with RESUMMINO [56]. The χe
±
1 and χe
0
2 are assumed to be mass-degenerate winos. The various curves show different assumptions on the masses of the squarks and gluinos, as described in the legend. The green band shows the theoretical uncertainty in the cross section calculation, from the variation of renormalization and factorization scales as well as parton density functions, for the 100 TeV squark and gluino mass assumption.
3
The CMS detector
The central feature of the CMS apparatus is a superconducting solenoid, 13 m in length and 6 m in diameter, that provides an axial magnetic field of 3.8 T. The bore of the solenoid is out-fitted with various particle detection systems. Charged-particle trajectories are measured by silicon pixel and strip trackers, covering 0 < φ < 2π in azimuth and |η| < 2.5, where the
pseudorapidity η is defined as−log[tan(θ/2)], with θ being the polar angle of the trajectory
of the particle with respect to the clockwise beam direction. A crystal electromagnetic calori-meter (ECAL) and a brass and scintillator hadron caloricalori-meter (HCAL) surround the tracking volume. The calorimeters provide energy and direction measurements of electrons, photons,
and hadronic jets. Muons are measured in gas-ionization detectors embedded in the steel flux-return yoke outside the solenoid. The detector is nearly hermetic, allowing for energy balance measurements in the plane transverse to the clockwise beam direction. A two-tier trigger sys-tem selects the most interesting pp collision events for use in physics analysis. A more detailed description of the CMS detector, together with a definition of the coordinate system used and the relevant kinematic variables, can be found in Ref. [60].
4
Event reconstruction and Monte Carlo simulation
Event reconstruction is based on the particle-flow (PF) algorithm [61], which optimally com-bines information from the tracker, calorimeters, and muon systems to reconstruct and identify PF candidates, i.e., charged and neutral hadrons, photons, electrons, and muons. To select col-lision events, we require at least one reconstructed vertex. The reconstructed vertex with the largest value of summed physics-object p2T is taken to be the primary pp interaction vertex, where pT is the transverse momentum with respect to the beam axis. The physics objects are the objects returned by a jet finding algorithm [62, 63] applied to all charged tracks associated with the vertex, plus the corresponding associated missing transverse momentum. The miss-ing transverse momentum vector,~pTmiss, is defined as the negative vector sum of the momenta of all reconstructed PF candidates projected onto the plane perpendicular to the proton beams. Its magnitude is referred to as pmissT . Events with possible contributions from beam halo pro-cesses or anomalous noise in the calorimeters can have large values of pmissT and are rejected using dedicated filters [64].
Electron candidates are reconstructed starting from a cluster of energy deposits in the ECAL. The cluster is then matched to a reconstructed track. The electron selection is based on the shower shape, the ratio of energy measured in the HCAL to that measured in the ECAL, track-cluster matching, and consistency between the track-cluster energy and the track momentum [65]. Muon candidates are reconstructed by performing a global fit that requires consistent hit pat-terns in the tracker and the muon system [66]. Photon candidates are reconstructed from a cluster of energy deposits in the ECAL, and they are required to pass criteria based on the shower shape and the ratio of energy measured in the HCAL to that measured in the ECAL [65]. Hadronically decaying tau lepton candidates (τh) are reconstructed from PF candidates with the “hadron-plus-strips” algorithm [67]. Electron, muon, photon, and τh candidates are re-quired to be isolated from other particles, and electron, muon, and τh candidates must satisfy requirements on the transverse and longitudinal impact parameters relative to the primary vertex.
PF candidates are clustered to form jets using the anti-kT clustering algorithm [62] with a dis-tance parameter of 0.4, as implemented in the FASTJETpackage [63]. Identification of jets
origi-nating from b quarks (b jets) is performed with either the combined secondary vertex (CSVv2) algorithm [68] or the DeepCSV algorithm [69]. Data events are selected using a variety of trig-gers requiring the presence of electrons, muons, photons, jets, or pmissT , depending on the final state targeted in each analysis.
Monte Carlo (MC) simulated samples are used in the various searches to estimate the back-ground from some SM processes, to assess systematic uncertainties in prediction methods that rely on data, and to calculate the selection efficiency for signal models. Most SM background samples are produced with the MADGRAPH5 aMC@NLOv2.2.2 or v2.3.3 generator [70] at
lead-ing order (LO) or NLO accuracy in perturbative QCD, includlead-ing up to four additional partons in the matrix element calculations, depending on the process and calculation order. Other sam-ples are produced with the POWHEG v2 [71, 72] generator without additional partons in the
matrix element calculations. Standard model WZ production in particular is modeled with MADGRAPH5 aMC@NLOv2.2.2 at NLO precision for the search described in Section 6, which requires a precise description of initial-state radiation (ISR). In other cases,POWHEGv2 is used.
The NNPDF3.0 LO or NLO [73] parton distribution functions (PDFs) are used in the event generation. Parton showering and fragmentation in all of these samples are performed us-ing thePYTHIAv8.212 [74] generator and the CUETP8M1 tune [75]. A double counting of the partons generated with MADGRAPH5 aMC@NLOand those withPYTHIAis removed using the MLM [76] and the FXFX [77] matching schemes, in the LO and NLO samples, respectively. Cross section calculations at NLO or next-to-NLO [70, 78–82] are used to normalize the simu-lated background samples.
Signal samples are generated with MADGRAPH5 aMC@NLO at LO precision, including up to
two additional partons in the matrix element calculations. Cross section calculations to NLO plus NLL accuracy [55, 56, 83] are used to normalize the signal samples. For these samples we improve on the modeling of ISR, which affects the total transverse momentum of the system of SUSY particles (pISRT ), by reweighting the pISRT distribution in these events. This reweighting procedure is based on experimental studies of the pTof Z bosons [84]. The reweighting factors range between 1.18 (at pISRT = 125 GeV) and 0.78 (for pISRT > 600 GeV). We take the deviation from 1.0 as the systematic uncertainty in the reweighting procedure.
For both signal and background events, additional simultaneous proton-proton interactions (pileup) are generated withPYTHIAand superimposed on the hard collisions. The response of the CMS detector for SM background samples is simulated using a GEANT4-based model [85], while that for new physics signals is performed using the CMS fast simulation package [86]. All simulated events are processed with the same chain of reconstruction programs as used for collision data. Corrections are applied to simulated samples to account for differences between the trigger, b tagging, and lepton and photon selection efficiencies measured in data and the GEANT4 simulation. Additional differences arising from the fast simulation modeling of
selec-tion efficiencies, as well as from the modeling of pmiss
T , are corrected in the fast simulation and included in the systematic uncertainties considered.
5
Individual searches
The experimental searches included in the combination are briefly described here. Table 1 lists which searches are used to place exclusion limits for each of the topologies introduced in Section 2. The selections for all searches were checked to be mutually exclusive, such that no events fulfill the signal region requirements for more than one search. No significant deviations from the SM predictions were observed in any of these searches.
5.1 Search for one lepton, two b jets, and pmissT
The “1`2b” search [43], targeting the WH topology, selects events with exactly one charged lep-ton (e or µ), exactly two b jets, and large pmissT . The invariant mass of the two b jets is required to be consistent with the mass of the H boson. Kinematic variables are used to suppress back-grounds, which predominantly come from dileptonic decays in tt production. Two exclusive signal regions are defined based on pmissT : 125≤ pmissT <200 GeV and pmissT ≥200 GeV. The SM backgrounds are predicted using MC simulation, with the predictions validated in data control regions distinct from the signal region.
Table 1: Summary of all experimental searches considered in the combination (rows), and the signal topologies for which each search is used in the combined results (columns). The searches are described in Sections 5.1 through 5.6 and Section 6. The≥3`search described in Section 5.5 is used for all signal topologies except for WZ, where the reoptimized search strategy from Section 6 is employed instead.
Signal topology Search WZ WH ZZ ZH HH 1`2b X 4b X 2`on-Z X X X 2`soft X ≥3` X X X X X H(γγ) X X X
5.2 Search for four b jets and pmissT
The “4b” search [41], targeting the HH topology, selects events with exactly four or five jets, with at least two of them identified as b jets, large pmiss
T , and no charged leptons. In each event, the four jets with the highest b tagging discriminator scores are considered to form dijet H candidates. There are three possible groupings to make two pairs of jets. The grouping is selected to minimize the difference between the invariant masses of the two dijet pairs, and the difference in masses is required to be less than 40 GeV. The average invariant mass of the two pairs is then required to be consistent with the mass of the H boson. Exclusive signal regions are defined based on the number of b jets (three or at least four) and multiple bins in pmissT . The primary background to this search comes from semileptonic decays in tt production, with smaller contributions from W or Z production in association with jets and from QCD multijet production. The backgrounds are predicted using data control samples that require either exactly two b jets or an average dijet invariant mass inconsistent with the H boson.
5.3 Search for two leptons consistent with a Z boson, jets, and pmissT
The “2`on-Z” search [42], targeting the WZ, ZZ, and ZH topologies, selects events with exactly two opposite-sign, same-flavor (OSSF) leptons (e+e− or µ+µ−) consistent with the Z boson
mass, at least two jets, and large pmissT . In the signal region targeting the WZ and ZZ topologies, two jets are required to have an invariant mass less than 110 GeV to be compatible with the W and Z boson masses, and events with b jets are rejected. To target the ZH topology, events are required to have two b jets with an invariant mass less than 150 GeV to be compatible with the H boson mass. Signal regions are defined with multiple exclusive bins in pmissT . The backgrounds fall into three categories. First, flavor symmetric backgrounds, such as tt production, yield e±µ∓events at the same rate as e+e−and µ+µ−events combined, and they are predicted from
a data control sample of e±µ∓ events. Second, events with a Z boson and mismeasured jets
give instrumental pmissT , and they are predicted from a data control sample of γ+jets events. Third, events with a Z boson and at least one prompt neutrino, arising from processes such as WZ, ZZ, and ttZ production, are estimated using simulation.
5.4 Search for two soft leptons and pmissT
The “2`soft” search [39] selects events with exactly two low-pT leptons (e+e−or µ+µ− in the
relevant selections), jets, and large pmissT . It targets the WZ topology where the mass difference betweenχe
0 2andχe
0
1is small such that the W and Z bosons are off-shell, and the observable decay products have low momentum. The leptons are required to satisfy 5< pT <30 GeV and have
an invariant mass in the range 4<m``<50 GeV, strongly suppressing SM backgrounds while
retaining good acceptance for compressed signal scenarios. Additional kinematic requirements are applied to further reduce backgrounds, and the relevant signal regions are binned in m``
and pmiss
T . The largest backgrounds arise from Z/γ∗and tt production, as well as misidentifica-tion of nonprompt leptons. The first two are predicted from simulamisidentifica-tion with constraints from data control regions, while the latter is predicted entirely using data.
5.5 Search for three or more leptons, and pmissT
The “≥3`” search [38] selects events with three or more leptons (e, µ, and up to two τh) and large pmissT . Several exclusive categories are defined based on the number of leptons, lepton flavor and charge, the presence of an OSSF pair, and kinematic variables such as the invariant mass of the OSSF pair and pmissT . Events with a b jet are rejected to reduce the background from tt production. The various categories are designed to give this search sensitivity for a wide range of new physics models, including all of the topologies introduced in Section 2. The best performance is seen in the WZ and ZZ models, while the lower branching fraction of the H bo-son to leptons reduces the sensitivity to other models. The SM backgrounds in this search vary across the categories, and the most important for the relevant regions in these interpretations are SM WZ and ZZ production, and events with misidentified nonprompt leptons. The former are predicted using simulation, which in case of WZ is validated in a set of dedicated control regions, while the latter are predicted entirely from data.
A further optimization of this analysis has been performed for the WZ topology in the case where the difference in the masses of χe
0
2 and χe
0
1 is equal to the Z boson mass, focusing on a category selecting events with three light-flavor leptons (e, µ). This update is presented in Section 6.
5.6 Search for a H boson decaying to diphotons and pmissT
The “H(γγ)” search [40] selects events with two photons consistent with the H boson mass,
along with jets and large pmissT . Events are categorized based on the pT of the diphoton system, the expected resolution on the diphoton mass, the presence of two b jets compatible with the H or Z boson masses, and the razor kinematic variables [87, 88]. It exhibits sensitivity to the WH, ZH, and HH topologies. The background arises either from γ+jets or SM H boson production. The former is estimated using a fit to the diphoton mass spectrum in a wider range than the signal window, while the latter is predicted using simulation.
6
Search for three light leptons consistent with WZ production
and
p
missTThe multilepton search described in Section 5.5 contains a category selecting events with three light-flavor leptons (e, µ), two of which must form an OSSF pair. This final state aims to provide sensitivity for a variety of SUSY models, including the WZ topology depicted in Fig. 1 (left). The dominant background in this search category is SM WZ production.
Exclusion limits on the WZ topology were placed in Ref. [38], and the sensitivity was found to be significantly reduced for m
e
χ02 −mχe
0
1 ≈ mZ, referred to here as the “WZ corridor.” In this
case, SUSY signal is kinematically similar to the SM background. We present here a further op-timization of the search for the WZ topology designed to target this challenging region of phase space. The search methodology remains the same as in Ref. [38], but the event categorization has been updated as described below.
We require events to have three light-flavor leptons with two forming an OSSF pair. Events are categorized using the following kinematic variables: pmissT , the invariant mass m``of the OSSF
pair, and the transverse mass MTof the third lepton computed with respect to pmissT . Three bins in m``are defined to separate contributions from on- and off-shell Z boson decays, and three
bins are defined in MTto separate the SM W boson contribution.
To improve the separation between signal and background in the WZ corridor, we exploit ISR by further categorizing the events in HT, the scalar pT sum of the jets with pT > 30 GeV. Due to the presence of theχe
0
1LSPs, signal model points in the WZ corridor will tend to have more events at high values of pmissT and MT than the SM background for the same value of HT, with the effect becoming relevant at m
e
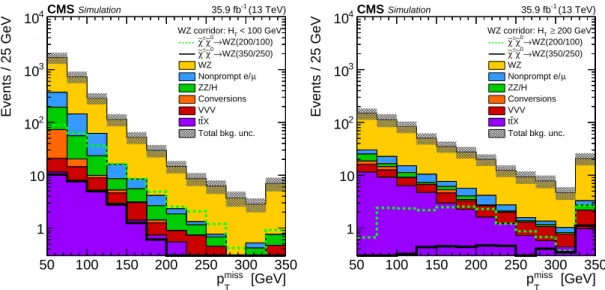
χ01 ≈ mZand more pronounced at higher HT. This is demon-strated in Fig. 4, which shows the expected distributions of pmissT for background and two signal model points after requiring (left) HT <100 GeV and (right)≥200 GeV. The HT categorization is applied in the regions m`` <75 GeV and 75≤ m`` < 105 GeV. The full set of search regions
is summarized in Table 2. [GeV] miss T p 50 100 150 200 250 300 350 Events / 25 GeV 1 10 2 10 3 10 4 10 < 100 GeV T WZ corridor: H WZ(200/100) → 0 χ∼ ± χ∼ WZ(350/250) → 0 χ∼ ± χ∼ WZ µ Nonprompt e/ ZZ/H Conversions VVV X t t Total bkg. unc. (13 TeV) -1 35.9 fb CMSSimulation [GeV] miss T p 50 100 150 200 250 300 350 Events / 25 GeV 1 10 2 10 3 10 4 10 200 GeV ≥ T WZ corridor: H WZ(200/100) → 0 χ∼ ± χ∼ WZ(350/250) → 0 χ∼ ± χ∼ WZ µ Nonprompt e/ ZZ/H Conversions VVV X t t Total bkg. unc. (13 TeV) -1 35.9 fb CMSSimulation
Figure 4: Distributions of pmissT for two representative signal points in the WZ corridor as well as the expected SM background for HT <100 (left) and≥200 GeV (right). The mass values for the signal points are given as(m
e
χ02/mχe
0
1)in GeV. For larger values of HT, the shape difference
between signal and background becomes more pronounced due to the presence of χe 0
1 LSPs
with large Lorentz boost.
The dominant background in this search is SM WZ production, which provides a signature very similar to the signal process in the form of three isolated leptons and substantial pmiss
T due
to the neutrino from the W boson decay. This background is estimated from simulation, while two control regions are used to assess the overall normalization and to validate the modeling of events at large values of pmissT , MT, or both. Further backgrounds arise from misidentification of nonprompt leptons from processes like tt production, external and internal photon conver-sions, and rare SM processes such as triboson production, ttW, and ttZ. The contribution of the nonprompt lepton background is predicted using the “tight-to-loose” ratio method [89], which relies entirely on data. External and internal photon conversions as well as rare SM processes are predicted from simulation, and a dedicated data control region is used to constrain the normalization of the conversion background.
The SM WZ background normalization is constrained in a data control region requiring 75 ≤ m`` < 105 GeV, MT < 100 GeV, 35 < pmissT < 100 GeV, and HT < 100 GeV. The fraction of
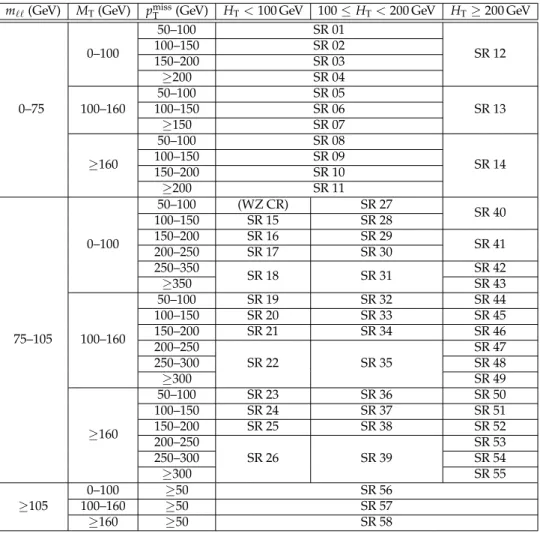
Table 2: Definition of the search regions (SRs) optimized for the WZ corridor in the WZ signal topology. Events must have three leptons (e, µ) forming at least one OSSF pair and they are categorized in m``, MT, pmissT and HT. Where ranges of values are given, the lower bound is inclusive while the upper bound is exclusive, e.g., 75≤m`` <105 GeV.
m``(GeV) MT(GeV) pmissT (GeV) HT<100 GeV 100≤HT<200 GeV HT≥200 GeV
0–75 0–100 50–100 SR 01 SR 12 100–150 SR 02 150–200 SR 03 ≥200 SR 04 100–160 50–100 SR 05 SR 13 100–150 SR 06 ≥150 SR 07 ≥160 50–100 SR 08 SR 14 100–150 SR 09 150–200 SR 10 ≥200 SR 11 75–105 0–100 50–100 (WZ CR) SR 27 SR 40 100–150 SR 15 SR 28 150–200 SR 16 SR 29 SR 41 200–250 SR 17 SR 30 250–350 SR 18 SR 31 SR 42 ≥350 SR 43 100–160 50–100 SR 19 SR 32 SR 44 100–150 SR 20 SR 33 SR 45 150–200 SR 21 SR 34 SR 46 200–250 SR 22 SR 35 SR 47 250–300 SR 48 ≥300 SR 49 ≥160 50–100 SR 23 SR 36 SR 50 100–150 SR 24 SR 37 SR 51 150–200 SR 25 SR 38 SR 52 200–250 SR 26 SR 39 SR 53 250–300 SR 54 ≥300 SR 55 ≥105 0–100 ≥50 SR 56 100–160 ≥50 SR 57 ≥160 ≥50 SR 58
selected background events arising from SM WZ production in this region is approximately 86%. The validation of the pmissT and MTshape modeling is done using a data control sample enriched in Wγ events, with the remainder of events coming mainly from W+jets production. A photon with pT>40 GeV is required together with a lepton and pmissT ≥50 GeV, correspond-ing to a leptonic W boson decay. The minimum photon pT threshold ensures that the photon does not arise from final-state radiation. The motivation behind this selection is that the W boson MTdistribution in both Wγ and W+jets events is found to be consistent with that of SM WZ production. A systematic uncertainty is assigned to the signal region bins with high MT and pmissT based on the statistical precision of this control region.
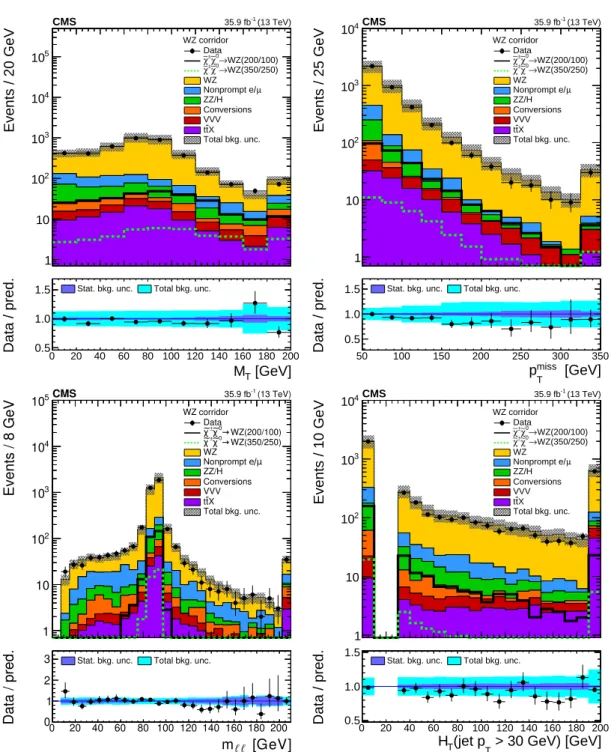
Distributions of key kinematic observables for the events entering the search regions are shown in Fig. 5 with two representative signal mass points included. The data agree with the predic-tion within systematic uncertainties, which are dominated at high MT and pmissT by the WZ control region statistical precision as described above. This uncertainty is taken as correlated across signal region bins. The comparison between expected and observed yields in the search regions is shown in Fig. 6 and Table 3. No significant deviations from the SM expectations are observed. The predicted background yields and uncertainties presented in this section are used as inputs to the likelihood fit for interpretation, described in Section 7. The
interpre-tation of the results in the WZ topology at 95% confidence level (CL) is presented in Fig. 7. Compared to Ref. [38], the expected lower mass limit in the WZ corridor has improved from around (m
e
χ02, mχe 0
1) = (200, 100) to around (225, 125)GeV, while the observed limit has
im-proved by around 60 GeV in both mass values. The expected limit contour for signal points with m
e
χ02 −mχe
0
1 > mZhas also improved by as much as 25 GeV due to the new selections. The
upper limit on theχe
± 1χe
0
2production cross section has improved by a factor of 2.
The event selections listed in Table 2 are used to replace the selections for category A in Ref. [38] in the combination below with other analyses, when interpreting results in the models with either 100% or 50% branching fraction to the SUSY WZ topology. In this case, the systematic uncertainties in the background prediction are treated as being fully correlated with the other categories from Ref. [38].
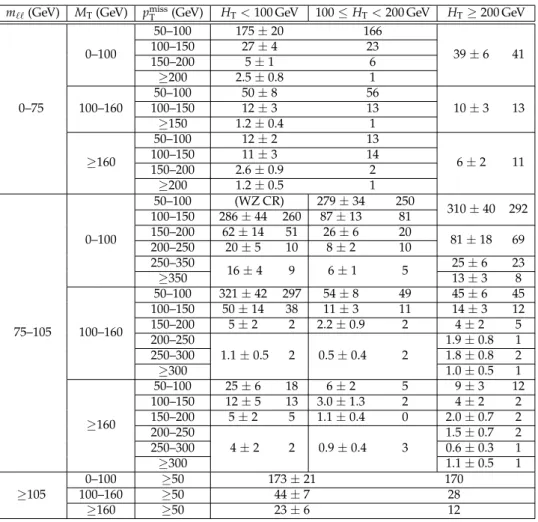
Table 3: Expected and observed event yields in the search regions. For each bin, the first num-ber corresponds to the expected yield and its total uncertainty while the second numnum-ber gives the observation. Where ranges of values are given for the selections, the lower bound is inclu-sive while the upper bound is excluinclu-sive, e.g., 75≤m`` <105 GeV.
m``(GeV) MT(GeV) pmissT (GeV) HT<100 GeV 100≤HT<200 GeV HT≥200 GeV
0–75 0–100 50–100 175±20 166 39±6 41 100–150 27±4 23 150–200 5±1 6 ≥200 2.5±0.8 1 100–160 50–100 50±8 56 10±3 13 100–150 12±3 13 ≥150 1.2±0.4 1 ≥160 50–100 12±2 13 6±2 11 100–150 11±3 14 150–200 2.6±0.9 2 ≥200 1.2±0.5 1 75–105 0–100 50–100 (WZ CR) 279±34 250 310±40 292 100–150 286±44 260 87±13 81 150–200 62±14 51 26±6 20 81±18 69 200–250 20±5 10 8±2 10 250–350 16±4 9 6±1 5 25±6 23 ≥350 13±3 8 100–160 50–100 321±42 297 54±8 49 45±6 45 100–150 50±14 38 11±3 11 14±3 12 150–200 5±2 2 2.2±0.9 2 4±2 5 200–250 1.1±0.5 2 0.5±0.4 2 1.9±0.8 1 250–300 1.8±0.8 2 ≥300 1.0±0.5 1 ≥160 50–100 25±6 18 6±2 5 9±3 12 100–150 12±5 13 3.0±1.3 2 4±2 2 150–200 5±2 5 1.1±0.4 0 2.0±0.7 2 200–250 4±2 2 0.9±0.4 3 1.5±0.7 2 250–300 0.6±0.3 1 ≥300 1.1±0.5 1 ≥105 0–100 ≥50 173±21 170 100–160 ≥50 44±7 28 ≥160 ≥50 23±6 12
7
Interpretation
The results of the searches described in Sections 5 and 6 are interpreted using the simplified models introduced in Section 2. Cross section limits as a function of the SUSY particle masses are set using a modified frequentist approach, employing the CLs criterion and an asymp-totic formulation [90–93]. The uncertainties in the signal efficiency and acceptance and in the
[GeV] T M Events / 20 GeV 1 10 2 10 3 10 4 10 5 10 WZ corridor Data WZ(200/100) → 0 χ∼ ± χ∼ WZ(350/250) → 0 χ∼ ± χ∼ WZ µ Nonprompt e/ ZZ/H Conversions VVV X t t Total bkg. unc. (13 TeV) -1 35.9 fb CMS [GeV] T M 0 20 40 60 80 100 120 140 160 180 200 Data / pred. 0.5 1.0
1.5 Stat. bkg. unc. Total bkg. unc.
[GeV] miss T p Events / 25 GeV 1 10 2 10 3 10 4 10 WZ corridor Data WZ(200/100) → 0 χ∼ ± χ∼ WZ(350/250) → 0 χ∼ ± χ∼ WZ µ Nonprompt e/ ZZ/H Conversions VVV X t t Total bkg. unc. (13 TeV) -1 35.9 fb CMS [GeV] miss T p 50 100 150 200 250 300 350 Data / pred. 0.5 1.0
1.5 Stat. bkg. unc. Total bkg. unc.
Events / 8 GeV 1 10 2 10 3 10 4 10 5 10 WZ corridor Data WZ(200/100) → ±∼0χ χ ∼ WZ(350/250) → ±∼0χ χ ∼ WZ µ Nonprompt e/ ZZ/H Conversions VVV X t t Total bkg. unc. (13 TeV) -1 35.9 fb CMS mℓℓ [GeV] 0 20 40 60 80 100 120 140 160 180 200 Data / pred. 0 1 2
3 Stat. bkg. unc. Total bkg. unc.
> 30 GeV) [GeV] T (jet p T H Events / 10 GeV 1 10 2 10 3 10 4 10 WZ corridor Data WZ(200/100) → 0 χ∼ ± χ∼ WZ(350/250) → 0 χ∼ ± χ∼ WZ µ Nonprompt e/ ZZ/H Conversions VVV X t t Total bkg. unc. (13 TeV) -1 35.9 fb CMS > 30 GeV) [GeV] T (jet p T H 0 20 40 60 80 100 120 140 160 180 200 Data / pred. 0.5 1.0 1.5
Stat. bkg. unc. Total bkg. unc.
Figure 5: Distributions of the transverse mass of the third lepton with respect to pmissT (upper left), the pmissT (upper right), the m``of the OSSF pair (lower left), and the HT(lower right). Dis-tributions for two signal mass points in the WZ corridor are overlaid for illustration. The mass values for the signal points are given as(m
e
χ02/mχe
0
1)in GeV. The bottom panel shows the ratio
of observed data to predicted yields. The dark purple band shows the statistical uncertainty in the background prediction, while the light blue band shows the total uncertainty.
Events 1 − 10 1 10 2 10 3 10 4 10 WZ corridor Data WZ(200/100) → ±χ∼0 χ ∼ WZ(350/250) → ±χ∼0 χ ∼ WZ µ Nonprompt e/ ZZ/H Conversions VVV X t t Total bkg. unc. (13 TeV) -1 35.9 fb CMS Search region 01 03 05 07 09 11 13 15 17 19 21 23 25 27 29 31 33 35 37 39 41 43 45 47 49 51 53 55 57 Data / pred. 0 1 2 3
Stat. bkg. unc. Total bkg. unc. mℓ ℓ(GeV) (GeV) T H (GeV) T M < 75 75 - 105 ≥ 105 < 200 ≥ 2 0 0 < 100 100 - 200 200 ≥ T H < 100 100 - 160 ≥ 1 6 0 < 100 100 - 160 ≥ 1 6 0 < 100 100 - 160 ≥ 1 6 0 < 100 100 - 160 ≥160 T M
Figure 6: Expected and observed yield comparison in the search regions. Two example signal mass points along the WZ corridor are overlaid for illustration. The mass values for the signal points are given as(m
e
χ02/mχe
0
1)in GeV. The bottom panel shows the ratio of observed data to
predicted yields. The dark purple band shows the statistical uncertainty in the background prediction, while the light blue band shows the total uncertainty.
[GeV] 0 2 χ∼ =m ± 1 χ∼ m 100 200 300 400 500 600 [GeV] 0 1 χ∼ m 0 100 200 300 3 − 10 2 − 10 1 − 10 1
95% CL upper limit on cross section [pb]
(13 TeV) -1 35.9 fb CMS 1 0 χ∼ 1 0 χ∼ WZ → 0 2 χ∼ ± 1 χ∼ → pp NLO-NLL excl. theory σ 1 ± Observed experiment σ 1 ± Expected
Figure 7: The 95% confidence level upper limit on the production cross section in the plane of m
e
χ±1 and mχe 0
1 for the model ofχe ± 1χe
0
2production with the WZ topology, using only the search re-quiring three or more leptons as described in Section 6. The thick solid black (dashed red) curve represents the observed (expected) exclusion contour assuming the theory cross sec-tions. The area below each curve is the excluded region. The thin dashed red lines indicate
the±1σexperimentuncertainty. The thin black lines show the effect of the theoretical
uncertain-ties (±1σtheory) on the signal cross section. The color scale shows the observed limit at 95% CL on the signal production cross section.
background predictions are incorporated as nuisance parameters. The observed data yields in control regions are typically incorporated either by a simultaneous maximum likelihood fit of the signal and control regions or through parameterization using the gamma function. Other nuisance parameters are implemented using lognormal functions, whose widths reflect the size of the systematic uncertainty, or as alternate shapes of the relevant distributions. Within each signal model, the experimental and theoretical uncertainties affecting the signal prediction are treated as fully correlated for all analyses. The dominant uncertainties in the background pre-dictions are not correlated among analyses as they tend to be either statistical in nature, arising from independent control regions, or uncertainties in the prediction methods, which are unique to each analysis. For each signal topology, the analyses with a check mark in Table 1 are com-bined to place exclusion limits.
The following sources of uncertainty in the signal acceptance and efficiency are assumed to be fully correlated among analyses: determination of the integrated luminosity, lepton identifica-tion and isolaidentifica-tion efficiency, lepton efficiency modeling in fast simulaidentifica-tion, b tagging efficiency, jet energy scale, modeling of pmissT in fast simulation, modeling of ISR, simulation of pileup, and variations of the generator factorization and renormalization scales. Variations in the PDF set used are found to primarily affect the signal acceptance by changing the pT distribution of the initially-produced sparticle pair,χe
± 1χe 0 2 orχe 0 1χe 0
1. This is already incorporated in the empirical uncertainty in the modeling of ISR as described in Section 4, and we therefore do not apply a dedicated uncertainty in signal acceptance from PDF variations. All analyses also include the statistical uncertainty of the simulated signal samples, which is taken as being uncorrelated in every bin, and the uncertainty in the modeling of the trigger efficiency, which is also taken as uncorrelated given the different trigger requirements applied in each analysis. Some anal-yses have additional uncertainties beyond these, such as the uncertainty in the modeling of the diphoton mass resolution for the H(γγ)analysis, which are analysis-specific and treated as
being uncorrelated. For the models ofχe
± 1χe
0
2production, 95% confidence level exclusion limits are presented in the plane of m
e
χ±1 and mχe 0
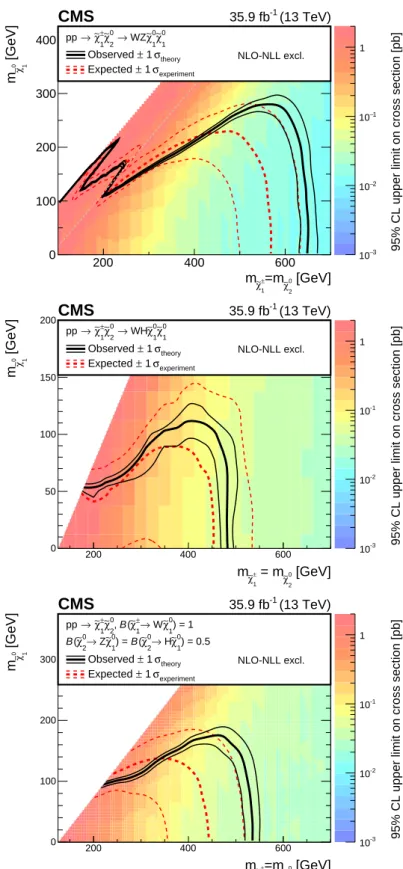
1. Figure 8 shows the exclusion limits for the combination of analyses for
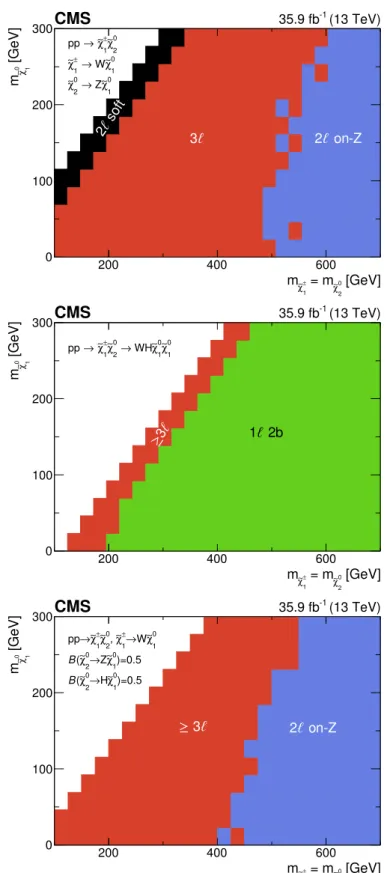
the WZ topology, the WH topology, and the mixed topology with 50% branching fraction to each of the WZ and WH channels. Figure 9 shows the analysis with the best expected limit for each point in the plane for the same topologies. The on-Z dilepton analysis generally gives the best sensitivity for large values of∆m = m
e
χ02 −mχe
0
1. The search for three light-flavor
lep-tons provides the best sensitivity at intermediate values of ∆m, including the region where ∆m≈ mZ, while the soft-dilepton analysis provides unique sensitivity to the smallest values of ∆m. Figure 10 (left) shows the observed and expected limit contours for each of the individual analyses considered in the combination, and Fig. 10 (right) shows the results from the combi-nation for all three topologies considered. For a massless LSPχe
0
1, the combined result gives an observed (expected) limit in m
e
χ±1 of about 650 (570) GeV for the WZ topology, 480 (455) GeV for the WH topology, and 535 (440) GeV for the mixed topology. The combination also excludes intermediate mass values that were not excluded by individual analyses, including m
e
χ±1 values between 180 and 240 GeV for a massless LSP in the WH topology.
For the models ofχe 0 1χe
0
1production, the exclusion limits are presented in the plane of mχe 0
1and the
branching fractionB(χe01→H eG). The decayχe 0
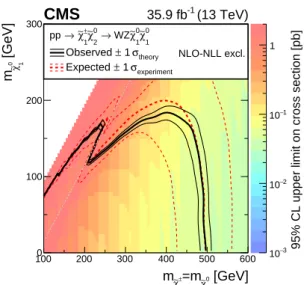
1 →Z eG is assumed to make up the remainder of the branching fraction. Figure 11 shows the observed and expected limits from the combination in this plane. The expected mass exclusion limit varies between about 550 and 750 GeV, being least stringent aroundB(χe01 → H eG) = 0.4. The observed limit ranges between about 650 and
[GeV] 0 2 χ∼ =m ± 1 χ∼ m 200 400 600 [GeV]0 χ∼1 m 0 100 200 300 400 3 − 10 2 − 10 1 − 10 1
95% CL upper limit on cross section [pb]
(13 TeV) -1 35.9 fb CMS 1 0 χ∼ 1 0 χ∼ WZ → 0 2 χ∼ ± 1 χ∼ → pp NLO-NLL excl. theory σ 1 ± Observed experiment σ 1 ± Expected [GeV] 0 2 χ∼ = m ± 1 χ∼ m 200 400 600 [GeV]0 χ∼1 m 0 50 100 150 200 -3 10 -2 10 -1 10 1
95% CL upper limit on cross section [pb]
(13 TeV) -1 35.9 fb CMS 1 0 χ∼ 1 0 χ∼ WH → 0 2 χ∼ ± 1 χ∼ → pp NLO-NLL excl. theory σ 1 ± Observed experiment σ 1 ± Expected [GeV] 0 2 χ∼ =m ± 1 χ∼ m 200 400 600 [GeV]0 1 χ∼ m 0 100 200 300 -3 10 -2 10 -1 10 1
95% CL upper limit on cross section [pb]
(13 TeV) -1 35.9 fb CMS ) = 1 1 0 χ∼ W → ± 1 χ∼ ( B , 0 2 χ∼ ± 1 χ∼ → pp ) = 0.5 1 0 χ∼ H → 0 2 χ∼ ( B ) = 1 0 χ∼ Z → 0 2 χ∼ ( B NLO-NLL excl. theory σ 1 ± Observed experiment σ 1 ± Expected
Figure 8: The 95% CL upper limits on the production cross sections in the plane of m e
χ±1 and mχe 0 1
for the models ofχe
± 1χe
0
2production with (upper) the WZ topology, (middle) the WH topology, or (lower) the mixed topology with 50% branching fraction to each of WZ and WH. The thick solid black (dashed red) curve represents the observed (expected) exclusion contour assuming the theory cross sections. The area below each curve is the excluded region. The thin dashed red lines indicate the±1σexperimentuncertainty. The thin black lines show the effect of the theoretical uncertainties (±1σtheory) on the signal cross section. The color scale shows the observed limit at 95% CL on the signal production cross section.
15 [GeV] 0 2 χ ∼ = m ± 1 χ ∼ m 200 400 600 [GeV] 0 1 χ∼ m 0 100 200 300 1 0 χ ∼ Z → 0 2 χ ∼ 1 0 χ ∼ W → ± 1 χ ∼ 0 2 χ ∼ ± 1 χ ∼ → pp 2ℓ on-Z 3ℓ 2ℓ soft (13 TeV) -1 35.9 fb CMS [GeV] 0 2 χ ∼ = m ± 1 χ ∼ m 200 400 600 [GeV] 0 1 χ∼ m 0 100 200 300 1 0 χ ∼ 1 0 χ ∼ WH → 0 2 χ ∼ ± 1 χ ∼ → pp ≥3ℓ 1ℓ 2b (13 TeV) -1 35.9 fb CMS [GeV] 0 2 χ ∼ = m ± 1 χ ∼ m 200 400 600 [GeV] 0 1 χ∼ m 0 100 200 300 )=0.5 0 1 χ ∼ H → 0 2 χ ∼ ( B )=0.5 0 1 χ ∼ Z → 0 2 χ ∼ ( B 0 1 χ ∼ W → ± 1 χ ∼ , 0 2 χ ∼ ± 1 χ ∼ → pp ≥3ℓ 2ℓ on-Z → (13 TeV) -1 35.9 fb CMS
Figure 9: The analysis with the best expected exclusion limit at each point in the plane of m e
χ±1 and m
e
χ01 for the models of χe
± 1χe
0
2production with (upper) the WZ topology, (middle) the WH topology, and (lower) the mixed topology 50% branching fraction to each of WZ and WH.
[GeV] 1 ± χ ∼ = m 2 0 χ ∼ m 100 200 300 400 500 600 [GeV]0 1 χ∼ m 0 50 100 150 200 250 300 350 2 0 χ∼ 1 ± χ ∼ → pp 35.9 fb-1 (13 TeV) CMS 1 0 χ ∼ = m 1 ± χ ∼ m Z +m 1 0 χ ∼ = m 1 ± χ ∼ m H +m 1 0 χ ∼ = m 1 ± χ ∼ m Expected Observed ≥ 3ℓ (WH) 1ℓ 2b (WH) H → γγ (WH) 2ℓ on-Z (WZ) 2ℓ soft (WZ) 3ℓ (WZ) [GeV] 1 ± χ∼ = m 2 0 χ∼ m 200 300 400 500 600 700 [GeV]0χ∼1 m 0 50 100 150 200 250 300 350 400 2 0 χ∼ 1 ± χ∼ → pp 35.9 fb-1 (13 TeV) CMS 1 0 χ ∼ = m 1 ± χ ∼ m Z +m 1 0 χ ∼ = m 1 ± χ ∼ m H +m 1 0 χ ∼ = m 1 ± χ ∼ m Expected Observed ) = 1 (WH) 1 0 χ∼ H → 2 0 χ∼ ( B ) = 1 (WZ) 1 0 χ∼ Z → 2 0 χ∼ ( B ) = 0.5 (WH+WZ) 1 0 χ∼ H → 2 0 χ∼ ( B ) = 1 0 χ∼ Z → 2 0 χ∼ ( B
Figure 10: Exclusion contours at 95% CL in the plane of m e
χ±1 and mχe 0
1 for the models ofχe ± 1χe
0 2 production (left) for the individual analyses and (right) for the combination of analyses. The decay modes assumed for each contour are given in the legends.
Figure 12 shows the observed limits from each analysis separately compared with the com-bined result. Figure 13 shows the analysis with the best expected exclusion limit for each point in the same plane. At higher values of m
e
χ01, the searches for at least one hadronically decay-ing boson provide the best sensitivity, the 4b search whenB(χe01 → H eG)is large and the on-Z
dilepton search when it is smaller. At lower values of m e
χ01, below around 200 GeV, the H(γγ) analysis is most sensitive whenB(χe01 →H eG)is large, while the three or more lepton search is
dominant when it is small. Figure 14 then shows the exclusion limits as a function of m e
χ01 for
three choices ofB(χe01→H eG): 0%, yielding the ZZ topology; 100%, yielding the HH topology;
and 50%, yielding a mix of events from the ZZ, HH, and ZH topologies.
8
Summary
A number of searches for the electroweak production of charginos and neutralinos predicted in supersymmetry (SUSY) have been performed in different final states. All searches considered here use proton-proton collision data at √s = 13 TeV, recorded with the CMS detector at the LHC and corresponding to an integrated luminosity of 35.9 fb−1. No significant deviations from the standard model expectations have been observed.
A targeted search requiring three or more charged leptons (electrons or muons) has been pre-sented, focusing on chargino-neutralino production where the difference in mass between
e
χ02 and χe 0
1 is approximately equal to the mass of the Z boson, and no significant deviations from the standard model predictions are observed. This search is interpreted in a simplified model scenario of SUSY chargino-neutralino (χe
± 1χe
0
2) production with decaysχe
± 1 →W±χe 0 1and e χ02 → Zχe 0 1, whereχe 0
1 is the lightest SUSY particle (LSP). In the targeted phase space, the ex-pected and observed 95% confidence level exclusion limits extend to 225 GeV in the mass ofχe
0 2 and 125 GeV in the mass ofχe
0
1, improving the observed limits from the previous publication by up to 60 GeV [38].
A statistical combination of several searches is performed and interpreted in the context of simplified models of either chargino-neutralino production, or neutralino pair production in
[GeV] 0 1 χ ∼ Higgsino mass m 200 400 600 800 1000 ) G ~ H → 0 1 χ∼( B 0 0.2 0.4 0.6 0.8 1 (13 TeV) -1 35.9 fb CMS 0 1 χ ∼ m ≈ ± 1 χ ∼ m ≈ 0 2 χ ∼ m = 1 GeV G~ m soft +X 0 1 χ ∼ 0 1 χ ∼ → ± 0, j χ ∼ ± 0, i χ ∼ → pp theo. σ 1 ± Observed exp. σ 1 ± Expected exp. σ 2 ± Expected
Figure 11: Combined exclusion contours at the 95% CL in the plane of m e χ01andB(χe 0 1→H eG)for the model ofχe 0 1χe 0
1 production. The area to the left of or below the solid (dashed) black curve represents the observed (expected) exclusion region. The green and yellow bands indicate the±1 and 2σ uncertainties in the expected limit. The thin black lines show the effect of the theoretical uncertainties (±1σtheory) on the signal cross section.
[GeV] 0 1 χ ∼ Higgsino mass m 200 400 600 800 1000 ) G ~ H → 0 1 χ∼( B 0 0.2 0.4 0.6 0.8 1 (13 TeV) -1 35.9 fb CMS 0 1 χ ∼ m ≈ ± 1 χ ∼ m ≈ 0 2 χ ∼ m = 1 GeV G~ m soft +X 0 1 χ ∼ 0 1 χ∼ → ± 0, j χ ∼ ± 0, i χ ∼ → pp 2ℓ on-Z ≥ 3ℓ 4b H → γγ Observed Expected
Figure 12: Observed exclusion contours at the 95% CL in the plane of m e
χ01 andB(χe
0
1 → H eG)
for the model ofχe 0 1χe
0
1production for each individual analysis compared with the combination. For the 4b contour, the region above is excluded, while for all others, the region to the left is excluded. The 4b search drives the exclusion at large values ofB(χe01 → H eG)while the on-Z
[GeV] 0 1 χ ∼ Higgsino mass m 200 400 600 800 1000 ) G ~ H → 0 1 χ∼( B 0 0.2 0.4 0.6 0.8 1 ≥ 3 ℓ 2ℓ on-Z 4b H → γ γ soft +X 0 1 χ∼ 0 1 χ ∼ → ± 0, j χ ∼ ± 0, i χ ∼ → pp 35.9 fb-1 (13 TeV) CMS
Figure 13: The analysis with the best expected exclusion limit at each point in the plane of m e
χ01 andB(χe01 →H eG)for the model ofχe
0 1χe
0
1production.
a gauge-mediated SUSY breaking (GMSB) scenario. For a massless LSP χe 0
1 in the chargino-neutralino model, the combined result gives an observed (expected) limit in the χe
±
1 mass of about 650 (570) GeV for the WZ topology, 480 (455) GeV for the WH topology, and 535 (440) GeV for the mixed topology. Compared to the results of individual analyses, the combination im-proves the observed exclusion limit by up to 40 GeV in the masses ofχe
±
1 andχe
0
2in the chargino-neutralino model. The combination also excludes intermediate mass values that were not ex-cluded by individual analyses, includingχe
±
1 masses between 180 and 240 GeV in the WH topol-ogy. In the GMSB neutralino pair model, the combined result gives an observed (expected) limit in the χe
0
1 mass of 650–750 (550–750) GeV. The combined result improves the observed limit by up to 200 GeV in the mass ofχe
0
1in the GMSB neutralino pair model, depending on the branching fractions for the SUSY particle decays. These results represent the most stringent constraints to date for all models considered.
Acknowledgments
We congratulate our colleagues in the CERN accelerator departments for the excellent perfor-mance of the LHC and thank the technical and administrative staffs at CERN and at other CMS institutes for their contributions to the success of the CMS effort. In addition, we grate-fully acknowledge the computing centers and personnel of the Worldwide LHC Computing Grid for delivering so effectively the computing infrastructure essential to our analyses. Fi-nally, we acknowledge the enduring support for the construction and operation of the LHC and the CMS detector provided by the following funding agencies: BMWFW and FWF (Aus-tria); FNRS and FWO (Belgium); CNPq, CAPES, FAPERJ, and FAPESP (Brazil); MES (Bulgaria); CERN; CAS, MoST, and NSFC (China); COLCIENCIAS (Colombia); MSES and CSF (Croatia); RPF (Cyprus); SENESCYT (Ecuador); MoER, ERC IUT, and ERDF (Estonia); Academy of Fin-land, MEC, and HIP (Finland); CEA and CNRS/IN2P3 (France); BMBF, DFG, and HGF (Ger-many); GSRT (Greece); OTKA and NIH (Hungary); DAE and DST (India); IPM (Iran); SFI (Ireland); INFN (Italy); MSIP and NRF (Republic of Korea); LAS (Lithuania); MOE and UM (Malaysia); BUAP, CINVESTAV, CONACYT, LNS, SEP, and UASLP-FAI (Mexico); MBIE (New Zealand); PAEC (Pakistan); MSHE and NSC (Poland); FCT (Portugal); JINR (Dubna); MON, RosAtom, RAS, RFBR and RAEP (Russia); MESTD (Serbia); SEIDI, CPAN, PCTI and FEDER
[GeV] 0 1 χ∼ Higgsino mass m 200 400 600 800 1000 Cross section [fb] -1 10 1 10 2 10 3 10 4 10 5 10 (13 TeV) -1 35.9 fb CMS soft +X G~ G~ ZZ → soft +X 0 1 χ∼ 0 1 χ∼ → ± 0, j χ∼ ± 0, i χ∼ → pp = 1 GeV G~ , m 0 1 χ∼ m ≈ ± 1 χ∼ m ≈ 0 2 χ∼ m ) = 1 G~ Z → 0 1 χ∼ ( B Observed exp. σ 1 ± Expected exp. σ 2 ± Expected theo. σ 1 ± NLO+NLL ≥ 3ℓ 2ℓ on-Z [GeV] 0 1 χ∼ Higgsino mass m 200 400 600 800 1000 Cross section [fb] -1 10 1 10 2 10 3 10 4 10 5 10 (13 TeV) -1 35.9 fb CMS soft +X G~ G~ HH → soft +X 0 1 χ∼ 0 1 χ∼ → ± 0, j χ∼ ± 0, i χ∼ → pp = 1 GeV G~ , m 0 1 χ∼ m ≈ ± 1 χ∼ m ≈ 0 2 χ∼ m ) = 1 G~ H → 0 1 χ∼ ( B Observed exp. σ 1 ± Expected exp. σ 2 ± Expected theo. σ 1 ± NLO+NLL H → γγ 4b ≥ 3ℓ [GeV] 0 1 χ∼ Higgsino mass m 200 400 600 800 1000 Cross section [fb] -1 10 1 10 2 10 3 10 4 10 5 10 (13 TeV) -1 35.9 fb CMS soft +X G~ G~ HZ → soft +X 0 1 χ∼ 0 1 χ∼ → ± 0, j χ∼ ± 0, i χ∼ → pp = 1 GeV G~ , m 0 1 χ∼ m ≈ ± 1 χ∼ m ≈ 0 2 χ∼ m ) = 0.5 G ~ Z → 0 1 χ∼ ( B ) = G ~ H → 0 1 χ∼ ( B Observed exp. σ 1 ± Expected exp. σ 2 ± Expected theo. σ 1 ± NLO+NLL H → γγ 4b ≥ 3ℓ 2ℓ on-Z
Figure 14: The 95% CL upper limits on the production cross sections as a function of m e χ01 for the model of χe 0 1χe 0
1 production with three choices of B(χe 0
1 → H eG): (upper) 0%, yielding the ZZ topology, (middle) 100%, yielding the HH topology, and (lower) 50%, yielding the ZH mixed topology. The solid black line represents the observed exclusion. The dashed black line represents the expected exclusion, while the green and yellow bands indicate the±1 and 2σ uncertainties in the expected limit. The red line shows the theoretical cross section with its uncertainty. The other lines in each plot show the observed exclusion for individual analyses.
(Spain); Swiss Funding Agencies (Switzerland); MST (Taipei); ThEPCenter, IPST, STAR, and NSTDA (Thailand); TUBITAK and TAEK (Turkey); NASU and SFFR (Ukraine); STFC (United Kingdom); DOE and NSF (USA).
Individuals have received support from the Marie-Curie program and the European Research Council and Horizon 2020 Grant, contract No. 675440 (European Union); the Leventis Foun-dation; the A. P. Sloan FounFoun-dation; the Alexander von Humboldt FounFoun-dation; the Belgian Fed-eral Science Policy Office; the Fonds pour la Formation `a la Recherche dans l’Industrie et dans l’Agriculture (FRIA-Belgium); the Agentschap voor Innovatie door Wetenschap en Technologie (IWT-Belgium); the Ministry of Education, Youth and Sports (MEYS) of the Czech Republic; the Council of Science and Industrial Research, India; the HOMING PLUS program of the Foun-dation for Polish Science, cofinanced from European Union, Regional Development Fund, the Mobility Plus program of the Ministry of Science and Higher Education, the National Science Center (Poland), contracts Harmonia 2014/14/M/ST2/00428, Opus 2014/13/B/ST2/02543, 2014/15/B/ST2/03998, and 2015/19/B/ST2/02861, Sonata-bis 2012/07/E/ST2/01406; the National Priorities Research Program by Qatar National Research Fund; the Programa Severo Ochoa del Principado de Asturias; the Thalis and Aristeia programs cofinanced by EU-ESF and the Greek NSRF; the Rachadapisek Sompot Fund for Postdoctoral Fellowship, Chulalongkorn University and the Chulalongkorn Academic into Its 2nd Century Project Advancement Project (Thailand); the Welch Foundation, contract C-1845; and the Weston Havens Foundation (USA).
References
[1] P. Ramond, “Dual theory for free fermions”, Phys. Rev. D 3 (1971) 2415, doi:10.1103/PhysRevD.3.2415.
[2] Y. A. Gol’fand and E. P. Likhtman, “Extension of the algebra of Poincar´e group generators and violation of P invariance”, JETP Lett. 13 (1971) 323.
[3] A. Neveu and J. H. Schwarz, “Factorizable dual model of pions”, Nucl. Phys. B 31 (1971) 86, doi:10.1016/0550-3213(71)90448-2.
[4] D. V. Volkov and V. P. Akulov, “Possible universal neutrino interaction”, JETP Lett. 16 (1972) 438.
[5] J. Wess and B. Zumino, “A lagrangian model invariant under supergauge
transformations”, Phys. Lett. B 49 (1974) 52, doi:10.1016/0370-2693(74)90578-4. [6] J. Wess and B. Zumino, “Supergauge transformations in four dimensions”, Nucl. Phys. B
70(1974) 39, doi:10.1016/0550-3213(74)90355-1.
[7] P. Fayet, “Supergauge invariant extension of the Higgs mechanism and a model for the electron and its neutrino”, Nucl. Phys. B 90 (1975) 104,
doi:10.1016/0550-3213(75)90636-7.
[8] H. P. Nilles, “Supersymmetry, supergravity and particle physics”, Phys. Rep. 110 (1984) 1, doi:10.1016/0370-1573(84)90008-5.
[9] S. Dimopoulos and G. F. Giudice, “Naturalness constraints in supersymmetric theories with nonuniversal soft terms”, Phys. Lett. B 357 (1995) 573,
[10] R. Barbieri and D. Pappadopulo, “S-particles at their naturalness limits”, JHEP 10 (2009) 061, doi:10.1088/1126-6708/2009/10/061, arXiv:0906.4546.
[11] M. Papucci, J. T. Ruderman, and A. Weiler, “Natural SUSY endures”, JHEP 09 (2012) 035,
doi:10.1007/JHEP09(2012)035, arXiv:1110.6926.
[12] A. J. Buras, J. R. Ellis, M. K. Gaillard, and D. V. Nanopoulos, “Aspects of the grand unification of strong, weak and electromagnetic interactions”, Nucl. Phys. B 135 (1978) 66, doi:10.1016/0550-3213(78)90214-6.
[13] H. E. Haber and G. L. Kane, “The search for supersymmetry: Probing physics beyond the standard model”, Phys. Rept. 117 (1985) 75, doi:10.1016/0370-1573(85)90051-1. [14] G. R. Farrar and P. Fayet, “Phenomenology of the production, decay, and detection of
new hadronic states associated with supersymmetry”, Phys. Lett. B 76 (1978) 575, doi:10.1016/0370-2693(78)90858-4.
[15] H. Goldberg, “Constraint on the photino mass from cosmology”, Phys. Rev. Lett. 50 (1983) 1419, doi:10.1103/PhysRevLett.50.1419. [Erratum:
doi:10.1103/PhysRevLett.103.099905].
[16] J. R. Ellis et al., “Supersymmetric relics from the big bang”, Nucl. Phys. B 238 (1984) 453,
doi:10.1016/0550-3213(84)90461-9.
[17] Joint LEP2 SUSY Working Group, the ALEPH, DELPHI, L3 and OPAL Collaborations. http://lepsusy.web.cern.ch/lepsusy/. http://lepsusy.web.cern.ch/lepsusy/. [18] ATLAS Collaboration, “Search for electroweak production of supersymmetric states in
scenarios with compressed mass spectra at√s=13 TeV with the ATLAS detector”, (2017). arXiv:1712.08119. Submitted to Phys. Rev. D.
[19] ATLAS Collaboration, “Search for the electroweak production of supersymmetric particles in√s=8 TeV pp collisions with the ATLAS detector”, Phys. Rev. D 93 (2016) 052002, doi:10.1103/PhysRevD.93.052002, arXiv:1509.07152.
[20] ATLAS Collaboration, “Search for photonic signatures of gauge-mediated
supersymmetry in 8 TeV pp collisions with the ATLAS detector”, Phys. Rev. D 92 (2015) 072001, doi:10.1103/PhysRevD.92.072001, arXiv:1507.05493.
[21] ATLAS Collaboration, “Search for metastable heavy charged particles with large
ionisation energy loss in pp collisions at√s=8 TeV using the ATLAS experiment”, Eur. Phys. J. C 75 (2015) 407, doi:10.1140/epjc/s10052-015-3609-0,
arXiv:1506.05332.
[22] ATLAS Collaboration, “Search for direct pair production of a chargino and a neutralino decaying to the 125 GeV Higgs boson in√s=8 TeV pp collisions with the ATLAS detector”, Eur. Phys. J. C 75 (2015) 208, doi:10.1140/epjc/s10052-015-3408-7,
arXiv:1501.07110.
[23] ATLAS Collaboration, “Searches for heavy long-lived charged particles with the ATLAS detector in proton-proton collisions at√s=8 TeV”, JHEP 01 (2015) 068,
[24] ATLAS Collaboration, “Search for nonpointing and delayed photons in the diphoton and missing transverse momentum final state in 8 TeV pp collisions at the LHC using the ATLAS detector”, Phys. Rev. D 90 (2014) 112005,
doi:10.1103/PhysRevD.90.112005, arXiv:1409.5542.
[25] ATLAS Collaboration, “Search for the direct production of charginos, neutralinos and staus in final states with at least two hadronically decaying taus and missing transverse momentum in pp collisions at√s=8 TeV with the ATLAS detector”, JHEP 10 (2014) 096, doi:10.1007/JHEP10(2014)096, arXiv:1407.0350.
[26] ATLAS Collaboration, “Search for supersymmetry in events with four or more leptons in√ s =8 TeV pp collisions with the ATLAS detector”, Phys. Rev. D 90 (2014) 052001, doi:10.1103/PhysRevD.90.052001, arXiv:1405.5086.
[27] ATLAS Collaboration, “Search for direct production of charginos, neutralinos and sleptons in final states with two leptons and missing transverse momentum in pp collisions at√s=8 TeV with the ATLAS detector”, JHEP 05 (2014) 071,
doi:10.1007/JHEP05(2014)071, arXiv:1403.5294.
[28] ATLAS Collaboration, “Search for direct production of charginos and neutralinos in events with three leptons and missing transverse momentum in√s=8 TeV pp collisions with the ATLAS detector”, JHEP 04 (2014) 169, doi:10.1007/JHEP04(2014)169, arXiv:1402.7029.
[29] ATLAS Collaboration, “Search for charginos nearly mass degenerate with the lightest neutralino based on a disappearing-track signature in pp collisions at√s=8 TeV with the ATLAS detector”, Phys. Rev. D 88 (2013) 112006,
doi:10.1103/PhysRevD.88.112006, arXiv:1310.3675.
[30] CMS Collaboration, “Searches for electroweak production of charginos, neutralinos, and sleptons decaying to leptons and W, Z, and Higgs bosons in pp collisions at 8 TeV”, Eur. Phys. J. C 74 (2014) 3036, doi:10.1140/epjc/s10052-014-3036-7,
arXiv:1405.7570.
[31] CMS Collaboration, “Searches for electroweak neutralino and chargino production in channels with Higgs, Z, and W bosons in pp collisions at 8 TeV”, Phys. Rev. D 90 (2014) 092007, doi:10.1103/PhysRevD.90.092007, arXiv:1409.3168.
[32] CMS Collaboration, “Search for supersymmetry in electroweak production with photons and large missing transverse energy in pp collisions at√s=8 TeV”, Phys. Lett. B 759 (2016) 479, doi:10.1016/j.physletb.2016.05.088, arXiv:1602.08772. [33] CMS Collaboration, “Search for supersymmetry in events with soft leptons, low jet
multiplicity, and missing transverse energy in proton-proton collisions at√s=8 TeV”, Phys. Lett. B 759 (2016) 9, doi:10.1016/j.physletb.2016.05.033,
arXiv:1512.08002.
[34] CMS Collaboration, “Search for supersymmetry in events with a photon, a lepton, and missing transverse momentum in pp collisions at√s=8 TeV”, Phys. Lett. B 757 (2016) 6,
doi:10.1016/j.physletb.2016.03.039, arXiv:1508.01218.
[35] CMS Collaboration, “Search for electroweak production of charginos in final states with two τ leptons in pp collisions at√s =8 TeV”, JHEP 04 (2017) 018,
[36] CMS Collaboration, “Searches for long-lived charged particles in pp collisions at√s=7 and 8 TeV”, JHEP 07 (2013) 122, doi:10.1007/JHEP07(2013)122,
arXiv:1305.0491.
[37] CMS Collaboration, “Search for disappearing tracks in proton-proton collisions at√
s =8 TeV”, JHEP 01 (2015) 96, doi:10.1007/JHEP01(2015)096,
arXiv:1411.6006.
[38] CMS Collaboration, “Search for electroweak production of charginos and neutralinos in multilepton final states in proton-proton collisions at√s=13 TeV”, (2017).
arXiv:1709.05406. Submitted to JHEP.
[39] CMS Collaboration, “Search for new physics in events with two low momentum opposite-sign leptons and missing transverse energy at√s =13 TeV”, (2017). arXiv:1801.01846. Submitted to Phys. Lett. B.
[40] CMS Collaboration, “Search for supersymmetry with Higgs boson to diphoton decays using the razor variables at√s=13 TeV”, (2017). arXiv:1709.00384. Submitted to Phys. Lett. B.
[41] CMS Collaboration, “Search for higgsino pair production in pp collisions at√s=13 TeV in final states with large missing transverse momentum and two Higgs bosons decaying via H→bb”, (2017). arXiv:1709.04896. Submitted to Phys. Rev. D.
[42] CMS Collaboration, “Search for new phenomena in final states with two opposite-charge, same-flavor leptons, jets, and missing transverse momentum in pp collisions at√
s =13 TeV”, (2017). arXiv:1709.08908. Submitted to JHEP.
[43] CMS Collaboration, “Search for electroweak production of charginos and neutralinos in WH events in proton-proton collisions at√s=13 TeV”, JHEP 11 (2017) 029,
doi:10.1007/JHEP11(2017)029, arXiv:1706.09933.
[44] J. Alwall, P. Schuster, and N. Toro, “Simplified models for a first characterization of new physics at the LHC”, Phys. Rev. D 79 (2009) 075020,
doi:10.1103/PhysRevD.79.075020, arXiv:0810.3921.
[45] J. Alwall, M.-P. Le, M. Lisanti, and J. G. Wacker, “Model-independent jets plus missing energy searches”, Phys. Rev. D 79 (2009) 015005,
doi:10.1103/PhysRevD.79.015005, arXiv:0809.3264.
[46] D. Alves et al., “Simplified models for LHC new physics searches”, J. Phys. G 39 (2012) 105005, doi:10.1088/0954-3899/39/10/105005, arXiv:1105.2838.
[47] CMS Collaboration, “Interpretation of searches for supersymmetry with simplified models”, Phys. Rev. D 88 (2013) 052017, doi:10.1103/PhysRevD.88.052017,
arXiv:1301.2175.
[48] ATLAS and CMS Collaborations, “Measurements of the Higgs boson production and decay rates and constraints on its couplings from a combined ATLAS and CMS analysis of the LHC pp collision data at√s=7 and 8 TeV”, JHEP 08 (2016) 045,
doi:10.1007/JHEP08(2016)045, arXiv:1606.02266.
[49] S. P. Martin, “A supersymmetry primer”, in Perspectives on Supersymmetry II, G. L. Kane, ed., p. 1. World Scientific, 2010. arXiv:hep-ph/9709356. Adv. Ser. Direct. High Energy Phys., vol. 21. doi:10.1142/9789814307505_0001.