UNIVERSIDADE DE LISBOA
FACULDADE DE CIÊNCIAS
DEPARTAMENTO DE ENGENHARIA GEOGRÁFICA, GEOFÍSICA E ENERGIA
100% Renewable electricity supply for
Portugal and Spain
Mariana Raposo Fernandes
Dissertação de Mestrado Integrado em Engenharia da Energia e do Ambiente
UNIVERSIDADE DE LISBOA
FACULDADE DE CIÊNCIAS
DEPARTAMENTO DE ENGENHARIA GEOGRÁFICA, GEOFÍSICA E ENERGIA
100% Renewable electricity supply for
Portugal and Spain
Mariana Raposo Fernandes
Dissertação de Mestrado Integrado em Engenharia da Energia e do Ambiente
Trabalho realizado sob a supervisão de
Professor Dr. Olav Hohmeyer (Universität Flensburg)
Professor Dr. Miguel Centeno Brito (FCUL)
iii
A
BSTRACTClimate change and other questions concerning environmental issues are current topics that have been demanding several studies and investigations. The use of non-renewable energy sources is the main driver of these problems. Therefore, there is the need to seriously consider the possibility of a transition to an electricity supply system exclusively based on renewable energies sources. The goal of this dissertation is to study and develop scenarios to apply this system in Portugal and Spain, for the year 2050, and the sources considered are solar, wind and run-of-river. Results of a simulation model were used (Renewable Energy Pathways Simulation System - RENPASS), developed by a research team of the University of Flensburg, in Germany, and applied to that country and its surrounding countries. The scenarios development was done by defining the installation power of photovoltaic and wind, in MW. Using those defined values and the model results (which define, among others, each source potential) it is possible to calculate the electricity production coming from each source. The residual load is a factor that allowed the analysis and the evaluation of the five created scenarios, and it is calculated by subtracting the electricity production (generated by the three renewable sources mentioned above) from the electricity demand. Installation costs (investment) and electricity transmission costs were also taken into account. The three first scenarios aimed at achieving a yearly residual load approximately null, when summing up hourly values. The fourth scenario was defined by having a greatest installed power (solar and wind), which entailed high installation costs, but simultaneously lower transmission costs. As one concluded that storage using electric cars is neither feasible nor realistic, and also that transmission is the highest expenditure and therefore it should be avoided, the fifth scenario with much higher installation values was created. In any case, under any scenario, there will always be the electricity transmission need, because it is not possible to create a scenario that has a constant null residual load associated, either due to excess or lack of production.
v
R
ESUMOAs alterações climáticas e restantes questões ambientais são temas atuais que têm exigido inúmeros estudos e investigações. O uso de fontes de energia não renovável é o principal impulsionador destes problemas, e é preciso ponderar seriamente uma transição para um sistema de fornecimento de eletricidade baseado exclusivamente em fontes de energia renovável. O objetivo desta dissertação é estudar e desenvolver cenários para aplicação deste sistema em Portugal e Espanha, para o ano de 2050, sendo que as fontes consideradas foram a solar, eólica e hidroelétrica (fio de água). Foram usados os resultados de um modelo de simulação – Renewable Energy Pathways Simulation System (RENPASS) –, desenvolvido por uma equipa de investigação da Universidade de Flensburg, na Alemanha, e aplicado a esse país e aos seus países vizinhos. A criação de cenários é feita pela definição das potências de instalação de fotovoltaico e eólico, em MW. Através disso e dos resultados do modelo, que definem, entre outros, o potencial de cada fonte, é calculada a produção de eletricidade proveniente de cada uma. A carga residual é um fator que permitiu a análise e avaliação dos cinco cenários criados e é calculado pela subtração da produção de eletricidade das três fontes renováveis referidas acima à procura de eletricidade. Os custos de instalação (investimento) e os custos de transmissão de eletricidade também foram considerados. Os primeiros três cenários tiveram como critério atingir uma carga residual anual aproximadamente nula, quando somados os valores horários. O quarto cenário foi definido como sendo o de maior potência instalada (solar e eólica), o que implicou altos custos de instalação, mas simultaneamente muito mais baixos custos de transmissão. Como se concluiu que o armazenamento feito por baterias de carros elétricos não é viável, e que a transmissão é muito dispendiosa e deve ser evitada, foi criado o quinto cenário com valores de instalação muito superiores. Independentemente do cenário, vai ser sempre necessária a transmissão de eletricidade, porque não é possível criar um cenário em que a carga residual seja constantemente nula, seja por excesso de produção ou por defeito.
Palvras-chave:
100% Renovável, Carga residual, Fornecimento/procura de eletricidade, Modelo RENPASSvii
A
CKNOWLEDGMENTSI am sincerely grateful to my supervisor, professor Miguel Centeno Brito, who motivated me to do my Erasmus term. His high professionalism and excellent ability to be a brilliant professor encouraged me. After the meetings with him, I always felt more confident about my work.
I also want to thank my co-supervisor, professor Olav Hohmeyer, from Germany, who suggested me this topic and showed a great hospitality when I was in Flensburg. His knowledge motivated me constantly.
I want to express my gratitude to Clemens Wingenbach, for his excellent guidance, flexibility and availability for our very long and useful meetings.
A very special thank goes to my flatmates in Flensburg, Ann-Kathrin Sawinski and Larissa Zierke, and also to Laura Behrens, who supported me during the hard and the very happy moments in my entire Erasmus experience in Germany.
I want to thank my closer friends that I met at my home University and at the Electricity Museum, and also my childhood friends for the continuous support.
I would like to deeply thank my boyfriend, André, not only for his non-stop personal support, but also for his suggestions and precious help. He could always make me feel calm in my anxious moments. Finally, I must extremely thank my parents, my siblings, brothers-in-law, sisters-in-law, nephew Miguel and nephew Duarte, who was born during the last weeks of work. Their patience, wise advices and unconditional care were the most important for me.
ix
T
ABLE OFC
ONTENTS Abstract ... iii Resumo ... v Acknowledgments ... ix Table of Figures ... xi Table of Tables ... xvAcronyms and Abbreviations ... xvii
1. Introduction ... 1
1.1 Motivation and goals ... 1
1.2 Renewable electricity technologies ... 3
1.3 State of the art ... 6
1.4 About RENPASS ... 7
2. Methodology ... 9
2.1 Data collection and processing ... 9
2.1.1 Demand ... 9
2.1.2 Generating capacity... 10
2.1.3 Production ... 11
2.2 Data interpretation... 14
2.3 RENPASS Results ... 15
2.4 Comparison between modeled data and measured data: validating RENPASS results ... 16
2.5 Residual load calculation ... 18
3. Scenarios Development... 21
3.1 Changing the Demand factor and the Generating capacity ... 22
3.2 Costs in 2050: Initial investment ... 22
3.3 Full load hours ... 22
3.4 Status Quo of Portugal and Spain ... 23
4. Results and Discussion ... 29
x
4.2 ‘Less solar, more wind’ Scenario ... 31
4.3 ‘Lower Costs’ Scenario ... 33
4.4 ‘Total Residual Load < 0’ Scenario ... 35
4.5 Deep analysis of the four scenarios – Monthly residual load, duration curves, day/night residual load and costs ... 37
4.6 Seasonal storage ... 44
4.7 The German and the Iberian residual loads for 2050 ... 46
4.8 Electricity transmission: Energy and Costs - Two Scenarios ... 49
4.9 The Fifth Scenario: Independence Scenario for the Iberian Peninsula ... 52
5. Conclusion and Future Work ... 55
6. References ... 57
xi
T
ABLE OFF
IGURESFigure 1.1- Generic schematic cross-section illustrating the operation of an illuminated solar cell
(Intergovernmental Panel on Climate Change, 2012) ... 3
Figure 1.2 - Grid-connected PV system (Aladdin Solar, LLC., 2008) ... 4
Figure 1.3 - Stand-alone PV system (Aladdin Solar, LLC., 2008)... 4
Figure 1.4 - Basic components of a modern horizontal-axis wind turbine - designed by the NREL (Intergovernmental Panel on Climate Change, 2012) ... 5
Figure 1.5 - Run-of-river hydropower plant (Intergovernmental Panel on Climate Change, 2012) ... 6
Figure 1.6 - Peninsular electricity demand coverage in 2013 (%) (Red Eléctrica de España - REE) ... 7
Figure 2.1 - Load hourly values, Portugal, 2012, ENTSO-e ... 10
Figure 2.2 – Load hourly values, Spain, 2012, ENTSO-e ... 10
Figure 2.3 - Solar production in 2012, ENTSO-e ... 12
Figure 2.4 - Wind production in 2012, ENTSO-e ... 13
Figure 2.5 – Run-of-river production, 2012, ENTSO-e ... 13
Figure 2.6 – Run-of-river production, 2013, REN ... 14
Figure 2.7 - Electricity consumption, Iberian Peninsula, 2012 (normalized) ... 14
Figure 2.8 - Electricity consumption for 4 different season days, Portugal, 2012 ... 15
Figure 2.9 - Electricity consumption for 4 different season days, Spain, 2012 ... 15
Figure 2.10 - Solar results, RENPASS Model (Normalized values) ... 16
Figure 2.11 - Wind results, RENPASS Model (Normalized values) ... 16
Figure 2.12 - Solar production, Portugal, 2012: Comparing modeled and measured data ... 17
Figure 2.13 - Wind production, Portugal, 2012: Comparing modeled and measured data ... 17
Figure 2.14 - Solar production, Spain, 2012: Comparing modeled and measured data ... 18
Figure 2.15 - Wind production, Spain, 2012: Comparing modeled and measured data ... 18
Figure 3.1 - Fixed values ... 21
Figure 3.2 - Changeable cells ... 21
xii
Figure 3.4 – Yearly residual load, Portugal 2012 ... 24
Figure 3.5 - Duration curve of the yearly residual load, Portugal 2012 ... 25
Figure 3.6 - Monthly residual road, Portugal 2012 ... 25
Figure 3.7 - Yearly residual load according to the 4 seasons and to the time period, Portugal 2012.... 26
Figure 3.8 - Yearly residual load, Spain 2012 ... 26
Figure 3.9 - Duration curve of the yearly residual load, Spain 2012 ... 27
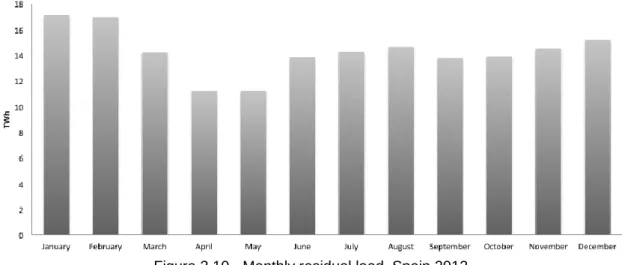
Figure 3.10 - Monthly residual load, Spain 2012 ... 27
Figure 3.11 - Yearly residual load according to the 4 seasons and to the time period, Spain 2012 ... 28
Figure 4.1 – ‘S. and W. 50%-50%’ Scenario for 2050: Yearly RL (Portugal) ... 30
Figure 4.2 - 'S. and W. 50%-50%' Scenario for 2050: Yearly RL (Spain) ... 31
Figure 4.3 - ‘Less S., More W.’ Scenario for 2050: Yearly RL (Portugal) ... 32
Figure 4.4 - ‘Less S., More W.’ Scenario for 2050: Yearly RL (Spain) ... 32
Figure 4.5 - 'Lower Costs' Scenario for 2050: Yearly RL (Portugal) ... 33
Figure 4.6 - 'Lower Costs' Scenario for 2050: Yearly RL (Spain) ... 34
Figure 4.7 - 'Total RL < 0' Scenario for 2050: Yearly RL (Portugal) ... 36
Figure 4.8 - 'Total RL < 0' Scenario for 2050: Yearly RL (Spain) ... 36
Figure 4.9 - Monthly residual load: four scenarios for 2050 (Portugal) ... 38
Figure 4.10 - Duration curve of the yearly residual load: four scenarios for 2050 (Portugal) ... 38
Figure 4.11 - Yearly residual load according to the time period: 4 scenarios for 2050 (Portugal) ... 39
Figure 4.12 - Yearly residual load according to the 4 seasons and to the time period: 4 scenarios for Portugal in 2050 ... 40
Figure 4.13 - Costs for Portugal: four scenarios for 2050 ... 40
Figure 4.14 - Monthly residual load: four scenarios for 2050 (Spain) ... 41
Figure 4.15 - Duration curve of the yearly residual load: four scenarios for 2050 (Spain) ... 42
Figure 4.16 - Yearly residual load according to the time period: four scenarios for 2050 (Spain) ... 43
Figure 4.17 - Yearly residual load according to the 4 seasons and to the time period: 4 scenarios for Spain in 2050 ... 43
Figure 4.18 - Costs for Spain: four scenarios for 2050 ... 44
xiii
Figure 4.20 - Storage need: scenario 4.2 for Spain [TWh] ... 45
Figure 4.21 - German residual load for 2050 (RENPASS model) ... 46
Figure 4.22 - Iberian residual load for 2050 - Scenario 4.2 ... 47
Figure 4.23 - Iberian residual load for 2050 - Scenario 4.4 ... 47
Figure 4.24 - Monthly residual load: Germany and Scenario 4.2 for the Iberian Peninsula for 2050 .. 48
Figure 4.25 - Monthly residual load: Germany and Scenario 4.4 for the Iberian Peninsula for 2050 .. 48
Figure 4.26 - Electricity transmission scenarios: from Germany to Portugal in 2050 ... 50
Figure 4.27 - Electricity transmission scenarios: from Germany to Spain in 2050 ... 50
Figure 4.28 - European map: Iberian Peninsula centroid (Madrid) and German centroid (Kassel) ... 51
Figure 4.29 - Monthly residual load: the 5th scenario for 2050 ... 53
Figure 4.30 - The 5th scenario for 2050: Costs for Portugal ... 53
xv
T
ABLE OFT
ABLESTable 2.1 - Generating Capacity [MW], ENTSO-e ... 11
Table 2.2 - Databases ... 11
Table 2.3 - Yearly electricity production [GWh] ... 12
Table 2.4 - Yearly deviations between modeled and measured data: in yellow, based on ENTSO-e; in blue, based on P. F. Bach ... 18
Table 2.5 - Residual load calculation scheme ... 19
Table 3.1 - Costs for 2050 [c€/kWh] ... 22
Table 3.2 - Full load hours [h] ... 23
Table 3.3 - Iberian Peninsula - Generating capacities, 2012, [MW] ... 24
Table 4.1 - Scenarios for 2050: Portugal [MW] ... 29
Table 4.2 - Scenarios for 2050: Spain [MW] ... 29
Table 4.3 – ‘S. and W. 50%-50%’ Scenario for 2050, [MW] ... 30
Table 4.4 – ‘Less S., More W.’ Scenario for 2050, [MW] ... 31
Table 4.5 – ‘Lower Costs’ Scenario for 2050, [MW] ... 33
Table 4.6 - 'Total Residual Load < 0' Scenario for 2050, [MW] ... 35
Table 4.7 - Costs for Portugal: four scenarios for 2050 [M€] ... 40
Table 4.8 - Costs for Spain: four scenarios for 2050 [M€]... 43
Table 4.9 - Total yearly electricity transmission for 2050 imported from Germany [TWh] ... 49
Table 4.10 - Total yearly electricity transmission costs for 2050 imported from Germany [M€] ... 51
Table 4.11 - Summary of costs [M€] ... 52
xvii
A
CRONYMS ANDA
BBREVIATIONSCO2 Carbon Dioxide
ENTSO-e European network of transmission system operators for electricity
GHG Greenhouse gases
HPP Hydropower plant
IPCC Intergovernmental Panel on Climate Change
PV Photovoltaic
RE Renewable energy
REE Red Eléctrica de España
REN Redes Energéticas Nacionais
RENPASS Renewable Energy Pathways Simulation System
RL Residual load
RoR Run-of-river
100% Renewable electricity supply for Portugal and Spain
Mariana Raposo Fernandes 1
1. I
NTRODUCTIONRecently, real world experiences and studies have shown that renewable energies can provide a substantial share of the energy demand. Keep on using non-renewable energy sources is not, at all, a sustainable option, given the current levels of greenhouse gas (GHG) emissions and all the environmental problems. Everything is directly or indirectly connected to these matters: the fossil sources, environmental worries, wildlife, worldwide pollution, climate changes, etc.
It is known that is extremely important to change the way we all consume and produce our energy. There are many options for lowering GHG emissions from the energy system, and meanwhile still satisfying the global demand for energy services. This need is due to the fact that GHG emissions resulting from the provision of energy services contribute significantly to the increase of atmospheric GHG concentrations.
As well as having a large potential to mitigate climate change, renewable energies can provide wider benefits. Renewable energies (RE) may, in implemented properly, contribute to the economic and social development, energy access, a secure energy supply and reduce negative impacts on the environment and health. RE involves a heterogeneous range of technologies, and various types of renewable energies can supply electricity (Intergovernmental Panel on Climate Change, 2012).
The ideal would be that we all live and work in a “low carbon society”, with high levels of energetic efficiency and reduced emissions, and we would all use electric transportation. The cities would be cleaner and the air quality much higher. Many of these technologies already exist but, most of the times, it is a matter of energy policies and not only a matter of potential in terms of renewable sources. Nonetheless, the European Union is committed to reducing the CO2 emissions in 20% until 2050, relatively to the year 1990 (Energias de Portugal, S.A., 2012). In fact, there are three main and general goals:
1) Reduce greenhouse gas emissions in 20%;
2) Reduce total cost of energy (energy bills and total cost of electricity generation);
3) Reduce implementation difficulties (given the necessary public acceptance of the energy policies adopted).
However, the conditions for supporting renewable energies have to be enhanced both on the European and nation levels.
1.1 Motivation and goals
The need to reduce CO2 emissions and rapidly rising energy costs has induced a growing demand for sustainable energies. Several reports and researchers have been saying this and actually, according to the SRU1, a 100% fully renewable energy supply is possible, safe and affordable. However, the time period and costs to this system transformation have been causing controversial discussions.
Greenhouse gas emissions need to be reduced 80-95% in order to avoid a global increase of 2 Celsius degrees, and a detailed analysis of the potential of renewable energy sources for electricity production shows that energy supply only based on renewable energy sources by 2050 is a possible scenario (German Advisory Council on the Environment - SRU, 2011).
1
100% Renewable electricity supply for Portugal and Spain
Mariana Raposo Fernandes 2
It is important to clarify that the year 2050 is really not a distant date, taking into account the level and the duration of this kind of investments and that measures taken now will have influence in 36 years. Power plants would have to be replaced next years. Based on an appropriate expansion of storage and network facilities it is possible to have the foreseeable maximum demand for electricity, so the supply can be guaranteed in spite of variations in energy production. The transition to renewables does not require a big service life extension or construction of new coal-fired power plant.
Although this study is regarding electricity supply and not energy supply in general, the important global idea to keep in mind is that the technical potential of renewable energy technologies to supply energy services exceeds current demands (Intergovernmental Panel on Climate Change, 2012).
This dissertation is about an electricity supply based 100% on renewable energies, namely photovoltaic (PV), wind and run-of-river, for 2050, for the Iberian Peninsula. RENPASS (Renewable
Energy Pathways Simulation System), developed by a research team of the University of Flensburg, is
used for this study. The mentioned model was already successfully implemented for Germany, Denmark, Sweden, Norway, Finland, Lithuania, Latvia, Estonia, Poland, Czech Republic, Austria, France, Switzerland, Belgium and Netherlands (Wingenbach, RENPASS). In the sub-chapter ‘About RENPASS’ the model will be fully explained.
Moreover, this dissertation intend to create several scenarios about solar and wind power installation, and the residual load is the main factor used to evaluate these scenarios. For that, the RENPASS model can provide normalized values regarding wind and solar production, for Portugal and Spain. These values are used on the scenarios development of this thesis and were calculated based on the potential of these two sources, such as solar radiation and wind speed. The residual load is defined by the difference between the electricity demand and the electricity production that the solar, wind and run-of-river energies provide.
The first task of this study is to collect all the necessary data. Measured data regarding electricity demand, and electricity production from solar, wind and run-of-river is collected, for several years, for Portugal and Spain. Afterwards, the RENPASS model is used to provide hourly values for solar and wind production. One of the goals of this study is to test the modeled data by RENPASS, comparing it to the measured real data collected from the database used, such as ENTSO-e2, REN3 and P.F. Bach4.
This dissertation is divided into the following chapters: chapter 2 describes the methodology used; chapter 3 explains how the scenarios are developed and created; in chapter 4 the results are shown and discussed, and several solutions are proposed; and finally, chapter 5 presents the main conclusions and states what future work can be done regarding this topic.
2
European Network of Transmission System Operators for Electricity 3
Redes Energéticas Nacionais: this is a Portuguese energy sector company which is the current concession holder of the country’s two main energy infrastructure networks: the national electricity transmission grid and the national natural gas transportation grid
4
100% Renewable electricity supply for Portugal and Spain
Mariana Raposo Fernandes 3
1.2 Renewable electricity technologies
Renewable energy technologies are definitely unique, they can be difficult to model, and they are diverse with wide-ranging characteristics. With some exceptions, renewable energy resources are location-restricted and cannot be easily stored or transported. One of the biggest barriers of this kind of alternative sources is the great difficulty of storage, and they are usually characterized by their intrinsic variability. Natural variations in weather patterns cause the output of renewable power plants to vary at all timescales. Particularly, maybe the most consequential are the annual, seasonal diurnal and sub-hourly variability of wind and solar power plants due to changing weather conditions and clouds.
Photovoltaic
The generation of electricity using PV panels is a worldwide phenomenon. Solar energy is ample and offers a significant potential for near-term (2020) and long-term (2050) climate change mitigation. There are a wide variety of solar technologies of varying maturities that can, in most regions of the world, contribute to a suite of energy services. Even though solar energy generation still only represents a small fraction of total energy consumption, markets for solar technologies are growing fast. Much of the interest of solar technology is its naturally smaller environmental ‘footprint’ and the opportunity it offers for positive social impacts. The actual deployment achieved will depend on the degree of continued innovation, supportive public policies and cost reductions, but there are facts that cannot be changed: solar energy is the most abundant of all energy resources, and the rate at which solar energy is intercepted by the Earth is around 10000 times greater than the rate at which human kind consumes energy (Intergovernmental Panel on Climate Change, 2012). Although not all countries are equally endowed with solar energy, Portugal and Spain have the potential to take a great part of this source.
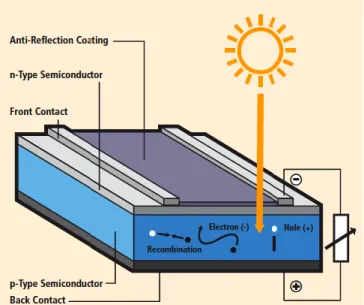
Figure 1.1 shows a basic scheme of what happens to an illuminated solar cell.
Figure 1.1- Generic schematic cross-section illustrating the operation of an illuminated solar cell (Intergovernmental Panel on Climate Change, 2012)
Photovoltaic solar technologies generate electricity by exploiting the photovoltaic effect. If the light shines on a semiconductor, such as silicon, electron-hole pairs are generated, and those are separated
100% Renewable electricity supply for Portugal and Spain
Mariana Raposo Fernandes 4
by an electric field created by introducing special impurities into the mentioned semiconductor either side of an interface known as a p-n junction. This phenomenon creates negative charges on one side of the interface and positive charges on the other side. Afterwards, a voltage is created by this charge separation. If the two sides of the illuminated cell are connected to a load, current starts flowing.
Solar production is associated to a natural distribution, as it has a great potential all over the countries, especially in Portugal and Spain. An important technology to decrease the emissions of carbon dioxide caused by domestic fuel consumption is the roof-mounted photovoltaic systems, because they also help saving energy and financial costs. Therefore, today the worldwide use of solar systems is increasing. Private investors as well as local authorities have rising interest in identifying roof areas that are suitable for mounting solar systems (Kassner, Koppe, Schüttenberg, & Bareth, 2008). Large solar power plants can also have a great contribution on the fight against conventional power plants. Figure 1.2 Figure 1.3 show a grid-connected photovoltaic power system with battery backup and an off-grid/stand-alone that incorporates large amounts of battery storage to provide power when the sun is not available.
Figure 1.2 - Grid-connected PV system (Aladdin Solar, LLC., 2008)
100% Renewable electricity supply for Portugal and Spain
Mariana Raposo Fernandes 5
Wind energy
Wind energy is a mature renewable energy source that has been successfully deployed in many countries. Countries such as Germany have a great potential to take energy from this source. It is technically and economically capable of substantial continued expansion and its further exploitation may be a crucial aspect of global greenhouse gases reduction strategies. Wind energy relies, indirectly on the energy of the sun. A small proportion of the solar radiation received by the Earth is converted into kinetic energy (Hubbert, 1971). The earth rotation, geographic features and temperature gradients effect the location and nature of the resulting winds (Burton, Jenkins, Sharpe, & Bossanyi, 2001). The use of wind energy requites that the kinetic energy of moving air be converted to useful energy: electricity. As a result of this occurrence, the economics of using wind for electricity supply are highly sensitive to local wind conditions and the ability of wind turbines to reliably extract energy over a wide range of typical wind speeds.
Figure 1.4 represents the basic components of a wind turbine.
Figure 1.4 - Basic components of a modern horizontal-axis wind turbine - designed by the NREL5 (Intergovernmental Panel on Climate Change, 2012)
Run-of-River
A RoR HPP (Run-of-River hydropower plant) draws the energy for electricity production from the available flow of the river. Such a hydropower plant may include some short-term storage (hourly, daily), allowing some adaptations to the demand profile, but the generation profile will vary depending on flow conditions. As a result, generation depends on precipitation and runoff and may have substantial daily, monthly or seasonal patterns. In this dissertation this energy is considered to be a must-run energy. When the short-term storage is not included, the RoR HPPs generate profiles that are even more variable. Since most precipitation usually falls in mountainous areas, where elevation differences are the largest, the largest potential for hydropower development is in this kind of regions, or in rivers coming from such regions.
5
100% Renewable electricity supply for Portugal and Spain
Mariana Raposo Fernandes 6
In a RoR HPP, a portion of the river water might be diverted to a channel or pipeline to carry the water to a hydraulic turbine, which is connected to an electricity generator. Installations of such hydropower plants are relatively inexpensive and such facilities have, in general, lower environmental impacts than similar-sized storage hydropower plants.
Figure 1.5 shows how a run-of-river hydropower plant looks like.
Figure 1.5 - Run-of-river hydropower plant (Intergovernmental Panel on Climate Change, 2012)
1.3 State of the art
Several studies and researches about renewable energy systems have been done along the last years. What has been implemented is depending more on the policies and not so much on the lack of information and investigation work.
There is currently a group of researchers working on a recent model that will be used for this study. The model, RENPASS, is an integrated techno-economic simulation model for the electricity supply of different European countries. Besides the fact that lots of work has been done around this transition for the 100% renewable electricity supply, this model was quite innovative. As this model was already successfully implemented for German and its surrounding countries, some master’s students are developing this topic based on the model, and extending it for other countries. In this dissertation, it will be done for Portugal and Spain, and not all the model will be used, but only a part of it (the model includes a very big range of simulations and calculations about different aspects). In this specific case, the RENPASS results are obtained in a normalized values format. Afterwards, these results are multiplied by a power installation (of wind or solar, in MW), which allow us to acquire hourly values of electricity production.
By 2020 Portugal will have a share of energy from renewable sources, specifically for electricity demand, of 55,3% and Spain 40% (German Advisory Council on the Environment - SRU, 2011). The energy investments made today will determine the shape of the energy industry for a long time to come, and particularly the electricity industry. If the investments nowadays keep on being climate-unfriendly, it will not be possible to reach a long term climate policy goal of reducing greenhouse gas emissions. Investigations done about this topic also prove that transitioning to an entirely renewable
100% Renewable electricity supply for Portugal and Spain
Mariana Raposo Fernandes 7
electricity supply would greatly increase the ability of the European Union to bring greenhouse gas emissions down to the requisite levels.
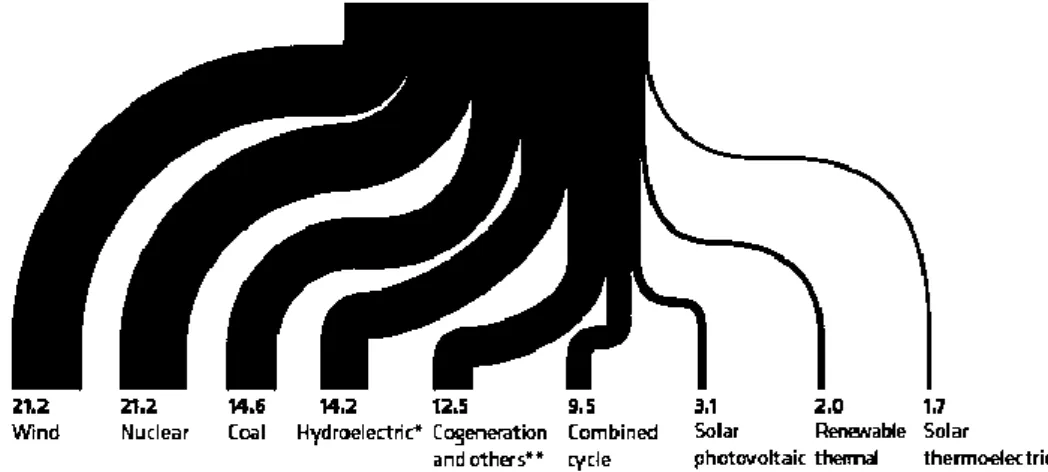
Right now, the electricity demand coverage for Portugal and Spain is the one represented in Figure 1.6.
Figure 1.6 - Peninsular electricity demand coverage in 2013 (%) (Red Eléctrica de España - REE) There are only a few fundamental technical limits to the integration of a majority share of RE, but for sure that there are areas that need development: transmission and distribution infrastructures, generation flexibility, energy storage technologies, demand management, and improvement of forecasting and operational planning methods (Intergovernmental Panel on Climate Change, 2012). According to Connolly, Lund, Mathiesen, & Leahy, 2009, there is no energy tool that addresses all issues related to integrating renewable energy, but instead the ‘ideal’ energy tool is highly dependent on the specific objectives that must be fulfilled. The paper mentioned includes a review of the different computer tools that can be used to analyze the integration of renewable energy.
1.4 About RENPASS
RENPASS is a simulation model that has been developed by a research group at the University of Flensburg. Using RENPASS, different pathways of energy transition can be simulated with a high temporal and regional resolution. The model calculates on a quarter hour basis the power supply in future sustainable energy systems, thereby enabling a 100% renewable energies system. The calculations of the fluctuating electricity supply are always depending on the weather influence, and there is the need to ensure a matching of supply and demand for every point in time, so also controllable components, like hydro pump storage, biomass or compressed air storages could be used in the electricity system. The model provides, among others, quarterly-hour results about the individual generating plants, reservoir levels, power flow between the model regions and resulting prices (Wiese, Renewable Energy Pathway Simulation System - Manual, 2013). For this dissertation, not all these components were calculated. Only the normalized values for wind and solar were obtained from the model and used to calculate production, depending on the installations that were set up for the different scenarios (Wingenbach, Adaption of wind turbine and photovoltaic simulation algorithms of RENPASS to Portugal and Spain, 2014). These scenarios were defined manually according to some criteria.
The goal of the energy transition is to achieve a 100% renewable energy supply. One of the main and more important questions that can be studied using the model is how production and demand can be provided in such a flexible system and what contributions can different shares of certain technologies
100% Renewable electricity supply for Portugal and Spain
Mariana Raposo Fernandes 8
make. This different energy transition phases are comparable in a transparent way and, in order to achieve this real transparency, RENPASS is based exclusively on open source software (Wiese & Bökenkamp, Renewable Energy Pathways Simulation System, 2014).
RENPASS allows the simulation of different scenarios that combine different pathways in the areas demand, renewable expansion, thermal power plants, storage development, grid development, economic parameters and exchange algorithms. Before simulating an energy system there are an enormous number of parameters that have to be set. The installed capacities and expansion pathways of the different energy sources are set exogenously for the period to be analyzed. For each time step, the production of wind, solar and run-of-river electricity is subtracted from the demand. The so-called residual load, defined before, is then supposed to be supplied by the least expensive combination of the fully controllable production plants, storage units and grid utilization (Wiese, Renewable Energy Pathway Simulation System - Manual, 2013).
Licenses for open source software are designed to guarantee the freedom to share and change all versions of a program and to make sure it remains free software for all its users. If changed copies of the software are distributed, the distributor has to make sure that the recipients can also get the source code and that they get to know which rights they have. The GNU – General Public License is a free copy left license for software and other kinds of works, and RENPASS will be published under GNU GPL 3. According to this license, everybody can use RENPASS and adjust it to their needs, and this is important to keep the model open (Wiese, Renewable Energy Pathway Simulation System - Manual, 2013).
The aims of this model are: to be a techno-economic simulation of 100% renewable energy systems and pathways; comparability, transparency and reliability of assumptions for credibility; dependency of the active participation of the users; retrievability of mistakes in the calculation and data; making gaps in data availability obvious and modular setting to combine expert knowledge of different areas. For this dissertation, not all the areas of the model were taken in consideration (Wingenbach, RENPASS).
100% Renewable electricity supply for Portugal and Spain
Mariana Raposo Fernandes 9
2. M
ETHODOLOGYIn this chapter, the methodology used for this thesis is explained in detail, mapping out the methods that were used throughout the work. It also summarizes the important values that will be used later on the project, and which components will be studied. A big part of this chapter is about data collection and therefore all databases will be mentioned. Charts and tables were created to provide a better overall view of the three energy sources that were taken into consideration, and also regarding electricity demand. After that, an explanation will be provided as to why these data were collected, how they take part of the study, and how they will be manipulated. A data interpretation is also done, along with the RENPASS results. The RENPASS results are included in this chapter, since they are part of the methodology. Modeled data and measured data are compared during this chapter, in order to validate results.
2.1 Data collection and processing
The first step was to collect real measured data from consistent sources to be used as the basis of the current work and hypothesis. Data about demand, wind and solar potential and also about the run-of-rivers’ energy were collected. These non-modeled data were mainly collected from ENTSO-e, but also from other sources that will be referenced below.
One of the purposes of data collection was to compare it with modeled data. As it was already referred, this work is based on modeled data provided by the RENPASS model. This model was already tested for Germany (Wingenbach, RENPASS). Therefore, another goal of this study was to test if the model could be applied to Portugal and Spain. Thus, in order to rely on these modeled data, it is useful to compare it with data that can be collected from databases.
After data collection, several scenarios regarding demand, generating capacity and production can be created. For instance, after obtaining demand data, a factor value is set up to multiple the demand values for that factor. Moreover, if a scenario considers a 10% demand increase by 2050, regarding 2012, the factor would be 1.1. This will also work for the generating capacity: with a small range of calculations one can get the energy production from each source, just by setting up a value for the installation of the sources that will be taken into consideration.
As a result, the residual load can be calculated based on demand and energy production scenarios. Moreover, this calculation of residual load, for Portugal and Spain, can later help in making a better analysis.
The model was developed for common years. As 2012 was a leap year, the last day of the year (31st December) was not considered for practical purposes (Wingenbach, Adaption of wind turbine and photovoltaic simulation algorithms of RENPASS to Portugal and Spain, 2014). Without this step, calculations would not be possible.
It is important to mention that all the procedures made in this work were exactly the same for Portugal and Spain, with the exception of some data format and preparation.
2.1.1 Demand
The hourly load values [MW] were collected for Portugal and Spain, for the years of 2012 and 2013. These values correspond to the hourly average active power absorbed by all installations connected to the transmission network or to the distribution network, excluding pumps of pumped-storage stations and the consumption of generating auxiliaries. However, network losses are included. In the database6 it is possible to download the hourly load values for a specific country and for a specific month. The initial idea was to collect demand data for Portugal and Spain for 2013 (latest year). However, given the fact that other required data were only available for the year of 2012, demand data for this
6
100% Renewable electricity supply for Portugal and Spain
Mariana Raposo Fernandes 10
year were also collected. This was done in order to maintain consistency throughout the whole study. Several charts were created, for both countries, in order to evaluate the monthly demand characterization (that leads to energy consumption). These data was obtained from ENTSO-e.
Figure 2.1 - Load hourly values, Portugal, 2012, ENTSO-e
Figure 2.2 – Load hourly values, Spain, 2012, ENTSO-e
It is important to point out that consumption should not be confused with load. Load is always a snapshot of one single moment (power, with units of GW), while consumption describes a time period (energy, with units of GWh). Moreover, load is calculated as an average value for every hour and therefore consumption can be calculated based on a load integral.
2.1.2 Generating capacity
The net generating capacity of a power station is the maximum electrical net active power it can produce continuously throughout a long period of operation in normal conditions, where ‘net’ means the difference between the gross generating capacity of the alternators and the auxiliary equipments’ load and the losses in the main transformer of the power station. The net generating capacity of a country is the sum of the individual net generating capacities of all power stations connected to either the transmission grid or to the distribution grid.
Data collection was done regarding years 2010 to 2013, to be able to have an idea of the installed power (in MW) during this period. However, the needed data to study the status quo refer only to 2012 and were specified for each kind of renewable energy. These data were collected from ENTSO-e. The following table shows what data were needed for this work, as a reference. However, data about the run of the rivers were not available.
100% Renewable electricity supply for Portugal and Spain
Mariana Raposo Fernandes 11
Table 2.1 - Generating Capacity [MW], ENTSO-e
Portugal Spain Solar (PV) 122 4,104 2010 155 4,916 2011 220 6,444 2012 282 6,894 2013 Wind 3,705 19,821 2010 4,080 20,729 2011 4,194 22,534 2012 4,368 22,768 2013
2.1.3 Production
From the ENTSO-e database it is also possible to collect data regarding the detailed monthly production of Portugal and Spain. This data collection was made for the years 2010 to 2013. However, unlike demand data, production data were only available in monthly values. There were also collected data from REN, and from Paul-Frederik Bach, in a quarter-hour basis and in an hour basis, respectively.
Although data were collected for the past four years, only data for 2012 were considered for the present study, because that is the most recent year with the most reliable and updated data. Energy production mainly depends on the installed power of wind, solar, run of the rivers, and also on renewable sources offer during these years (like wind speed, radiation, and precipitation levels). This production values analysis worked as a comparison tool, in order to check the applicability of RENPASS’s modeled data to Portugal and Spain. The latest kind of renewable energy was the run-of-rivers, as it was noticed that it could be very useful, mainly because this is also a dispatchable energy source. Table 2.2 summarizes the measured data sources.
Table 2.2 - Databases Portugal Spain Solar (PV) ENTSO-e ENTSO-e
Wind ENTSO-e ENTSO-e
P. F. Bach Run of River REN* REN7 ENTSO-e ENTSO-e 7
This data was calculated based on the one for Portugal(*): normalized according to the yearly electricity production of both countries, since it was not possible to find reliable data
100% Renewable electricity supply for Portugal and Spain
Mariana Raposo Fernandes 12
Table 2.3 - Yearly electricity production [GWh]
Portugal Spain Solar (PV) - - 2010 - - 2011 357 11,615 2012 447 13,135 2013 Wind 9,023 43,357 2010 9,002 42,105 2011 10,011 48,471 2012 11,751 55,356 2013 Run of River - - 2010 - - 2011 3,669 6,544 2012 6,986 9,606 2013
No data regarding solar energy and run of river energy was available for the years 2010 and 2011.
2.1.3.1
Solar
Electricity production resulting from solar energy both in Portugal and Spain mainly depends on solar energy power plants. As the potential is quite substantial, the electricity production does not depend that much on that potential. By analyzing the monthly values, it is possible to notice that there is a higher offer from this kind of renewable energy during the summer. However, this source of energy is still profitable during winter (Figure 2.3).
Figure 2.3 - Solar production in 2012, ENTSO-e
2.1.3.2
Wind
Given the fact that the wind power installation on both countries is the same during the year of 2012, production variations are mainly caused by weather conditions. As can be seen, production patterns in Portugal are not that different from those of Spain. The main disparity concerns the power installation, which makes sudden variations in the Spanish wind production when wind conditions change and smoother variations in Portugal when weather conditions change. Apart from this, a significant
0 10 20 30 40 50 0 200 400 600 800 1000 1200 1400 1600 G Wh (Por tu ga l) G Wh (S p ain) Spain Portugal
100% Renewable electricity supply for Portugal and Spain
Mariana Raposo Fernandes 13
uncertainty in the estimate of energy from a wind plant is the interannual and interseasonal variation in energy output (Baker, Walker, & Wade, 1990).
Figure 2.4 - Wind production in 2012, ENTSO-e
2.1.3.3
Run-of-River
The electricity produced from the run-of-rivers was considered later on the present study. These data were not available for the years of 2010 and 2011. For 2012 and 2013, only monthly values were available from ENTSO-e. Later on, data in a quarter-hour basis for 2013, for Portugal, were possible to obtain, unlike data about wind and solar production. Data for 2013 were collected from REN, after thorough research and after contacting some researchers on this field. Though, as these data were only available in a quarter-hour basis, raw data has gone through a process: every four values were summed up so that one could get hourly data. As there were no data about this type of energy production for Spain, data were normalized for Spain, according to yearly electricity production of both countries (ENTSO-e), as pointed out before.
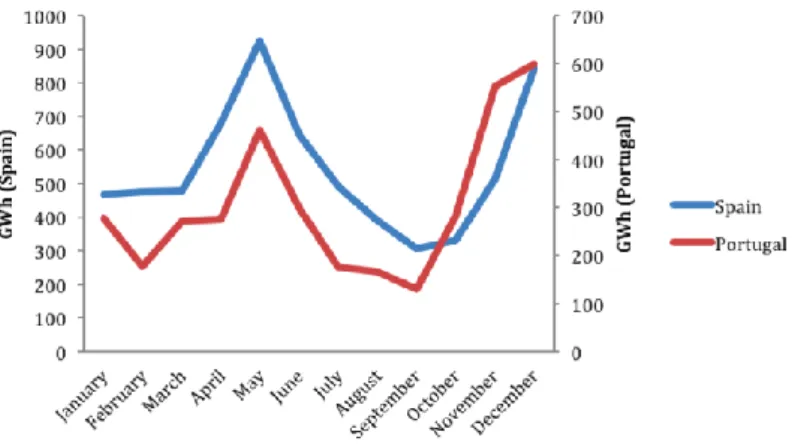
Figure 2.5 shows how this source offer is changing throughout the year.
Figure 2.5 – Run-of-river production, 2012, ENTSO-e
As the run-of-river potential is still not clear and studies do not provide any concrete information about it, it was assumed that the energy taken from this renewable source in 2013 would at least be the same as in 2050. 0 200 400 600 800 1000 1200 1400 0 1000 2000 3000 4000 5000 6000 Ja nua ry M ar ch M ay Jul y Se pt em be r N ove mb er G Wh (Por tu ga l) G Wh (S p ain) Spain Portugal 0 100 200 300 400 500 600 700 0 200 400 600 800 1000 G Wh (Por tu ga l) G Wh (S p ain) Spain Portugal
100% Renewable electricity supply for Portugal and Spain
Mariana Raposo Fernandes 14
Figure 2.6 – Run-of-river production, 2013, REN
2.2 Data interpretation
First of all, one can notice that electricity consumption increases substantially, in both countries, during the warm and the cold seasons. This means that both countries have two relatively extreme seasons, which require heating/cooling during winter and during summer. Spring and autumn are periods that apparently have comfortable climate conditions. Unlike Germany, Portugal and Spain have high needs for cooling power during summer.
From November to February, electricity consumption is also higher than during the warmer seasons. Higher artificial lighting and cooling needs can be considered as a reason for this fact.
Many users using a lot of electricity at the same time cause periods of peak demand. For example, on a hot day many households and offices will turn up their air-conditioning, causing a sharp increase in electricity demand. There could be other explanations, such as holidays, companies’ production peaks, heat waves, cold waves (increases heating needs), etc.
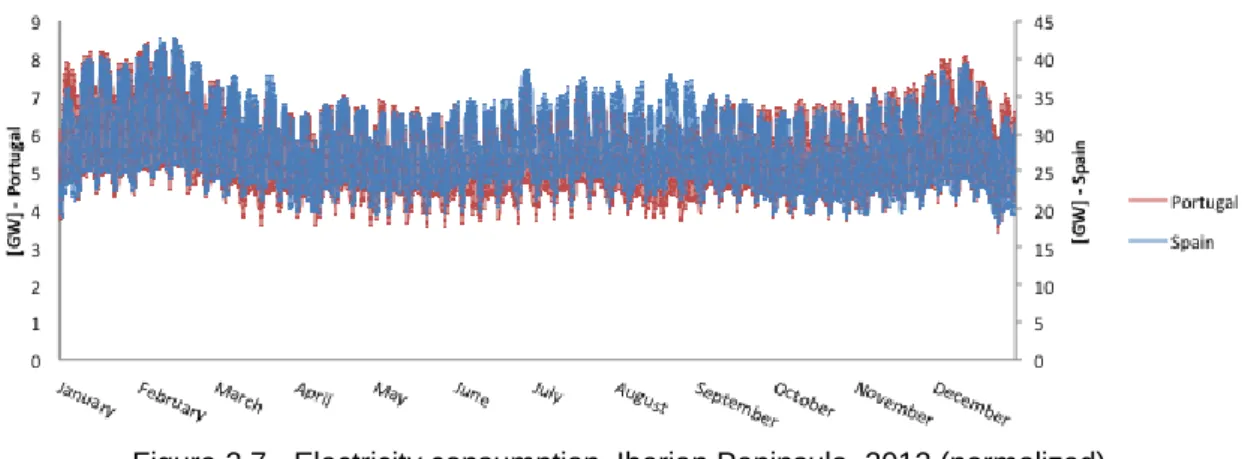
As figure 2.7 shows, Spain’s electricity demand is five times higher than Portugal’s. This is due to obvious differences in population and country size.
Figure 2.7 - Electricity consumption, Iberian Peninsula, 2012 (normalized)
A more detailed study regarding electricity consumption was also done, in order to verify how the daily characterization would be.
100% Renewable electricity supply for Portugal and Spain
Mariana Raposo Fernandes 15
Figure 2.8 - Electricity consumption for 4 different season days, Portugal, 2012
Figure 2.9 - Electricity consumption for 4 different season days, Spain, 2012
Even in different seasons of the year, one can realize that there is a daily demand pattern, present throughout the year. However, it is interesting to consider that a possible change in demand peaks will show up in 2050. The main change will probably be on daily demand, due to different life styles and tariffs.
According to figure 2.3, Spain has a greater potential for solar energy production than Portugal. As both countries have approximately the same weather conditions and, for this reason, roughly the same amount of solar radiation, this figure makes it very clear that it is just a matter of installed power - and subsequently, energy policies – than a matter of potential and energy offer. Despite this, it is clearly shown the natural structure of this chart: a much higher solar production between April and October, which is typical of a North Hemisphere country that has not a very usual cloudy weather.
If we look to figures 2.5 and 2.6, it is possible to verify that there is a lower rate of precipitation during the warm season, around summer and autumn, and a much higher increase during winter and especially during spring. This influences directly, as one can see, the run of the rivers electricity production, which means this source has the power to be a great contribution to satisfy the demand needs during this period.
2.3 RENPASS Results
The RENPASS results were obtained in hourly values, according and based on wind speed, radiation, etc. and those were the values where this work relied on. These RENPASS results were hourly normalized values for: wind and solar in Spain and wind and solar in Portugal. These four RENPASS results were obtained in a .csv format and they were worked on until they could be usefully evaluated. Although these were values in an hourly basis, they were transformed in monthly values in order to be easily analyzed. Figures 2.10 and 2.11 provide us a general overview of comparison between these two sources in Portugal and Spain.
100% Renewable electricity supply for Portugal and Spain
Mariana Raposo Fernandes 16
Figure 2.10 - Solar results, RENPASS Model (Normalized values)
Figure 2.11 - Wind results, RENPASS Model (Normalized values)
As the model considers mainly weather conditions, apart the installations of wind turbines and solar panels, it is easily noticeable that both countries have quite the same potential, concerning wind and solar energies. It is possible to confirm this fact if one compares figures 2.3 and 2.10. The same works for wind: it is very useful to compare Figure 2.4.
2.4 Comparison between modeled data and measured data: validating RENPASS
results
In general, data quality is never as high as we need it but still, obviously, measured data is always better and more reliable than modeled data. It is viable to use modeled data if, for example, it is not possible to get reliable measured data or if one of the goals is to test the model in use. In that case, a comparison is a way to verify whether the model is working properly or not. In this specific situation, the model was already implemented to Germany and to its surrounding countries and one of the objectives is to verify if some parts of the model (those required for this work) can be adapted, if they are working properly, and also if the model itself can really be extended and implemented for Portugal and Spain. This process makes part of the results validation.
In order to build a method of comparison, between modeled and measured data, the modeled data obtained from the RENPASS model, which was taken for solar and wind in Portugal and solar and wind in Spain, was multiplied by the generating capacity [MW] of each corresponding energy. For example, the 3760 normalized hourly values of solar in Portugal in 2012 were multiplied by the installed solar power of that year (220 MW). Subsequently, one obtained 3760 values in MW, and they were summed up in order to get monthly values so, afterwards, the result is twelve monthly values in GWh. From then on, these values could already be compared with the ENTSO-e measured data, which could only be collected in a monthly format.
0 0.050.1 0.150.2 0.250.3 0.350.4 Spain Portugal 0 0.050.1 0.150.2 0.250.3 0.350.4 Spain Portugal
100% Renewable electricity supply for Portugal and Spain
Mariana Raposo Fernandes 17
The same procedure was done for the other data, except for wind in Spain. In this case, in addiction to this process, as it was possible to get hourly values, from P. F. Bach (mentioned above), a deeper evaluation was feasible. Besides the analysis based on the ENTSO-e data, the modeled data could also be compared with this other source (P. F. Bach), on an hourly basis. Unfortunately, this could not be done for the data for Portugal and solar for Spain.
Despite the fact that it is much more useful and precise to have hourly values, they can only be comparable with ENTSO-e data if they are also converted in monthly values. The ideal would be to have measured hourly data, from ENTSO-e or another database, for all the sources.
Figures 2.12 and 2.13 show how this comparison was taken into consideration.
Figure 2.12 - Solar production, Portugal, 2012: Comparing modeled and measured data
Figure 2.13 - Wind production, Portugal, 2012: Comparing modeled and measured data
For the solar production in Portugal, the yearly deviation between the modeled data and the measured data is -0.1%, based on the ENTSO-e data (measured). On the other hand, the yearly deviation for wind production in Portugal is higher: 4.8% (Figures 2.12 and 2.13).
0 10 20 30 40 50 60 G Wh Modeled Data Measured Data (ENTSO-e)
100% Renewable electricity supply for Portugal and Spain
Mariana Raposo Fernandes 18
Figure 2.14 - Solar production, Spain, 2012: Comparing modeled and measured data
Figure 2.15 - Wind production, Spain, 2012: Comparing modeled and measured data
For the solar production in Spain, the yearly deviation between the modeled and the measured data is 2.5%, based on the ENTSO-e data (measured). For the wind production in Spain, there is in addiction the P. F. Bach measured data, which could be collected in a hourly basis, but it was summed up to be comparable with the ENTSO-e data. This time, the yearly deviation based on ENTSO-e is 3.5%, and the deviation based on P. F. Bach is 5.3%.
According to figure 2.15, it is easy to realize that both measured data are matching reasonably well, which is a sign that both data are reliable and trustworthy.
Table 2.4 summarizes the yearly deviations between the modeled and the measured data, for both countries and for both energy sources.
Table 2.4 - Yearly deviations between modeled and measured data: in yellow, based on ENTSO-e; in blue, based on P. F. Bach
Solar Wind
Portugal -0.1 % 4.8 %
Spain 2.5 % 3.5 % 5.3 %
2.5 Residual load calculation
In this specific case, residual load is calculated by subtracting hourly values of wind, photovoltaic and run of the river generation from hourly demand data. These have to be must-run requirements. If residual load is then sorted in descending order, a load-duration curve is created.
0 1000 2000 3000 4000 5000 6000 Ja nua ry M ar ch M ay July Se pt em be r N ove mb er G W h Modeled Data Measured Data (ENTSO-e) Measured Data (P. F. Bach)
100% Renewable electricity supply for Portugal and Spain
Mariana Raposo Fernandes 19
After obtaining the RENPASS results, the 8760 values (24 x 365), for wind and solar, in Portugal and Spain, columns of normalized values are built. Afterwards, these columns multiplied by any value for solar and wind installation would create another column for electricity production.
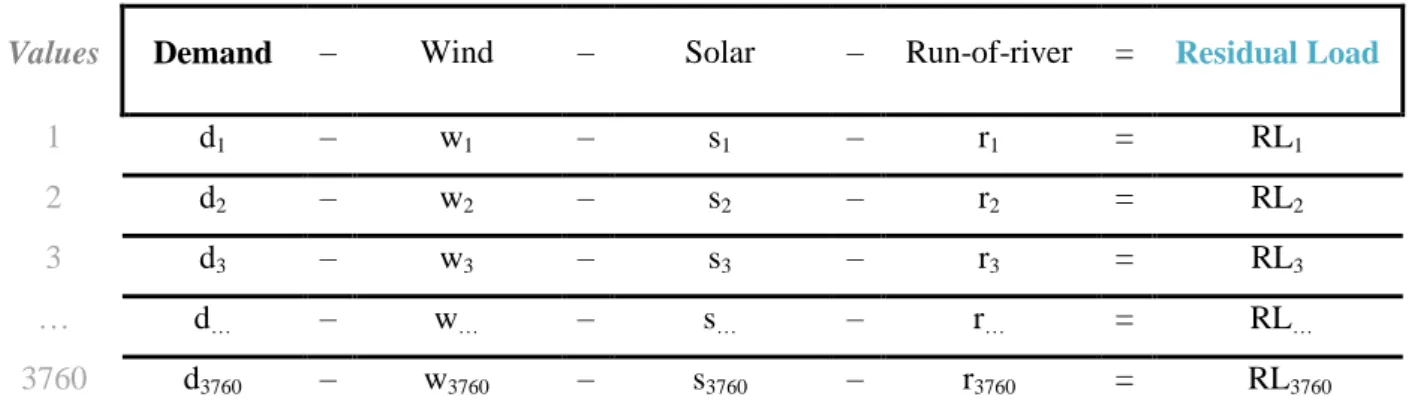
Table 2.5 schematically describes how the calculation of this factor is done. Table 2.5 - Residual load calculation scheme
Values Demand – Wind – Solar – Run-of-river = Residual Load
1 d1 – w1 – s1 – r1 = RL1
2 d2 – w2 – s2 – r2 = RL2
3 d3 – w3 – s3 – r3 = RL3
… d… – w… – s… – r… = RL…
3760 d3760 – w3760 – s3760 – r3760 = RL3760
The three columns in the middle (demand, wind, solar) have calculated values, which can change if the factors mentioned above are changed. These columns calculations are:
Eq. 1
[ ] [ ] Eq. 2
[ ] [ ] Eq. 3
Eq. 4
Eq. 5
A null residual load represents the ideal overall scenario, since it means that all the demand would be satisfied by the production that comes from solar, wind and run-of-river energy. This is, for an hourly or daily basis, unreal. The instantaneous residual load for electricity varies continuously, and supply must exactly meet demand at all times in a power system in order to maintain the system’s stability, which means that generation should also ramps up and down continuously with demand. If ∑
, it means that the yearly electricity production coming from a given renewable energy source, in total, is higher that the electricity consumption.
The calculation of the residual load allows an analyzing procedure that can help us to be critical when evaluating a scenario. It shows if, with a specific scenario, a big need of storage would be required or if transmission of electricity from neighboring countries/grids should be considered.
100% Renewable electricity supply for Portugal and Spain
100% Renewable electricity supply for Portugal and Spain
Mariana Raposo Fernandes 21
3. S
CENARIOSD
EVELOPMENTThe scenarios development is a process that demands an analysis of several factors. The calculation of the residual load is the basis to evaluate the scenario creation. An excel sheet was created in order to have all the elements that influence the residual load characterization of a specific scenario. Everything that will be described was done for Portugal and Spain.
The demand data of 2012 and the solar and wind normalized values, obtained from the RENPASS model build fixed columns:
Figure 3.1 - Fixed values
The next step was to create cells that are changeable: the demand factor, the solar factor and the wind factor. These three values define how demand will increase/decrease and which installation of solar and wind will be in 2050:
Figure 3.2 - Changeable cells
Next, three other columns were created: demand of 2012 demand factor; solar normalized values solar installation and wind-normalized values wind installation (Table 2.5).
If we define the demand factor at 1, it means that the column regarding demand in 2050 will be equal to the column about demand in 2012:
Figure 3.3 - Changing electricity demand and wind and solar production
If we write, in the cell about the solar installation, the number 1000, it means that the column regarding solar production (2050) will be the column of the normalized values of solar x 1000; and exactly the same works for wind production.
After this procedure, the run-of-river production was also added, as shown on figure 3.3, with no calculations associated. These values were collected about the year 2013. As it was mentioned before, it was assumed that this production would be, in 2050, at least the same as in 2013.
Finally, the residual load could be calculated, by subtracting the solar, wind and run-of-river electricity production from the electricity demand. Several charts were created, in order to be possible to make a
100% Renewable electricity supply for Portugal and Spain
Mariana Raposo Fernandes 22
deep analyze. Based on this analyze, it is possible to be critical and to decide if the scenarios are viable.
3.1 Changing the Demand factor and the Generating capacity
Five charts were created to allow an analysis of the residual load. Some macros in excel were created in order to recalculate all the values after changing the factors. One shows the residual load in a hourly basis, with 3760 values; another shows a duration curve of the residual load – this one requires a descending reorder of the values of the residual load; another one shows a monthly residual load, in TWh, which is very useful as it is able to show that, in some months, production is not enough to meet the demand and some others have over-production. The other two charts are relative to a day/night analysis: one shows the total day/night residual load, and the other displays the day/night residual load, according to the four seasons.
3.2 Costs in 2050: Initial investment
Another very important factor that should be evaluated in this study is the installation cost. Therefore, a calculation regarding costs was done. This costs, calculated for solar and wind, include investment and fixed operation costs, which is a percentage of the investment. According to the Scenario a3, the fixed costs for 2050 are as follows (German Advisory Council on the Environment - SRU, 2011):
Table 3.1 - Costs for 2050 [c€/kWh]
Portugal Spain
Solar (PV) 5.83 5.83
Wind 6.74 6.33
Every time that one of the three “changeable cells” is changed, everything changes: the calculation of the residual load is automatically re-done and the charts associated to the residual load, just mentioned, take a new shape. Macros were created and used. As of course, different installations result in different costs, different analysis about the investment also has to be done.
The goal when trying several values for the generating capacity for solar and wind was to find a combination of these two sources that would generate a total residual load approximately equal to zero, when summing up the 3760 of residual load.
3.3 Full load hours
The capacity factor is a measure of how often an electric generator runs for a specific period of time. It is useful to compare how much electricity a generator actually produces with the maximum it could produce at a continuous full power operation during the same period. For instance, if a 5 MW generator produced 25000 MWh over a year, its capacity factor would be 0,57, because
.
The concept of full-load hours is an especially useful term for dispatchable generators, which can be switched on and off (Morris & Pehnt, 2013). There are 8760 in a normal year, and the number of full-load hours can be used as an indication of how many hours a particular generator needs to run each
100% Renewable electricity supply for Portugal and Spain
Mariana Raposo Fernandes 23
year to be profitable. For example, if a power plant needs 4000 full-load hours of operation to be profitable, that is equivalent to a capacity factor of
. [ ] [ ] [ ] Eq. 6 [ ] [ ] [ ] Eq. 7
This calculation depends on two factors that are deeply connected: if the generating capacity increases, the yearly production increases. The full-load hours is a fixed value.
Table 3.2 states how many hours would be needed to produce the year production, if the generators work all the time in their maximum power capacity.
Table 3.2 - Full load hours [h]
Portugal Spain
Solar (PV) 1,624 1,755
Wind 2,266 2,221
3.4 Status Quo of Portugal and Spain
The Status Quo of a country is the actual situation related to the subject in study. This analysis is helpful to compare the current situation of Portugal and Spain with the scenarios for 2050 that were created and that will be shown in the next chapter. In this case, it was assumed that the Status Quo is related not to the last year but to the year 2012. The reason for this choice is that, as stated before, the RENPASS results were related to the year 2012 due to the data for this year be better updated and more reliable than the one for the year 2013, which is still not very clear for being so recent. Towards a coherent study, the study is all done based on the year 2012.
The residual load analysis was done with different perspectives. For that, there was the need to make some definitions.
For calculation purposes, and with a deviation of around 10 days, it was practical to assume that:
Winter January February March
Spring April May June
Summer July August September
Autumn October November December
and also:
Day period 8h – 20h
100% Renewable electricity supply for Portugal and Spain
Mariana Raposo Fernandes 24
The values for both countries in 2012 about solar and wind installations are described in table 3.3:
Table 3.3 - Iberian Peninsula - Generating capacities, 2012, [MW]
Portugal Spain
Solar (PV) 220 6,444
Wind 4,194 22,534
There was no information available regarding the run-of-river generating capacity, neither for Portugal nor Spain, but only the production in 2013.
After studying the Status Quo of both countries, it is easier to analyze the residual load characterization, in order to be realistic and to make comparisons.
Portugal in 2012
The next charts show different points of view regarding the residual load of the country, and are supposed to give some sensitivity so that a critical analysis can be done about the several scenarios. On one hand, a positive residual load means that the renewable sources production is not meeting the electricity demand. On the other hand, a negative residual load means that electricity demand is being satisfied by the renewables production.
Figure 3.4 – Yearly residual load, Portugal 2012
The maximum hourly value of the yearly residual load is around 7 TWh, and it occurred during winter. There is already a period of time when the residual load is negative, which means that the electricity production coming from renewable energies is temporarily higher than the electricity demand. This happened during the springtime due to the high rate of precipitation. As might be expected, the rest of the time is characterized by a general positive residual load, which means that there is still a great amount of electricity that is not satisfied by renewable sources.