DISCLOSURES AND DISCLAIMER AT THE END OF THE DOCUMENT PAGE 1/34 SEE MORE INFORMATION AT WWW.FE.UNL.PT
EQUITY RESEARCH
MASTERS IN FINANCE
EDP is an internationally diversified electric integrated company, with high growth potential in renewable energies. EDP Renováveis’ target of 10.5 GW of installed capacity in 2012 is explanatory of EDP’s degree of commitment in pursuing wind development.
EDP is a defensive pick,its highly regulated nature, with more than 85% of its EBITDA coming from regulated business with little or no exposure to economic activity, speaks for itself.
EDP’s regulatory agenda in 2010 will be busy, with new regulatory periods starting in Brazil for distribution and in Spain for electrical and gas distribution and finally in Portugal for gas.
Until 2012 EDP will focus on execution, afterwards focus will shift to cash flow generation. The company’s current high leverage is justified by an extremely large investment plan, which requires an average annual capex of 3 billion Euros. We view this plan as short-term burden, but as an extremely important source of future value, by 2012 the company’s indebtedness ratios will be less significant, and extremely large growth opportunities will have been created, anmely in renewable energies.
All in all, we feel confident that EDP will successfully develop the current investment opportunities, and control its debt level by 2012. The challenges ahead are significant, but EDP’s strong track record in delivering top performance, makes us confident, that in the end, the company will succeed. A forecasted CAGR EBITDA growth of 11% from 2007 until 2012, together with a strong dividend policy of increasing dividends 1.5 cents/year until 2012, makes EDP extremely interesting investment choice. BUY
06
J
ANUARY2010
EDP
–
E
NERGIAS DE
P
ORTUGAL
C
OMPANY
R
EPORT
E
LECTRIC
U
TILITIES
A
NALYST
:
A
NDRÉ
G
OMES
[email protected]
Steaming Ahead
The winds of change
Recommendation: BUY
Vs Previous Recommendation BUY
Price Target FY10: 3.68 €
Vs Previous Price Target 3.64 €
Price (as of 6-Jan-10) 3.12 €
Reuters: EDP.LS, Bloomberg: EDP PL
Potential Upside 18%
52-week range (€) 3.22-2.34 Market Cap (€m) 11,316.980 Outstanding Shares (m) 3.656 Source: Bloomberg
Source: Euronext
(Values in € millions) 2008 2009E 2010E Gross Margin 4897 5023 5447 EBITDA 3155 3290 3659 Net Profit 1092 1069 1166
EPS 0.30 0.29 0.32
Multiples and Ratios
P/E 16.2 12.9 11.6
Dividend Yield 4.7% 3.7% 4.2%
DPS 0.13 0.14 0.155
Capex/D&A 303% 300% 222% Source: EDP Data & Research Estimates
-60% -40% -20% 0% 20% N o v -0 7 D e z-0 7 Ja n -0 8 F e v -0 8 M a r-0 8 A b r-0 8 M a i-0 8 Ju n -0 8 Ju l-0 8 A g o -0 8 S e t-0 8 O u t-0 8 N o v -0 8 D e z-0 8 Ja n -0 9 F e v -0 9 M a r-0 9 A b r-0 9 M a i-0 9 Ju n -0 9 Ju l-0 9 A g o -0 9 S e t-0 9 O u t-0 9 N o v -0 9 D e z-0 9 PSI 20 EDP Company Description
EDP–ENERGIAS DE PORTUGAL COMPANY REPORT
EQUITY RESEARCH 06JANUARY 2010
PAGE 2/34
Table of Contents
ENERGY OUTLOOK ... 3
NATURAL GAS ... 3
COAL ... 4
ELECTRICITY GENERATION ... 4
ANALYSIS ... 5
EDP – ENERGIAS DE PORTUGAL GROUP ... 7
COMPANY OVERVIEW ... 7
Analysis ... 7
SHAREHOLDER STRUCTURE ... 8
EDP – BUSINESS AREAS ... 9
LONG -TERM CONTRACTED GENERATION IN IBERIA ... 9
Analysis ... 11
LIBERALIZED GENERATION AND SUPPLY ... 11
Analysis ... 13
REGULATED NETWORKS IN IBERIA ... 14
Analysis ... 15
ENERGIAS DO BRASIL ... 17
Analysis ... 18
EDPRENOVÁVEIS ... 19
Analysis ... 20
VALUATION ...21
METHODOLOGY... 21
Gross Margins ... 21
Operational Costs ... 21
Depreciation ... 21
WACC ... 22
Capex ... 23
Aditional Assumptions ... 24
SUM OF THE PARTS ... 26
SENSITIVITY ANALYSIS ... 27
COMPARABLES ... 29
FINANCIALS ...30
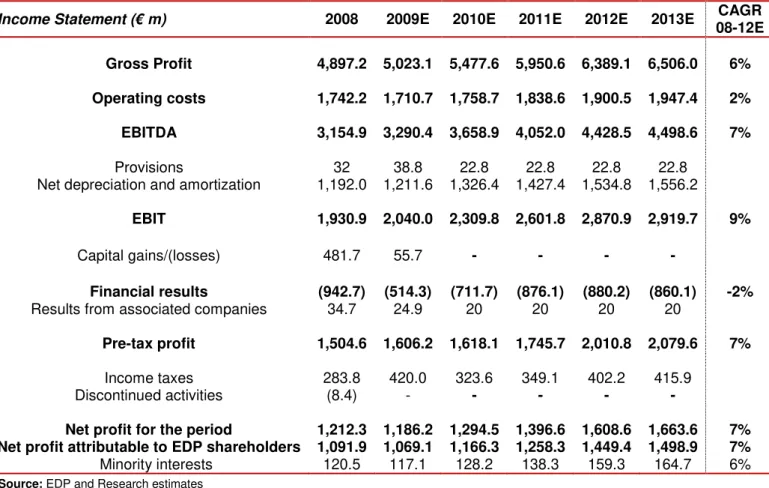
INCOME STATEMENT ... 30
BALANCE SHEET AND CASH FLOW STATEMENT ... 31
ANALYSIS ... 32
APPENDIX ...33
EDP–ENERGIAS DE PORTUGAL EQUITY RESEARCH
Graph 2 – Average Brent monthly prices
Energ
Different e the U.S. E increase b energy de increase b responsib will be res The world slowed do energy. B constantly 2008, with Shortly aft crisis bega just for oil due to a s economic the previo dramatica forecasts remain un awarenes summit se emission r setback, w control on Natural ga to increas 2030. Wi reboundin level, as th from the c continuing end of the gas is a ke
Not so green after all...
Mostly used in Electricity generation
Source: EIA, World Energy Data
COMPANY
06JANUA
Source: Direcção G
Graph 3 – Gas Cons
ergy Outlook
t energy market reports from both the International . Energy Information Administration forecast the wo e by more than 40 percent until 2030. The bulk of th demand from developing nations, where energy co e by more than 70 percent from 2006 levels, with In sible for the most significant part of the increase. De responsible for a much smaller part of the increase.
rldwide economic crisis has down the world demand for . Before the crisis energy prices
tly increased between 2003 and ith oil peaking at 147$/bbl. after energy markets peaked, the egan and prices plummeted, not oil but for natural gas and coal too,
a significant decrease in demand. Nonetheless, in th ic recovery already underway in many countries th vious trends. As depicted in Graph 1 energy deman ically from all sources. However, it is important to po
ts are based on the assumption energy and environ unchanged. Nevertheless, this might not be the cas ess towards environmental problems is increasing a
seen with high hopes by many was a failure. No bin n reductions were set, and there’s still a long way to , we view the Copenhagen summit as the first step on emissions.
Natural Gas
l gas consumption is expected ase by nearly 50 percent until With world oil prices
ding from their early 2009 s the world economy recovers e current crisis, and then
ing to grow throughout the the forecasting period. Natural
key source of energy both in
Source: EIA, Wo
Graph 1 – World
0 500 1.000 1.500 2.000 2.500 3.000 3.500 4.000 4.500 5.000 N o v Ja n M a r 1 0 ^ 6 N m ^ 3
NY REPORT
UARY 2010
PAGE 3/34 Geral Geologia e Energia
nsumption Portugal (2008-2009) al Energy Agency and world energy demand to f this growth is driven by consumption may
India and China being Developed economies
e.
n the long run with the the market will return to
and will increase
point out that the current ronmental policies will
ase, the global
g and the Copenhagen binding targets on y to go. Despite this ep towards a stricter
orld Energy Projections energy used by fuel Type
EDP–ENERGIAS DE PORTUGAL COMPANY REPORT
EQUITY RESEARCH 06JANUARY 2010
PAGE 4/34
Most electrical energy is generated from coal
Source: EIA, World Energy Projections
Graph 4 – Electricity Generation
by Sources
the industrial sector and for electricity generation1. Internationally, the industrial sector is currently the largest consumer of natural gas closely followed by electricity generation. Nevertheless, in Portugal natural gas is mainly used for electricity generation and will continue as such in the future as the four combined cycle plants licensed in 2006 become operational. In fact, one of the plants (Lares awarded to EDP) has already started commercial operation. Regarding the other three awarded to Galp Energia, Tejo Energia and Iberdrola, are still delayed and there are doubts if all of them will ever be built. However, one thing is sure Portugal’s main use of natural gas in the future will be energy generation.
Coal
If current policies regarding climate change are left unchanged EIA projects the world coal production to increase from 127 quadrillion Btu in 2006 to 190 quadrillion Btu in 2030. This increase in coal usage in mainly driven by increase demand from Asia, namely China and India. In China for example, installed coal-fired electrical generation capacity is forecasted to nearly triple by 2030. In Portugal there are only two coal-fired plants operating – Sines with a PPA signed until 2017 and Pego Plant. Sines represents the backbone of the country’s generation capacity and there are currently no plans to decomission it, nor to install new coal-fired plants. Finally, coal is the most abundant fossil fuel, at the current consumption level known reserves will last 150 years or more2.
Electricity Generation
According to EIA, Global electricity generation is forecasted to increase by more than 70 percent from 18 trillion KWh in 2006 to 23.2Kwh in 2015 and 31.8 KWh in 2030, see graph 4. The current crisis has mitigated the short term trend, but in the future it is clear electricity demand will remain strong. The rapid increase in world energy prices from 2003 onwards combined with an increasing environmental awareness has lead to a renewed interest in the development of renewable energy sources. As economies recover, oil coal and gas are expected to return to previous higher prices, this fact together with stronger governmental policies regarding alternative energies will lead to a period of rapid expansion of renewable energy installed capacity worldwide.
As expected word carbon dioxide emissions are projected to continue rising as economic activity returns to pre-crisis levels. In fact, the majority of the increase in emissions of green house gases will come from developing countries. OECD points out on the 2009 Energy Outlook that if Governments don’t deal with this problem global temperatures could rise 6 degrees celsius by 2030, with
1
EIA – World Energy Outlook 2009
EDP–ENERGIAS DE PORTUGAL COMPANY REPORT
EQUITY RESEARCH 06JANUARY 2010
PAGE 5/34
The future will bring expensive energy...
Significant untapped potential in Hydro...
devastating consequences for the planet. According to this study, the world needs to find ways to limit this increase to 2ºC. However, even this target will take an enormous global coordinated effort to achieve. The ways in which the world now produces energy will need to be radically changed, renewable energy sources (solar, wind, hydro) will play an important role, however this step alone won’t be enough to solve the problems the world is faced with. Part of the necessary reduction in emissions will come from the phasing out of old and inefficient coal and oil fired plants, carbon capture technologies, nuclear energy and high efficiency combine cycle generation.
Analysis
Currently global energy prices are down over what they were just a year ago. Despite this significant decrease we believe this is just a short-term trend and as economic activity picks up, energy prices will follow. Furthermore, we remain cautious about the pace of the expected increase in global energy prices. The economic and financial crisis has caused many investments in the energy field to be postponed. Due to financing difficulties or just caution, many companies worldwide decided to cut back on their investment plans in the short-medium term a 19% reduction versus.2008, according to the IEA. As a result, when economies worldwide start to accelerate their recovery and consequently increase their demand for energy, specially, gas, oil and coal, we feel there is a possibility of fossil fuels and electricity prices spiking due to the supply side not being able to match the demand increase.
EDP has dealt with the economic downturn extremely well due to its highly
regulated nature (>85% EBITDA regulated) and effective risk management. EDP’s ambitious capex plan continued despite difficulties in the financial sector, EDP’s strategy of financing ahead of the needs clearly paid off, as when financial markets froze the company had already
ensured it had the financing it needed to proceed with its investment plan. EDP is currently investing a lot in hydro (1.5 GW), CCGTs (Combined Cycle Gas Turbine) and wind. We feel these choices are strategically wise.
In Portugal the current hydro developed capacity is bellow the European
average, see graph 5. Hydro plant’s marginal production cost is null, therefore hydro plants generate the highest margins, and in context of rising electricity prices and environmental concerns, this kind of asset is critically important. Unfortunately, hydro plants are not enough to generate all the electricity needed,
Graph 5 – Hydro Capacity Used vs. Potential
EDP–ENERGIAS DE PORTUGAL EQUITY RESEARCH
Graph 7 – Coal CIF futures
Source: Bloomberg
and some weather. Given this company’ EDP to in Portugal a EDP’s cu generates Sines gen CO2 per G group’s S CO2 per G typically g GWh. Cur neverthele further im strict than tendency future. Th it clear tha CCGTs w on CCGT efficiency competitiv moment. Regarding wholesale the OMEL underlying prevents t being perf that is the capacity b congestio effectively Portugues reduced to interconne increase t generation COMPANY
06JANUA
Source: OMEL
metimes cannot operate when needed, as its opera
his limitation, other sources of energy production ar ny’s generation portfolio. This leads us to another st
invest in CCGT plants both in al and in Spain.
current portfolio of coal fired plants tes high levels of CO2 emissions,
enerates approximately 0.9 ton of r GWh of energy produced and the
Spanish coal plants, 1.18 tons of r GWh, whereas CCGT plants y generate 0.35 ton of CO2 per
urrently, CO2 emission rights prices are low compa eless with current level of environmental concerns improvements to current rights trading scheme will an it currently is. Nonetheless with the current sche cy on graph 6, clearly depicts a trend of rising CO2 The abysmal difference in emissions from the two ty than in a future where emission rights will be much
will progressively substitute coal for baseload, ther T is in our view correct. The lower initial investmen cy achieved in a combined generation cycle, enable titive versus other non peak load generation alterna
ing the Iberian
ale spot energy market EL there is an
ing problem that ts this market from
erfectly competitive, the interconnection
y between the two country’s electrical networks, as tion in the interconnection between Portugal and Sp ely splits into two, with different prices zones. On av uese area has been higher, nevertheless this year th d to 60 cents versus 4.8 Euros of last year. We belie nnection capacity between the two countries in the c e the market competitiveness and reduce EDP’s ma tion.
Graph 8 – MIBEL historical
Graph 6 – C
Source: Eu
NY REPORT
UARY 2010
PAGE 6/34 ration relies heavily on the
are needed in a
r strategic choice made by
pared to last year, s it is inevitable that ill emerge, making it more heme, the upward sloping emission prices for the o types of facilities makes ch more expensive,
erefore EDP strategic bet ent costs, and higher bles these plants be very natives at the present
as a result when there is Spain the market average the price on the r the difference has been elieve the increase in the
e coming years will margin on its liberalized
al average daily prices CO2 emission rights futures
EDP–ENERGIAS DE PORTUGAL COMPANY REPORT
EQUITY RESEARCH 06JANUARY 2010
PAGE 7/34
Internationally diversified integrated electric company
40% 32%
19% 12%
10%
14% 42%
39%
28% 6%
19%
39%
0% 20% 40% 60% 80% 100% 120%
2005 2007 2012E
Coal + Fuel CCGT Hydro Wind
EDP – Energias de Portugal Group
EDP Energias de Portugal is a Portuguese listed company on the Lisbon stock exchange. The Group is composed of a large number of companies engaging in activities that range from production, distribution and supply of electricity in Iberia and Brazil. Gas distribution and supply in Iberia, renewable energies and a small number of companies the group owns that offer a whole range of services and products, from consulting, engineering and R&D.
Company Overview
EDP’s major holdings are EDP Production which is involved in electrical energy production, EDP Distribution which is the concession holder of the Portuguese electrical distribution grid, this concession no longer includes the electrical transportation grid that has been spun off into REN as part of the liberalization process of the Portuguese energy market. The Group’s Spanish operations are composed of Hidroeléctrica del Cantábrico (HC Energia) which was acquired in 2004 and is in charge of electrical distribution, generation and supply of
electricity. The gas business in Spain is undertaken by Naturgas whose operations have now been recently reinforced through the acquisition of Gas Natural’s assets. This operation has now received the necessary regulatory approval and its completion occurred on the 31st of December 2009. The company has announced a reference enterprise value of 330 million Euros for this acquisition. Energias do Brasil is EDP’s subsidiary in Brazil, it is mainly engaged in energy distribution and generation. Finally, EDP is also deeply committed in creating one of the strongest renewable energy players in the world. Currently, EDPR is the fourth largest wind player by installed capacity and is the main investment focus of the Group with a target of 10.5 GW of installed capacity for 2012. Additionally, in 2012 EDP will be a much greener company, not just because of EDPR, but also due to extensive investments in hydro capacity (new plants and repowerings) both in Portugal and Brazil. Finally, new CCGT plants will also contribute to this objective, as these plants are much more efficient and cleaner than EDP’s existing coal-fired plants.
All in all, EDP is one of the largest utilities in Iberia with an installed capacity of over 19GW. Its main competitors are Spanish integrated utilities like Endesa, Iberdrola and Unión Fenosa/Gas Natural.
Analysis
EDP is now amidst the implementation of the 2009-2012 business plan. This plan focuses on a timely execution of the investment opportunities created in previous business plan (2006-2008). Adding to the focus on execution, there’s also a 68%
Graph 9 – Installed Capacity
Source : EDP
EDP–ENERGIAS DE PORTUGAL EQUITY RESEARCH
focus on c reduce ED the 2007 c Resource By 2012 E company to 24 GW will accou whereas t like fuel an the installe emissions decline.
EDP’s cap a nominal capital is d A shares o sharehold Class B sh investors total votin Portugues from the c limitation r limitation o State to e directly (P 25% of the and dual c standpoin company
Focus on cash-flow generation after 2012...
Graph 11 – Shareholder Structure
Source: EDP
COMPANY
06JANUA
n cost efficiency, the Opex 2012 program. The Ope EDP’s operating costs by 160 million Euros until 20 7 cost base. The most relevant aspects of this prog ces restructuring in Brazil, outsourcing and IT optim 2 EDP will be a very different
ny, its installed capacity will be close W, and renewable energy sources ount for 66% of installed capacity, s the more polluting technologies l and coal will only represent 19% of alled capacity. Naturally, EDP’s CO2
s per MWh of energy produced will
Shareholder Structure
capital is divided into 3.656.537.715 shares, with nal value of one euro each. Furthermore, the
is divided in two share classes, A and B. Class s or ordinary shares, represent 80.3% of the older structure with the remainder 19.7% being
shares. Class A shares are held by private rs and are limited to a maximum of 5% of the ting rights, whereas Class B shares, held by the
ese Government, are not. These shares result e company’s privatization process and have no n regarding voting rights. The aforementioned n on the voting rights enables the Portuguese exert significant control over the company, as it (Parpública) and indirectly (Caixa Geral de Depósit the company’s stock. We believe this strong influen al class shareholding structure are negative from a p oint, limiting the possibilities of any investor acquirin ny or having significant control over the company.
Graph 1
Source
NY REPORT
UARY 2010
PAGE 8/34 pex program aims to 2012, as compared to rogram are the Human
timization.
sitos) owns more than ence of the Government a potential investor iring a major stake in the
PARPÚBLICA 20.69%
IBERDROLA 5.00%
CAIXA G. DE DEP. 5.00%
CAJA ASTURIAS 5.00%
JOSÉ DE MELLO 4.87%
BLACKROCK 3.86%
BCP 3.43%
PICTEC 2.88%
SONATRACH 2.26%
BES 2.35%
IPIC 2%
T. Stock 0%
Table 1 – Voting rights
Source: EDP and Research Estimates
h 10 – CO2 emission per MWh
EDP–ENERGIAS DE PORTUGAL COMPANY REPORT
EQUITY RESEARCH 06JANUARY 2010
PAGE 9/34
Source: EDP
EDP – Business Areas
Long-Term Contracted Generation in Iberia
EDP is the Portuguese electric incumbent and for many years was the only company producing and supplying electricity in Portugal. Much of the electricity generated by the Group was produced under power purchase agreement (PPA) schemes, these contracts were used as a way of ensuring EDP would face minimal risk on its investments, therefore creating a strong incentive for the company to develop the Portuguese electric generation capacity. The
liberalization process of the electricity markets started in 2004 and in 2007 the Iberian electrical market (MIBEL) initiated its operations. The existing PPA contracts were contrary in their nature to the ideal of an open and competitive market, therefore they had to be replaced by another type contracts, the
contracts for maintenance of contractual equilibrium (CMEC). The creation of the CMEC had been proposed as early as 2004, but only went ahead in 2007 when the MIBEL started its operations. The main objective of the CMEC is to preserve the net present value of the existent PPAs.
The PPA contracts were remunerated according to a capacity charge plus an energy charge, minus actual fuel cost incurred. The capacity charge is calculated according to an 8.5% return on assets (ROA) plus annual depreciation and contracted operation and maintenance costs, with values updated to inflation. Additionally, the capacity charge is adjusted by deviations on contracted capacity availability. The energy charge minus fuel costs reflects the pass through of fuel costs that are paid according to international fuel indexes. Finally, other
investments during the life of the PPA are also remunerated at 8.5% real pre-tax and fully depreciated until 2017.
The CMEC value is nothing more than the difference between annual
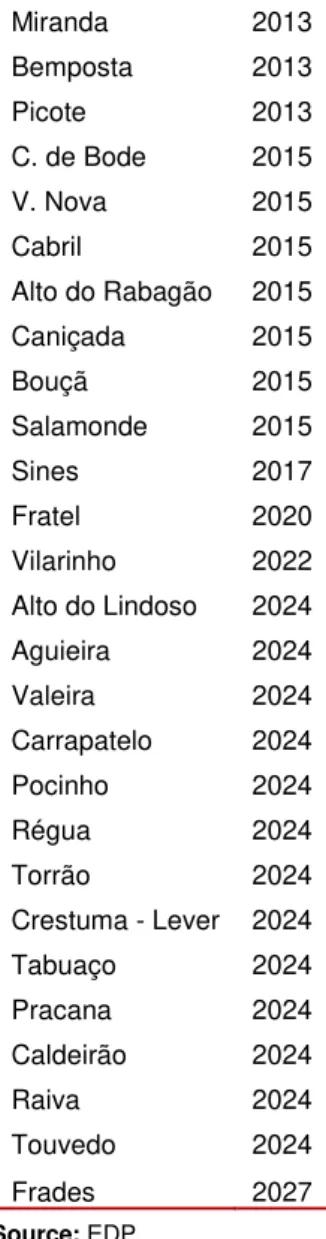
remuneration under PPA and market conditions revenues. If that value is positive EDP is entitled to receive compensation, otherwise it must return the excess revenues earned. In essence, the CMEC contracts ensure EDP a stable gross margin, because allowed revenues replicate those of the PPA and fuel costs are pass through, there is no volume, price or margin risk. There is however
operational risk, the capacity charge is adjusted based on the realized capacity availability versus contracted availability and therefore if any of the plants on table 2 is unavailable for any reason, this will results in a adjustment to the gross margin, as it happened this year with several EDP plants undergoing
maintenance work.
Miranda 2013
Bemposta 2013
Picote 2013
C. de Bode 2015
V. Nova 2015
Cabril 2015
Alto do Rabagão 2015
Caniçada 2015
Bouçã 2015
Salamonde 2015
Sines 2017
Fratel 2020
Vilarinho 2022
Alto do Lindoso 2024
Aguieira 2024
Valeira 2024
Carrapatelo 2024
Pocinho 2024
Régua 2024
Torrão 2024
Crestuma - Lever 2024
Tabuaço 2024
Pracana 2024
Caldeirão 2024
Raiva 2024
Touvedo 2024
Frades 2027
Table 2 – PPA Maturities
EDP–ENERGIAS DE PORTUGAL COMPANY REPORT
EQUITY RESEARCH 06JANUARY 2010
PAGE 10/34 Assuming a situation where no abnormal event occurs regarding EDP’s plants covered by the PPA/CMEC, gross margins on the plants that were operating under PPA, are shown in graph 12.
Included in this business area is also the special regime production (PRE), both in Portugal and Spain. This area includes Mini-Hydro, Cogeneration and Biomass generation. In just three years the installed capacity nearly doubled, as shown by graph 13, this growth is very significant and has been mostly driven by the acquisition of Pebble Hydro in July 2008, which increased EDP’s Mini-Hydro installed capacity by 89MW. Special regime production has no volume risk, as it is mandatorily acquired by the last resort supplier (EDP S.U.). The price EDP receives for electricity produced by a licensed PRE facility depends on its own individual characteristics but once it is set, it mainly depends on inflation and the period of the day during which electricity is produced. The main sources of risk relate to environmental and economic conditions. Periods of drought will obviously impact hydro based electricity generation potential. Lower levels of economic activity impact special regime generation twofold. Regarding,
cogeneration less economic activity implies a lower need for steam or heat also produced by cogeneration plants and sold to clients. Concerning biomass based generation, lower levels of economic activity imply that less biomass residues would be produced and consequently be available to be used in electricity generation. Finally, regulatory risk is also relevant risk as there is no guarantee that the current regime will continue in the future. Nevertheless, special regime production provides a stable source of cash-flows, with limited risk levels associated.
Graph 12– PPA contracted Gross Margin
Source: EDP
M
il
li
o
n
Eu
ro
s
Source: EDP and Research Estimates
Graph 13 – Special regime production
EDP–ENERGIAS DE PORTUGAL COMPANY REPORT
EQUITY RESEARCH 06JANUARY 2010
PAGE 11/34
Source: EDP
Graph 14: EBITDA by business area as percentage of total
LT Contracted
Generation represents approximately 25% of the EBITDA
Analysis
This business area is currently extremely important for EDP, as it constitutes a stable and significant source of cash-flows, and it does not have any major risk associated with it. On the down side, as the gross margin is in fact already known in advance, there is no upside if electricity prices rise.
Nevertheless, the margin that EDP is earning on the electricity produced in this area is far greater than it would under normal market conditions. Considering this year that pool prices have been much lower than expected, EDP’s PPA/CMEC contracts have been shielding the company from the decrease in volumes sold and prices. Furthermore, EDP has been managing this business area extremely well, ensuring availability factors on average above those required in the contracts. The regulatory framework has also been explored to the maximum, with EDP taking advantage of the possibility of investing in the facilities covered by the PPA/CMEC. These investments will mandatorily be fully depreciated until 2017 and remunerated at 8.5% ROA. Thus, investment in the assets covered by the PPA/CMEC, creates future revenues, by increasing the ROA and annual depreciation. In fact, new investments work as a way of partially cancelling out the inevitable trend of revenue decline associated with this area. Furthermore, the 8.5% ROA is much higher than the cost of capital we have estimated - 4,57% (see WACC section of the report for further details). As a result, EDP has a strong incentive to invest as much as possible in this business area.
Nevertheless, such investments are subject to the regulator’s approval. This is one of the reasons why EDP invested twelve million Euros in De-NOx equipment for the Sines plant, whose PPA will expire in 2017.
Liberalized Generation and Supply
EDP–ENERGIAS DE PORTUGAL COMPANY REPORT
EQUITY RESEARCH 06JANUARY 2010
PAGE 12/34
Source: EDP and Research Estimates
Graph 15 – Total installed merchant capacity
Hydros with pumping and wind energy are excellent complements...
efficient power plants will be penalized specially in terms of CO2 emission costs and overall efficiency. It is important to bear in mind that the majority of EDP’s electrical production in Spain until the entry into service of EDP’s Spanish CCGTs was based on coal-fired plants.
EDP is also preparing its future
as much more liberalized player in the Iberian electricity market, in March 2008 EDP signed an agreement with the Portuguese State that enables EDP to
continue exploring EDP’s hydro plants that operate under the PPA/CMEC regime, for an additional 26 years on average after the expiration of the CMEC.
Despite ensuring its existent hydro capacity will remain under the company’s control well after the expiration of
the PPA/CMEC, EDP is still heavily investing in new hydro capacity, taking advantage of the country’s still untapped potential for hydro production. As mentioned in the analysis of the Energy Outlook section of this report, Portugal has one of the lowest rates of hydro capacity used as compared to potential capacity in Europe. This
fact, combined with environmental concerns and solid economic reasoning provide a strong incentive for the company to invest in new hydro plants. Additionally, the Portuguese national hydro plan which aims to promote the construction of 10 new hydro plants with a total capacity of over one gigawatt is yet another opportunity that EDP pursued, and as a result, was awarded two additional hydro plants, Fridão and Alvito. These two plants which were not originally part of EDP’s hydro development plans in Portugal will start operating in 2016.
EDP’s liberalized supply operations include both electricity and gas supply in Portugal and Spain. EDP’s liberalized gas supply operations in Portugal are very recent and have only begun this year, and therefore it is unclear what the trend regarding this market segment will be. Nevertheless the liberalization process of this market is underway and in 2010 the market will be fully liberalized. The liberalized gas supply in Spain is a much more consolidated business, which has
Source: Research Estimates
Graph 17 – Gas supplied in Spain
Graph 16 – Hydro installed capacity in Portugal
EDP–ENERGIAS DE PORTUGAL EQUITY RESEARCH
The coexistence of regulated and liberalized markets favours the existence of opportunist behaviour... been reinf EDP’s gas kilometers occurred o Spanish r Spanish g these ass Furthermo the low pe acquired.
A
EDP also to liberaliz in Portuga Portugues market is happens d interaction regulated supply ac in Portuga electricity liberalized on the pric annually. is higher o market, th move to th shield the increase i happens w inverted. A on regulat one year a market dy ERSE had electricity electricity they turne the libera COMPANY06JANUA
Source: OMEL and EDP
inforced through the acquisition of ex-Gas Natural a gas company in Spain entered into an agreement to
ers of pipelines and 240 thousand supply points. Th d on the last December 31st after EDP receiving the h regulators. We have included this deal in the valua h gas assets, since it was announced in mid 2009. E ssets are expected to generate an EBITDA of 35 m more, we believe EDP’s growth expectations for thi penetration rate of gas distribution in the areas wer d.
Analysis
so supplies electricity alized clients
gal. However the uese electricity supply
is challenging, this s due to the complex tion between the ed and liberalized
activities that co-exist gal. In practice, the ity demand on the
ed market depends price set by ERSE
. If the electricity price r on the liberalized , then consumers will o the regulated market to
hemselves from the e in prices, the opposite
s when the situation is d. As there is no visibility
lated prices more than
ar ahead, it can be challenging to forecast the regul dynamics. In 2008, electricity pool prices were muc had included in the regulated tariffs, as a result, con ity consumption to the regulated market. However, ity that ERSE included in the regulated tariffs were rned out to be in reality, thus we see a strong shift in
ralized market this year (Graph 19). On the last 15t
Graph 19 – Liberalized vs. Reg
Source: ERSE
Graph 18 – Liberalized Market
NY REPORT
UARY 2010
PAGE 13/34 al assets. Naturgas,
to acquire 2860
he settlement of the deal the approval of the
luation of the EDP’s . EDP has indicated million Euros in 2010. this area possible due to
ere the assets have been
EDP–ENERGIAS DE PORTUGAL COMPANY REPORT
EQUITY RESEARCH 06JANUARY 2010
PAGE 14/34 25
29 33 37 41 45
E
u
ro
s/
M
W
h
made public the regulated energy tariffs for Portugal in 2010, which include an average annual increase of 2.9% for the last resort client. For 2010 ERSE forecasted an average electricity pool purchase price of 50.8 €/MWh, which compares, to 2009’s forecast of 71€/MWh. The current OMIP’s (MIBEL’s Portuguese market operator) futures prices for next year are inferior to ERSE’s forecasts. Nevertheless, this new regulated price is in line with market
expectations for electricity prices, for next year. It is expected that the gap between spot pool prices and regulated prices tightens, as market conditions stabilize and economic recovery strengthens.
In our valuation we considered that the current trend of consumers moving to the liberalized market would continue even though at a slower pace. We remain confident that in the medium run the Portuguese market will be fully liberalized, as it happened this year in Spain. In fact, the excellent results EDP is achieving this year on its Spanish electricity supply operations result from forced liberalization of this market. This fact, enabled HC Energía to increase volumes sold, despite the overall contraction of the Spanish electricity market.
Regulated Networks in Iberia
This business area includes several companies both in Portugal and Spain. In Portugal it includes EDP Distribution and Portgás, both companies are infrastructure concessionaries. The first company operates the Portuguese National distribution grid and the latter is in charge of operation of the
low-pressure natural gas distribution network in the Porto area, in north of Portugal. In Spain, EDP operations in this business area are undertaken by its Spanish subsidiary HC Distribución that operates parts of Spanish electric distribution grid, and by Naturgás that also operates parts of the Spanish natural gas distribution and transportation grid. At this stage it is important to point out how differently the countries’ two energy networks are organized. In Portugal there is a single operator for the country’s energy transportation networks, REN that operates and manages all infrastructures. Whereas in Spain, despite the existence of a company with similar responsibilities, REE, there are still parts of the Spanish energy networks operated by electric integrated companies.
EDP’s strategy for this business area focuses on three main aspects: Improving service quality, namely through the reduction of the number and span of power outages; Investing in R&D, namely in the InovGrid program that aims to create an intelligent electricity distribution grid. Finally, investing on the expansion of both electrical and gas distribution networks. Until 2012 the company expects to invest
Graph 20 – Electricity Futures at MIBEL
EDP–ENERGIAS DE PORTUGAL COMPANY REPORT
EQUITY RESEARCH 06JANUARY 2010
PAGE 15/34
Stable regulatory outlook in Portugal (2009-2011)
2,98%
12,12%
14,85%
60,04% 8,02%1,99%
LT Contracted Generation Iberia Liberalised Activities Iberia Regulated Networks Iberia Wind Power
Brazil
Other
1.5 billion Euros on this business, we have included this data in the valuation model and considered an additional investment of 330 million Euros in the acquisition of the Spanish gas assets.
The bulk of this business area’s revenues come from Portuguese operations, namely EDP Distribution and EDP Universal Service (EDP S.U). The Portuguese Regulator ERSE defined the parameters for the 2009-2012 regulation period in December 2008. Electricity distribution assets were remunerated in 2009 based on an 8.55% nominal, pre-tax return on the regulated asset based (RAB), for the first year (2009). In fact, the 8.55% return on the asset base results from a fixed premium of 4% over a 10 year Portuguese Government bond yield, this latter parameter is updated annually during the life of the current regulatory period. For 2010, ERSE has already defined a rate of return on the RAB of 8.39% for both electrical distribution and last resort supply.
EDP Universal Service is EDP’s last resort supplier in the Portuguese electricity regulated market. Consequently, it is also entitled to a remuneration defined by ERSE. The main difference in its remuneration versus the previous regulatory period, is that now the working capital is remunerated at the same rate as the RAB, which our view is correct, given the fact the EDP S.U purchases electricity in the pool and immediately sells it to last resort consumers. Yet, it is only paid afterwards. The large sums of money consumed by this activity and its cost are now recognized by the regulator. ERSE has considered on the 2010’s tariffs a reduction of the number of days of working capital recognized, we have adjusted our model accordingly. In Spain, EDP is also involved in the operation of parts of the country’s electric distribution grid through its subsidiary HC Energía. The Spanish regulator the Comisíon Nacional de Energia (CNE) calculated this year’s allowed revenues according to a transitory model that adjust allowed revenues, according to quality of service activity and efficiency.
Analysis
This business area is very important for EDP as it approximately represents a quarter of EDP’s total EBITDA. Furthermore, due to its regulated nature it is less dependent on actual market conditions, making it more resilient to periods of economic turmoil like the current year. EDP’s Distribution allowed revenues formula, already includes about 50% of the total allowed revenues as a fixed charge, therefore the rest of the remuneration that is dependent on actual electricity distributed by tension level, will have a much smaller impact on overall allowed revenues. Despite this advantage, these businesses are also exposed to significant regulatory risk, in Portugal and Spain both for gas and electricity. Nevertheless, the length of the regulatory periods is sufficiently big so that EDP
Graph 21: Accumulated Capex 09-12
EDP–ENERGIAS DE PORTUGAL COMPANY REPORT
EQUITY RESEARCH 06JANUARY 2010
PAGE 16/34 Regulatory Period Next Regulatory Period Start
Electrical Distribution Portugal 3 Years Jan-2012
Gas Regulated Spain 4 Years Jan-2010
Electricity Distribution Spain 1 Year Jan-2010
Gas Distribution Portugal 3 Years Jul-2010
Table 3 – Regulatory Periods Length
Source: EDP
can develop and implement strategies, and the process by which regulation is carried out, ensures the companies no arbitrary and highly detrimental decision will be made.
Nevertheless, next year, three of the four regulated business areas will face the start of a new regulatory period, whose outcome is uncertain. Despite the three only accounting for a minor part of the revenues of this area, EDP will need to focus on dealing with the regulatory agenda as best as possible.
Additional issues related to this area, are the Portuguese and Spanish regulatory receivables. In 2008 the Portuguese tariff deficit supported by EDP S.U.
increased by 872 million Euros alone, reaching a value over 1 billion Euros. On the last 5th of March EDP securitized 1.2 billion Euros worth of the existent Portuguese deficit. This fact together with this year’s excess tariffs has now eliminated the deficit and turned it into a slightly positive tariff surplus.
In Spain the electric system’s debt with the electric companies is a much more serious problem. From 2006 until 2008 the system accumulated a debt of over 6 billion Euros. HC Distribucíon is currently supporting over 445 million Euros of the Spanish tariff deficit. Spain’s total tariff deficit is currently in excess of 14 billion Euros, leading some analysts to raise the question whether all the debt the system had accumulated will eventually be paid. To solve this situation and help electric companies solve liquidity management issues, the Spanish State approved last year the Real Decreto 6/2009 that creates a legal framework for the securitization of the Spanish tariff deficit. We believe this creates excellent perspectives for HC that will now be able to get cash infusions by securitizing the deficit it holds, just like EDP has done in the past in Portugal.
0 500 1000 1500 2000
2008 2009
Graph 22– Regulatory Receivables
EDP–ENERGIAS DE PORTUGAL COMPANY REPORT
EQUITY RESEARCH 06JANUARY 2010
PAGE 17/34
75% of Brazil’s Hydro capacity is sold under PPA
Source: Bloomberg
Graph 23 – EdB stock returns vs. Bovespa
-60% -40% -20% 0% 20% 40% Ja n -0 8 F e v -0 8 M a r-0 8 A b r-0 8 M a i-0 8 Ju n -0 8 Ju l-0 8 A g o -0 8 S e t-0 8 O u t-0 8 N o v -0 8 D e z-0 8 Ja n -0 9 F e v -0 9 M a r-0 9 A b r-0 9 M a i-0 9 Ju n -0 9 Ju l-0 9 A g o -0 9 S e t-0 9 O u t-0 9 N o v -0 9 D e z-0 9 Bovespa EDB
Energias do Brasil
Energias do Brasil (EdB) is a sub-holding of the EDP Group for its Brazilian operations. EdB is involved in electricity production, distribution and supply. Its operations are spread over the São Paulo, Espírito Santo, Tocatins, Ceará and Santa Catarina States. The company is quoted in São Paulo stock exchange (Bovespa) since 2005, and is currently owned 65 percent by EDP with the remainder 35 percent held in free float.
In September 2008 an asset swap deal with Rede Group occurred and as a result the distribution company Enersul was excluded from the consolidation perimeter, and the Lajeado hydro plant started to be fully consolidated (73% vs. 27.7% stake). This operation alone was responsible the increase of EdB’s installed capacity by 653MW in 2008. Currently the Pecém coal plant is being built in a partnership with
MPX Minerção e Energia and several small hydros are being repowered. The investment in the new coal plant is strategic, it is the first relevant non-hydro asset that EDP is building in Brazil, and allows for a more controlled energy production, and EdB’s partner is also involved in coal extraction, therefore it will be both a partner and a supplier, therefore minimizing the risks associated with this investment.
EdB is currently studying a large number of projects based on different
technologies. tte projects under study represent a possible increase in installed capacity of about 3.400 MW over the capacity EDP has already committed to develop.
The Brazilian power generation landscape is extremely regulated with the
majority of the country’s electricity being supplied under PPA contracts. In fact, all of Peixe Angical, Lajeado, Santa Fé and Mascarenhas’ hydro plants production is sold under PPA contracts that guarantee a volume and price updated to inflation during the programmed life of the contracts. The average maturity of EdB’s PPA contracts is approximately 10 years.
The Brazilian electricity distribution landscape is regulated and both
Bandeirante’s and Escelsa’s remuneration is defined by the Agência Nacional de Energia (ANEEL), the Brazilian energy market regulator. For Bandeirante the
Graph 25 – Projects under study
Source: EDP
Ticker: ENBR3 BZ
Graph 24 – Installed Capacity Brazil
EDP–ENERGIAS DE PORTUGAL COMPANY REPORT
EQUITY RESEARCH 06JANUARY 2010
PAGE 18/34
Source: EDP
Regulatory Period Bandeirante 4 Years
Escelsa 3 Years
Table 4 – Regulatory Periods Length
current regulatory period lasts until September 2011 and for Escelsa until July 2010.
The regulator defined a return on RAB of 15% after taxes for the current regulatory period. Despite the regulation period being well underway the two companies’ accepted cost base was still provisional, and was only defined last August and October for Escelsa and Bandeirante respectively. The impact of this revision was negative
Analysis
We find EDP’s presence in the Brazilian market to be strategic and coherent with the company’s strategy of choosing low-risk, stable returns. EdB is a highly
regulated company with less than 5 percent of its total EBITDA resultant from liberalized operations. All its current generation activity is under PPA agreements and the new Pecém coal power plant already has a signed PPA from 2012 onwards for 15
years, with a full pass through of fuel costs. According to the terms of the PPA, the plant will have a guaranteed gross margin of R$427.4 million per year at 2007 prices, updated annually to inflation.
According to EPE and EdB, Brazil’s electricity demand will grow annually at a pace of around 5%. This is consistent with a strong economic growth that is expected in Brazil for the next two years of approximately 5% according to OECD. This situation will put pressure on the Brazilian entities to license new investments in capacity, because at the current pace the Brazilian reserve margin will be negative by 2012-2013, given the current trend in demand increase fuelled by a strong GDP growth. For that reason we find EDP’s reasoning in striking the asset swap deal with Rede Group correct, investing in production with signed PPA is simultaneously economically very interesting and low-risk. The ongoing investment in new capacity and study and development of potential investment opportunities in generation is strategic as we believe EDP will be able to invest in project besides those it is already committed.
5% 5,20%
2007-2011 2012-2016
Growth in Electricity Demand
Graph 26 – Growth in Electricity Demand
EDP–ENERGIAS DE PORTUGAL COMPANY REPORT
EQUITY RESEARCH 06JANUARY 2010
PAGE 19/34 -60% -50% -40% -30% -20% -10% 0% 10% Ju n -0 8 Ju l-0 8 A g o -0 8 S e t-0 8 O u t-0 8 N o v -0 8 D e z-0 8 Ja n -0 9 F e v -0 9 M a r-0 9 A b r-0 9 M a i-0 9 Ju n -0 9 Ju l-0 9 A g o -0 9 S e t-0 9 O u t-0 9 N o v -0 9 D e z-0 9 EDPR PSI20
Graph 29 – Installed capacity 2009
0 2 4 6 8 10 12 9M09 Unver Constr. Under Develop. 2012E G ro ss G W 0 200 400 600 800 1000 1200 1400
1Q 2Q 3Q 4Q E
G ro ss M W
EDP Renováveis
EDP Renováveis (EDPR) is a public company listed on the Lisbon stock
exchange. The company was originally created in 2007 as a holding company for EDP’s participations in NEO Energia and Horizon Wind Energy, in May 2008 the company went public with 22.5 percent of its capital being dispersed in the market, the remaining 77.5
percent remain under EDP’s control.
The company is present in several European markets namely in Portugal, Spain, France, Belgium, Poland and Romania. Currently, its biggest European operation is in Spain with 2.169MW of gross installed capacity, Spain
is also the market where the company has the biggest pipeline in Europe. However, the company’s biggest
market is the United States with 2.530MW of installed capacity and prospects of over 18.000MW. EDPR is a pure wind player with a total gross installed capacity of 5.6GW. The company has a goal of achieving 10.5GW of installed capacity by year end 2012. The company’s track record in execution has been stellar with
company being on track to reach its installed capacity objective in 2012. In November 2009 the company reaffirmed the goals for 2009 of installing 1.2 to 1.3GWs, which leaves 0.6 to 0.7 Gigawatts to be installed in the fourth quarter. EDPR’s short-term pipeline (Tier I and II) is more than enough for the company to achieve its 2012 goals. EDPR represent the highest investment area of the overall group and is also expected to be highest growth area, reaching 25% of the Group’s EBITDA by the end of the company’s current business plan.
EDPR’s load factors are above market average, and therefore contribute to the company’s strong performance, see graph 30. EDPR’s capacity to choose
projects with higher wind potential is fundamental in generating more revenues out
Graph 28 – Installed capacity objectives
Source: EDPR
Source: EDPR
Tier I Tier II Tier III Prospects Total
Spain 373 485 1814 2341 5012
Portugal 351 14 9 200 574
France 55 58 356 753 1221
Belgium 0 0 37 25 62
Poland 0 456 406 604 1466
Romania 69 57 56 500 682
Europe 848 1070 2678 4423 9017
US 550 5563 7385 4564 18062
Brazil 70 234 336 869 1509
Total 1467 6866 10398 9856 28587
Table 5 – EDPR’s pipeline as of 9M2009
Graph 28: Gross Installed Capacity
Ticker: EDPR PL
Graph 27 – EDPR stock returns vs. PSI20
returns
Source: Bloomberg
Source: EDPR
EDP–ENERGIAS DE PORTUGAL COMPANY REPORT
EQUITY RESEARCH 06JANUARY 2010
PAGE 20/34
Graph 30 – Average load factors 2008
1Q 2Q
3Q 4Q
1Q
2Q
4Q
10% 20% 30% 40% 50%
US EU
of the same initial investment, making EDPR a company with above average expertise in wind generation.
EDPR’s business model is highly regulated, with different regulation schemes unique to each individual country. Neverthless, the regulatory and political environment is favourable to the company’s business model. Recently the UE reafirmed its quota of 20% renewable energy sources for 2020. In Spain the Government reafirmed ambitious target for 2010 and 2016 and the current regulatory framework is valid until 2012. In the United States the Obama administration has reaffirmed its commitment to promote the development of green energy. The United States’ current remuneration scheme for renewables is also very attractive, with green energy mandatorily acquired by utilities in the form of long term PPAs, and complementarily there are also federal tax incentives, either as production tax credits of 21$/MWh updated to inflation for the first ten years of the investment or in alternative cash grants equivalent to 30 percent of the initial investment. Finally, renewable energy projects are also allowed to depreciate a major part of the equipments in just 5 years.
Analysis
Presently environmental concerns have become a priority worldwide. The Copenhagen summit on climate change was the largest and most important conference on climate the United Nations ever organized. This goes a long way to show how authorities have realized how serious the problem we are facing is. Therefore, we feel EDPR strategy of focusing on green energy sources is
strategically wise. The company will certainly benefit from incentives Governments provide in order to promote the development of renewable energy. The European Union has reaffirmed its objectives for 2020 and the Obama administration is also very committed to promote the development of renewable energy sources in the U.S. Thus, EDPR’s two main markets (EU and the US) remain committed with green energy and therefore there are good prospects for the development of EDPR’s pipeline in the short-medium term.
EDPR is the main investment area of the group, representing 60% of the 3 billion Euros average annual capex of the group in the period of 2009-2012. This represents a very strong investment of the group in this business area, which can be optimized. 30% of the capex for a wind farm is normally dependent on local construction costs, whereas the remaining 70% is depend on turbine procurement costs, which are determined by supply and demand. The financial crisis might have created an opportunity for EDPR to increase the return of new investments. This could be achieved by timely procuring turbines, taking advantage of
significant increases in capacity by the manufactures in recent years and weakening demand due to funding constraints, which will drive turbine prices down.
EDP–ENERGIAS DE PORTUGAL COMPANY REPORT
EQUITY RESEARCH 06JANUARY 2010
PAGE 21/34
Valuation
We valuated EDP – Energias de Portugal using a Sum-of-Parts model (SoP), using discounted cash-flows for several business areas, multiples, market and book values. For the DCF valuation, free cash-flows were estimated and then discounted at Weighted Average Cost of Capital (WACC). An enterprise value (EV) of 8.86 per share was obtained, after adjusting for net debt and minorities we reached our price target of 3.68 per share.
Methodology
For all the areas valuated using DCF, we estimated different free cash flows using the following methodology:
Gross Margins
For the L/T contracted generation in Iberia we used the contractual gross margin that the PPA/CMEC contracts grant EDP. Some adjustments were made to the current year’s contractual gross margin to account for some assets non-availability to produce electricity. Nevertheless, this adjustment won’t have any impact on our valuation. Regarding special regime production gross margins were consider to evolve based on inflation.
For the regulated networks business area we used the regulators frameworks to determine allowed revenues. We assumed these frameworks would continue to represent the allowed revenues even after termination of the current regulatory periods.
For EDP’s liberalized generation operations we considered an average clean spark and dark spreads of approximately 15€ and 20€ each for 2009. For 2010 EDP has locked in an average thermal spread of 10€ for 70% of expected output, we assumed this would be the realized thermal spread for 2010.
Operational Costs
We assumed some operational costs would evolve based on the area’s activity, while personal costs were treated individually, so as to incorporate EDP’s staff reduction efforts in some areas. In the long-run the costs were assumed to evolve based on inflation.
Depreciation
We assumed current depreciation levels would continue in the present, and decline in the long run. New depreciation was calculated as a percentage of capex, according to the average useful life EDP considers the assets to have. Then it was added back to the each area’s existent depreciation levels.
Type of Asset Years
Building and other const. 8-50 Hydro Generation 32-65 Thermal Generation 25-40
Renewables 20
Electrical Distribution 10-40
Other 10-25
Table 6 – Average useful life
EDP–ENERGIAS DE PORTUGAL COMPANY REPORT
EQUITY RESEARCH 06JANUARY 2010
PAGE 22/34
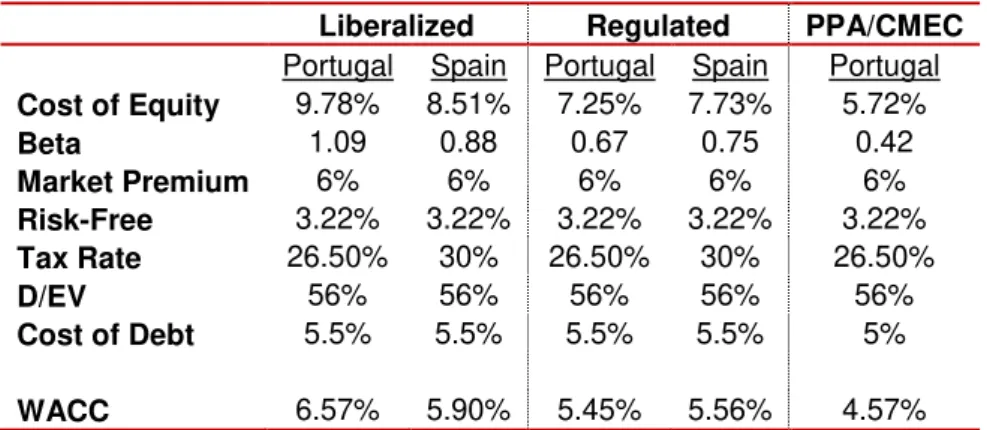
WACC
Regarding the weighted average cost of capital, the following table summarizes all the calculations performed, values used and assumptions made.
The same risk-free rate was used for all business areas. All EDP’s operations we valuated through DCF are situated in Iberia and both countries are part of Euro zone. The reference rate we used for this area was that of a 10 year Bund – 3.22%.
The betas for the several business areas were estimated using industry betas, see table 8. Regressions were run with three years of monthly data against the Dow Jones Euro Stoxx 50 Index for the seven companies including EDP3. REN’s IPO was on July 2007, therefore there was only a shorter time-series of data available. To improve the accuracy of the betas used for the different areas we used averages of several companies unlevered betas, re-levered to EDP’s present capital structure at market values. For the PPA/CMEC area we considered that its true beta is best approximated by those of totally regulated Iberian utilities that are only exposed to operational and regulatory risk. As such, we constructed this area’s beta based on an average of unleveraged betas from Enagás, REE and RENE, then this average was re-leveraged to EDP capital structure. The WACC used for the PPA/CMEC is low, in fact, our WACC at which this area’s cash flows are being discounted is slightly lower than the discount rate used by the authorities when the CMEC contracts were created, which was set at 4.85%. Nevertheless, we believe our value is correct as it was computed from the betas of companies we believe are comparable in terms of risks faced. The WACC’s low value for this area is justified by CMEC regulated nature, with the cash-lows EDP is entitled to receive being already known in advance and no risks faced (volume, price, margin), except for operational and regulatory. Regarding the regulatory risk, we consider it to be very small, as the CMEC is itself a
3The actual regression run is the following, (
Note: stands for excess returns)
The beta coefficients are significant at 5% significance level
Liberalized Regulated PPA/CMEC
Portugal Spain Portugal Spain Portugal
Cost of Equity 9.78% 8.51% 7.25% 7.73% 5.72%
Beta 1.09 0.88 0.67 0.75 0.42
Market Premium 6% 6% 6% 6% 6%
Risk-Free 3.22% 3.22% 3.22% 3.22% 3.22%
Tax Rate 26.50% 30% 26.50% 30% 26.50%
D/EV 56% 56% 56% 56% 56%
Cost of Debt 5.5% 5.5% 5.5% 5.5% 5%
WACC 6.57% 5.90% 5.45% 5.56% 4.57%
Table 7 – WACC calculation
Source: Research Estimates
Levered Unlevered
EDP 0.64 0.28
REN 0.20 0.06
REE 0.49 0.30
Iberdrola 0.84 0.47
Endesa 0.69 0.40
EDF 1.12 0.75
Enagás 0.61 0.35
Table 8 – Industry Betas
EDP–ENERGIAS DE PORTUGAL COMPANY REPORT
EQUITY RESEARCH 06JANUARY 2010
PAGE 23/34 2,98%
12,12%
14,85%
60,04% 8,02% 1,99%
LT Contracted Generation Iberia
Liberalised Activities Iberia
Regulated Networks Iberia
Wind Power
Brazil
Other
Graph 32 – Annual Capex per Business Area
mechanism that was created to ensure EDP would get the same financial compensation under market conditions as if the regime that preceded the CMEC (the PPAs) would continue to exist. Regarding the WACC used for the operations under market conditions, it was also obtained from industry betas and we
considered it to be higher in Portugal due to co-existence of the liberalized and regulated market, which creates a great deal of uncertainty as it is impossible to know ex-ante the parameters annually set by ERSE, which largely dictate if in a given year the liberalized market will thrive or shrink.
The cost of debt reflects EDP’s cost of financing its activities. We assume it to be equal across analyzed areas, because it depends on the same underlying market conditions and the debt is denominated in the same currency.
A market risk premium of 6% was used. Historical market risk premium is
generally accepted to be situated in between 4% and 6%,Mehra, R.; and Prescott, E. C. in “The equity premium in retrospect”. Our ex-ante expectation, given that global equity market are still recovering from last year’s economic and financial crisis is that the market premium will be high in the near future, therefore we chose the highest of the two values of the interval.
Capex
According to EDP’s business plan for the 2009-2012 period, the company’s average annual capex will be 3 billion Euros. We have considered this information in our model. When the previously mentioned plan was first introduced in 2008, there were doubts whether EDP could sustain such an ambitious investment plan, and if it could finance it. It is important to bear in mind that the crisis hit the
financial markets especially hard in 2008. Nevertheless, EDP has, since then, been able to get the necessary financing in international markets. As the financial crisis subsides, we believe EDP will continue to be able get the necessary financing in the future. Therefore, we believe the company can sustain its current investment pace. In fact, we feel confident that in 2009 EDP’s actual capex is
going to be higher than 3 billion Euros. This is due to a strong investment pace in r
e n e w a b l e s
0 500 1.000 1.500 2.000
2009E 2010E 2011E 2012E 2013E
M
il
li
o
n
E
u
ro
s
LT Contracted Generation Iberia Liberalised Activities Iberia
Regulated Networks Iberia Wind Power
Brazil Other
Source: Research Estimates
Graph 31 – Accumulated capex per
business area, (2009 - 2012E)
EDP–ENERGIAS DE PORTUGAL COMPANY REPORT
EQUITY RESEARCH 06JANUARY 2010
PAGE 24/34
Table 9 – Consumer price index and GDP deflator
EDP Renováveis that in 2009’s last quarter alone is planning to install 600 gross MW of additional capacity and to the acquisition of ex-gas natural assets. This long announced operation has been concluded on the last day of 2009, after EDP received all the necessary regulatory clearances.
We forecasted a small decline in annual capex until 2012. Afterwards EDPR’s strong investment period will have ended, and we have only considered the maintenance capex for this area.
Aditional Assumptions
We consider that the stock market is correctly valuating both EDP Renováveis and Energias do Brasil. In the SoTP model we used these two companies’ enterprise values at market prices (Market Cap plus 3Q 2009 Debt).
We considered OECD’s estimates for the consumer price index (CPI), Gross domestic product (GDP) growth and GDP deflator. These estimates are crucial because of the regulated nature of the EDP’s
business. Several regulatory regimes the company operates under, are updated using inflation data, namely the Portuguese, Spanish and Brazilian distribution. The GDP deflator is used solely for the Portuguese electrical distribution network. Additionally, GDP is also an important driver of electricity consumption. Until 2012 we assumed the OECD values on table 9, after the explicit forecasting period of study, we assumed a long-term growth of the Portuguese and Spanish economies of 2% and for the Brazilian of 5%. We used a terminal growth value (TGV) of 1.5%.
EDP is the concession holder for the Portuguese national electricity distribution grid and the company with the highest market share in the Portuguese electrical generation and supply markets. Therefore, it is crucial for our valuation to predict the long-run trend in electricity demand in Portugal, as it directly influences revenues related to electricity distribution, generation and both regulated and liberalized supply, all of which together currently account for more than 40% of EDP’s EBITDA. To address this need to predict the future demand for electricity in Portugal an ordinary least squares regression was used. In the estimated
64% 15%
16%5%
EDP Endesa
Iberdrola Unión Fenosa Galp
2008 2009 2010 2011 2012
CPI (w/o housing)
Portugal 2.6% -0.8% 0.8% 1.% 2%
Spain 4.1% -0.4% 0.8% -0.1% 2%
Brazil 5.7% 4.3% 4.5% 5% 5%
GDP Growth
Portugal 0% -2.8% 0.8% 1.5% 1.5%
Spain 0.9% -3.6% -0.3 0.9% 1.5%
Brazil 5.1% 0% 4.8% 4.5% 4.5%
GDP Deflator
Portugal 2.5% 0.6% 0.2% 1% 2%
Source:
OECDGraph 33 – Liberalized market share
(as of October 2009)
EDP–ENERGIAS DE PORTUGAL COMPANY REPORT
EQUITY RESEARCH 06JANUARY 2010
PAGE 25/34
Electricity demand growth estimated to be 1.2% in the long run
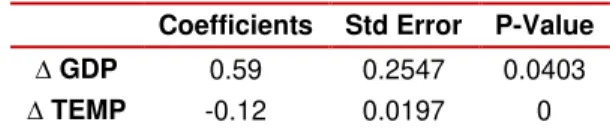
Table 10 – Regression output
Coefficients Std Error P-Value
∆ GDP 0.59 0.2547 0.0403
∆ TEMP -0.12 0.0197 0
Source: Research Estimates
regression, historical electricity distributed was used as a proxy for electricity demand. All the electricity that enters the distribution network is intended to be sold, except for losses in distribution, which is a persistent and unavoidable phenomenon. This being a stable phenomenon over time, means it alone is not responsible for any major shift in overall electricity distributed and consequently will not bias our estimates. We regressed the average quarterly variation in electricity distributed against the quarterly gross domestic product variation and average quarterly variation in temperature4.
The regression output is shown on table 10. The dataset used included 14 points and was obtained from the
Portuguese National Statistics Institute (INE) and Portuguese Meteorological Institute. Both coefficients are statistically
significant at a five percent significance level, and the regression has an adjusted R-squared of 75%. A white heteroskedasticity test was used, to asses if inference was valid. The null hypothesis of no heteroskedasticity could not be rejected at 5% significance level and the Jarque-Bera normality test on the regressions residuals presented a p-value of 0.74, therefore we cannot reject the null hypothesis of normality at five percent significance.
The previous regression’s results together with our expectations of GDP growth enabled us to forecast a long run increase in electricity demand for Portugal of about 1.2%.We have disregarded the effect of the parameter related with temperature, as the effects of climate change on global warming are difficult to predict. Nevertheless, the fact is that the current decade will most probably be the warmest ever since reliable temperature records exist. According to NCEP5 Portugal is in a globe region where the average annual precipitation rate is expected to decrease and temperature to increase. Therefore, this parameter might, in fact, gain more significance if global warming intensifies.
Despite this long run expectation of an annual increase of electricity demand of 1.2%, in short run, namely for the current year we expect electricity demand to be almost flat as compared to 2009. Uncertainties about the pace of economic recovery, higher electricity prices in the regulated and liberalized markets contribute to our view.
4∆ . ∆ ! " # . ∆ ! $ %& !
EDP–ENERGIAS DE PORTUGAL COMPANY REPORT
EQUITY RESEARCH 06JANUARY 2010
PAGE 26/34
Renewables represent approximately a quarter of EDP’s EV...
Price target for 2010 is 3.68€/share.
Source: Research Estimates
Sum of the Parts
Our price target of 3.67 Euros per share for year end 2010 was achieved through the usage of a SoTP parts model, which includes market values, multiples, book values and discounted cash-flow valuation. Our model is summed up in table 11.
The enterprise values presented in the table above were estimated according to the previously mentioned methodology. Both EDPR’s and EdB’s EV are market values, which were obtained by summing the market capitalization and last official information on debt (3Q 2009). Net debt for year end 2010 corresponds to the
EDP GROUP SoTP Million (€) €/share % of EV Valuation Method
NPV PPA 3939 1.08 12% DCF
NPV PPA Extension 2895 0.79 9% DCF
Special Regime 707 0.19 2% DCF
Liberalized Generation 3446 0.94 11% Multiples EV/EBITDA Liberalized Supply 536 0.15 2% Multiples EV/EBITDA
Generation & Supply 11523 3.15 36%
Electric Distribution PT 4330 1.18 13% DCF Electric Distribution SP 915 0.25 3% DCF
Gas PT 350 0.10 1% DCF
Gas SP 2380 0.65 7% DCF
Regulated Networks 7976 2.18 25%
EDP - Renewables 8600 2.35 27% MV - 100% EV
EDP - Brazil 3399 0.93 10% MV - 100% EV
BCP 128 0.03 0% MV
REN 39 0.01 0% MV
Treasury Stock 105 0.03 0% MV
Other 186 0.05 1% BV
Spanish Tariff Deficit 445 0.12 1% EDP Data - Book
Financial Assets 903 0.25 3%
EDP Group - Total EV 32401 8.86 100%
Net debt (2010E) 15237 4.17 Minorities (2010E) 2401 0.66 Pensions (Net of Taxes) 1322 0.36
Equity Value 13446
# Shares outstanding 3657 Price Target YE 2010 3.68