Production parameters and forage loss of oat and rye grass pastures
managed with beef heifers fed diets with energy supplementation
Luiz Angelo Damian Pizzuti1, Dari Celestino Alves Filho1, Ivan Luiz Brondani1, Leandro da Silva Freitas1, Patrícia Alessandra Meneguzzi Metz1, Álisson Marian Callegaro1, Rangel
Fernandes Pacheco1, Lucas Braido Pereira1
1 Departamento de Zootecnia - Universidade Federal de Santa Maria.
ABSTRACT - Production parameters of intercropped pastures of oat and rye grass managed with beef heifers supplemented with brown rice meal and/or protected fat were evaluated. Twenty-eight Charolais × Nellore crossbred heifers at initial average age of 18 months and initial average live weight of 274.9 kg were utilized in the experiment. Animals were kept on oat + rye grass pastures and distributed in the following treatments: no-supplementation (NS): heifers kept only in pastures; Megalac (MEG): supplementation with protected fat; brown rice meal (BRM): supplementation with BRM; BRM + MEG: supplementation with BRM plus protected fat. The greater participation of oat leaf was from July 5th to August 10th, 2009 and of rye grass, from August 30th to September 26th, 2009. The crude protein content increased until the 55th day (225.1 g/kg). Pasture total digestible nutrients presented a cubic behavior, with an average of 722.0 g/kg. The highest supply of leaf blades, 5.17 kg of dry matter/100 kg of live weight, was found in the second period. Pasture intake increased throughout the periods. Forage mass and support capacity of the animal did not differ between treatments, presenting means of 1245.02 kg of dry matter/ha and 882 kg of live weight/ha, respectively. Stoking rate, forage loss and pasture intake were not affected by the treatments. Supplementation of beef heifers with rice meal and/or protected fat did not change production parameters of oat + rye grass pastures or pasture intake. Increase in daily accumulation rate of dry matter and supporting capacity of the animals increases forage losses.
Key Words: crude protein, forage loss, forage mass, intake, leaf blade offer
Introduction
Knowledge of variables influencing the beef cattle production system, be it extensive, semi-intensive or intensive is determining for the final desired objective to be reached within thresholds economically consistent with the response targeted. The planning of livestock activity based on pasture implies knowing the distribution pattern of forage production over growth season, estimating the expected forage productivity and defining the supporting capacity of the animal in function of the individual weight gain designed for each category (Freitas et al., 2005a). The understanding and the correct application of technology guiding forage production take fundamental role in the survival of the production systems (Roso et al., 1999), in which more intensive systems are those in which forage is the main component of the diet, but with the addition of several forms of animal supplementation (Rocha et al., 2004).
Utilizing supplements alone or in mixtures may change pasture management due to the effect provided to the
animals, known as substitutive, additive or additive/ substitutive effect. The occurrence of such effects will be conditioned to the level and to the types of supplements used, which almost always cause an effect mainly concerning the supporting capacity of the animal as well as forage selectivity by the animal, which may be influenced so as to change the productive response of the pasture.
When evaluating growth of beef heifers grazing black oat + rye grass, Pilau et al. (2004) found that the supply of 15 g of wheat meal per kg of live weight provided a greater supporting capacity of the animal. In another study, supplementation with 10 g of ground sorghum per kilogram of live weight promoted greater mass of leaf blades in oat + rye grass pastures and an increment in the supporting capacity of the animal (Rocha et al., 2004). Pasture supplementation may also affect weight gain and stoking rate in a positive manner, allowing that a greater number of females be ready for matting simultaneously (Pötter, 2008); however, the understanding of pasture response when certain supplements are supplied to the animals
ISSN 1806-9290
www.sbz.org.br R. Bras. Zootec., v.41, n.8, p.1928-1936, 2012
is very important to comprehend the animal interface, plant and management. In addition to those factors, some supplements such as protected fat tend to benefit other animal interests. According to Funston (2004), the use of lipid supplements may have a positive effect on reproduction of beef cattle regardless of the input energy. It has been demonstrated that the use of lipid supplements positively affects important reproduction functions in many tissues, including the hypothalamus, anterior hypophysis, ovary and uterus.
Thus, the objective of this study was to evaluate production parameters and forage losses of pastures with intercropping of oat and rye grass managed with beef heifers supplemented with brown rice meal and/or protected fat.
Material and Methods
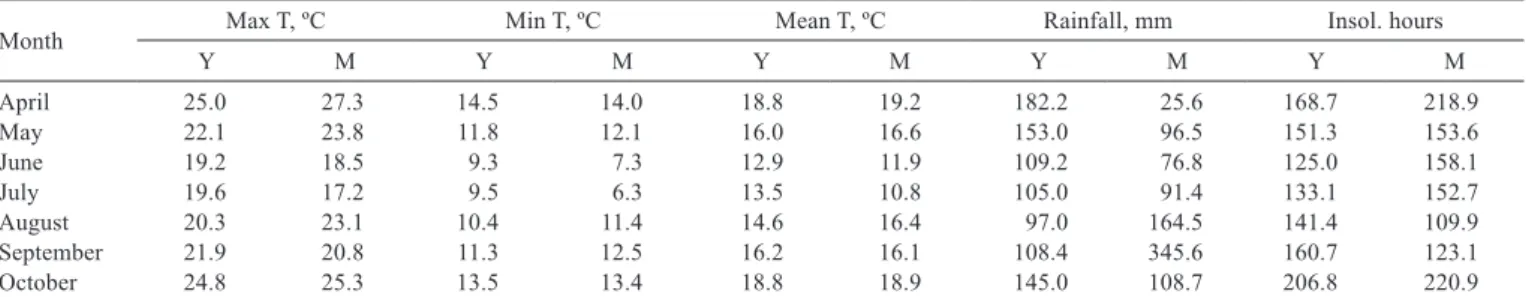
The experiment was carried out in the Beef Cattle Laboratory in the Animal Science Department of Universidade Federal de Santa Maria. This area is located in Central Depression of Rio Grande do Sul, at 95 m of altitude, 29º 43' South latitude and 53º 42' West longitude. The soil in the experimental area belongs to São Pedro mapping unit and is classified as paleaudalf (Embrapa, 1999), presenting a slightly undulating relief, with deep, well drained and naturally acid soils with sandy superficial texture. The climate in the region is Cfa (subtropical humid), according to the Köppen classification, with an annual average rainfall of 1769 mm, annual mean temperature of 19.2 ºC, with minimum mean temperature of 9.3 ºC in June and maximum mean temperature of 24.7 ºC in January (Table 1), insolation of 2212 annual hours and relative air humidity of 82% (Moreno, 1961).
The experimental area corresponded to 16.3 ha, with 11.7 ha divided in 12 paddocks with a variable area where control animals were managed and 4.6 ha where the regulating animals stayed. Pasture implementation took place on April 1st, 2009 with a broadcast sowing of 31.2 kg/ha
of rye grass (Lolium multiflorum Lam.) seeds based on 100% of cultural value and on April 2nd, 3rd and 4th, row sowing of 77.4 kg/ha of black oat (Avena strigosa Schreb.) seeds based on 100% of cultural value was performed. Base fertilization used 141 kg/ha of 5-20-20 NPK fertilizer. Cover fertilization was done at four moments: June 4th, 2009 – 47 kg/ha urea; June 16th, 2009 – 124 kg/ha 5-20-20 NPK fertilizer; September 11th, 2009 – 77 kg/ha urea; August 22nd, 2009 – 38.5 kg/ha urea.
Pastures took 70 days to be established, and then the animals were placed on them. The last 15 days before the beginning of the experimental period were for adaptation of the animals to the supplement and to the management. Experimental period totalized 112 days, from July 5th, 2009 to October 24th, 2009, divided into four 28-day periods. Twenty-eight Charolais × Nellore crossbred heifers at initial average age of 18 months and initial average live weight of 274.9 kg were distributed in the following treatments: no-supplementation (NS): heifers kept on oat + rye grass pastures only; Megalac (MEG): heifers kept on oat + rye grass pastures fed 3% of protect fat under estimate of total dry matter intake, set at 30 g/kg of live weight (LW); brown rice meal (BRM): heifers kept on oat + rye grass pastures fed brown rice meal at the level of 8 g per kg of live weight; brown rice meal + Megalac (BRM+MEG): heifers kept on oat + rye grass pastures fed brown rice meal at the level of 8 g/kg of live weight plus 3% of protected fat under estimate of total dry matter set at 30 g/kg of live weight.
Each treatment consisted of three replicates per area, with a variable number of animals within the replicates; two paddocks with two heifers each one and a paddock with three heifers.
Forage mass was determined by the double-sampling technique (Wilm et al., 1944), at the beginning of the grazing period and then every 14 days. Five cuts of 0.25 m2
were performed at the ground level in each replicate and 20 visual estimates were also done. A sample was taken from each cut performed in the replicate for a composite sample.
Month Max T, ºC Min T, ºC Mean T, ºC Rainfall, mm Insol. hours
Y M Y M Y M Y M Y M
April 25.0 27.3 14.5 14.0 18.8 19.2 182.2 25.6 168.7 218.9 May 22.1 23.8 11.8 12.1 16.0 16.6 153.0 96.5 151.3 153.6
June 19.2 18.5 9.3 7.3 12.9 11.9 109.2 76.8 125.0 158.1
July 19.6 17.2 9.5 6.3 13.5 10.8 105.0 91.4 133.1 152.7
August 20.3 23.1 10.4 11.4 14.6 16.4 97.0 164.5 141.4 109.9 September 21.9 20.8 11.3 12.5 16.2 16.1 108.4 345.6 160.7 123.1 October 24.8 25.3 13.5 13.4 18.8 18.9 145.0 108.7 206.8 220.9
Table 1 - Means of maximum temperature (Max T), minimum temperature (Min T), mean temperature (Mean T), rainfall (mm) and insolation (hours) observed from April to October 2009 (M) and in 30 years of observations (Y)
Forage from the composite sample was homogenized and divided in two sub-samples, one for the determination of dry matter (DM) content and the other for manual separation of plant components of the pasture in leaf of the oat, stem of the oat, leaf of the rye grass, stem of rye grass, dead material and other species.
A continuous grazing method with variable stocking rate was adopted, using the “Put and take” technique (Mott & Lucas, 1952). Forage mass was pre-determined at 1200 kg DM/ha. Regulating animals were used whenever necessary. Those animals were kept in an area attached to the experimental area with oat + rye grass pasture for adjustment of forage availability. For the adequation of the animal supporting capacity and intended forage mass, a forage disappearance rate of 45 g/kg of DM (30 g of intake + 15 g of forage loss) was considered. Thus: adjusted supporting capacity = (daily accumulation rate + (actual forage mass – forage mass desired)/number of days) * 100/ forage disappearance rate.
The estimation of daily accumulation rate of pasture dry matter was performed every 28 days by using three cages of grazing exclusion per paddock according to the methodology described by Klingmann et al. (1943). Dry matter accumulation rate per period was estimated through the equation described by Campbell (1966):
Tj = Gi – Fg (i-1) n
In which: Tj = daily DM accumulation rate/ha, in period j; Gi = average DM amount/ha of the three cages in evaluation i; Fg = average of the amount of DM/ha at the three points at evaluation i-1; n = number of days in the period. Total dry matter production was calculated by the sum of the production in the periods (daily accumulation rate × number of days) added by initial forage mass.
Forage loss was determined by the methodology proposed by Hillesheim (1987), in which nine sampling points were defined in each paddock, in three transects by using wood poles buried in the soil. Poles were approximately 10 cm above ground and every 28 days, 0.0625 m2 squares were placed between them for collection
of forage regarded as non-usable by the animals (senescent, dead material or material damaged by trampling and defecation). Samples were taken to oven for being weighed and dried. The amount of DM obtained in the total collected area (0.0625 m2 × 9 sampling points) was
extrapolated by one hectare, so forage mass was determined per period and per treatment in kg/day/ha of DM. Forage loss was obtained in % of live weight by dividing forage loss by supporting capacity of the animal. For the calculation of
the estimate of DM intake per treatment and period, final forage mass of the period and forage loss occurring over the period were subtracted from total production of DM/ha in the period. Dry matter intake was obtained in g/kg of live weight for each period by dividing the estimated intake of DM/ha by the animal supporting capacity in the period.
Supporting capacity of the animal per period was calculated by summing average weight of control animals (Pt), added by weight of regulating animals (Pr), multiplied by number of days that the latter ones stayed on pasture (D) and divided by the number of days in the period (NDP). Supporting capacity of the animal was expressed in kg of LW/ha according to the following formula:
Supporting
capacity of the animal = Pt + (Pr1 × D1) + (Pr2 × D2) ... NDP NDP From the values of forage mass, pasture accumulation rate and supporting capacity of the animal, forage supply, in kg of DM/100 kg of LW, was determined through the formula: FS = ((((iMF+fMF)/2)/no. of days)+ DAR)/ SC*100, in which: FS = forage supply in the period; iMF = initial forage mass in the period; fMF = final forage mass in the period; DAR = daily accumulation rate of DM in the period; SC = supporting capacity of the animal in the period. Leaf blade supply was obtained by multiplying the percentage of leaf blade by forage supply.
For sampling of forage consumed by the heifers, grazing simulations were carried out in each experimental period, in which two trained evaluators collected approximately 0.4 kg of forage material similar to that collected by the animals after 15 minutes of observing their ingestive behavior (Euclides et al., 1992). Samples were pre-dried in forced circulation oven at 55º C, for 72 hours, until constant weight, when they were ground in Willey-type mill with 1 mm mesh sieve.
Total digestible nutrients (TDN) were calculated from chemical composition of feeds through equation of Weiss et al. (1992), as in the following description:
TDN = digNFC + digCP + (digEE x 2.25) + digNDF – 7 In which:
digNFC = 0.98 * (100 - (NDFap + CP + EE + Ash)); forage digCP = CP * Exp (-1.2 * ((ADIN * 6.25)/CP)); concentrate digCP = (1 – (0.4 * ((ADIN * 6.25)/CP))) * CP; digEE = (EE – 1);
digNDF = 0.75 * (NDFap-ADL) * (1 - (ADL/NDFap)0.667)
digNFC = digestible non-fibrous carbohydrates; forage digCP = digestible crude protein of the forage; concentrate digCP = digestible crude protein of the concentrate; digEE = digestible ether extract; digNDF = digestible neutral detergent fiber; ADL = acid detergent lignin; ADIN = acid detergent insoluble nitrogen; NDFap = neutral detergent fiber corrected for ash and protein; and CP = crude protein. The subtracted value 7 refers to the adjustment factor for the metabolic fecal TDN.
The experimental design was completely randomized with three replicates per area in a 4 × 4 factorial arrangement (four treatments × four periods). The variables were tested for normality by using the Shapiro-Wilk test. Data were submitted to analyses of variance and the F test at the level of 5% of significance by using PROC MIXED, and AIC was used as the information criterion for choosing the best covariance structure, and when differences between means were found, they were compared by Student’s t test.
The mathematical model used in the analyses of variance was the following:
Yijk = µ + Ti + Rk (Ti) + Pj + (TP)ij + eijk
In which: Yijk = dependent variables; µ = mean of all observations; Ti = effect of the i-th feeding treatment; Rk
(Ti) = effect of the k-th repetition within the i-th treatment (error a); Pj = effect of the j-th period; (TP)ij, = interaction
between the i-th treatment and the j-th period; and eijk =
total experimental error (error b).
Regression test, Lack-of-fit test and test of correlation were carried out at the level of 5% of significance. Data analyses were done by using statistical package SAS (Statistical Analysis System, version 8.01).
Results and Discussion
The average rainfall observed in the months of pasture establishment (April and May) was extremely low, especially in April, corresponding to only 14.5% of the average observed in 30 years, with all rainfall occurring in only one day (Table 1).
The low rainfall at the moment of crop establishment delayed initial development of the plants, especially for oats, due to the lack of humidity, contributing to prorogation of the animal entry into the pastures, occurring after 70 days of pasture establishment. However, oat has the capacity of withstanding long drought periods, recovering after rainfall (Baier et al., 1989). Pasture period for oat + rye grass mixture usually takes place between 45 to 60 days (Roso et al., 2000; Frizzo et al., 2003; Pilau et al., 2005b). Another untypical factor found was rainfall above average from August to September, 69.6 and 218.8%, respectively, concomitant to insolation for those two months, 27% lower than the average. When insolation is reduced, the energy absorbed by photosystems of chloroplasts will be reduced, so lower amounts of electrons are carried, thus reducing energy production from photosynthesis and the development of plants as a consequence (Taiz & Zeiger, 2009).
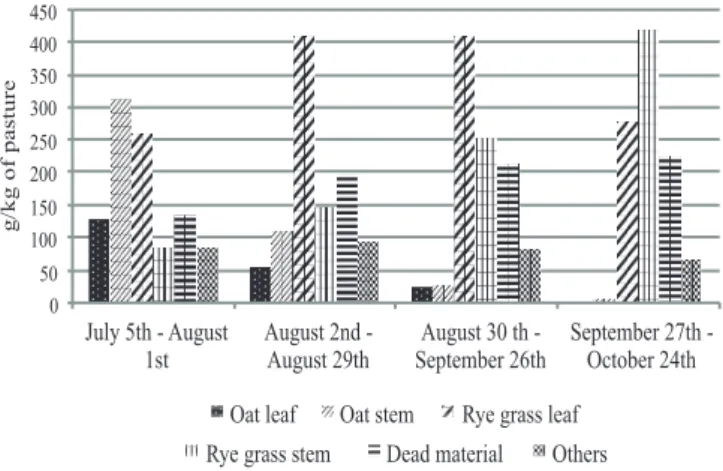
There was no interaction (P>0.05) between treatment and period for variables of plant composition, which presented distinct behavior over periods, and participation of leaves of oats (Figure 1) reduced as pasture development stage advanced, and its contribution to leaf blade mass was null in the last days of pasture use. The reduced participation of oat leaves in the initial period of grazing may be explained as a function of the low rainfall (Table 1) which occurred in the beginning of pasture establishment, although there was a great contribution by oat leaves in June and July in function of production concentration, which was around 60% (Baier et al., 1989).
Figure 1 - Plant composition of oat + rye grass pastures over grazing period.
Oat leaf = 153.8042-1.4591*Day (R2 = 0.83; CV = 41.12%; P<0.0001).
Oat stem = 364.2167-3.5701*Day (R2 = 0.80; CV = 49.73% P<0.0001).
Rye grass leaf = -28.5396+12.8493*Day-0.0904*Days2 (R2 = 0.68; CV = 14.95%;
P<0.0001).
Rye grass stem = -51.5208+3.9811*Day (R2 = 0.90; CV = 18.17%; P<0.0001).
Dead material = 117.4458+1.0837*Day (R2 = 0.35; CV = 24.52%; P<0.0001).
Others = 79.4 (P>0.05). CV - coefficient of variation.
0 50 100 150 200 250 300 350 400 450
July 5th - August
1st
August 2nd
-August 29th
August 30 th
-September 26th
September 27th
-October 24th
Oat leaf Oat stem Rye grass leaf
Rye grass stem Dead material Others
g/kg
of
When climate conditions were favorable, the component oat leaf contributed with 439.0 g/kg of available forage in a study carried out by Frizzo et al. (2003) in the same area. The importance of using intercropping of oat + rye grass gets clear when oat leaves are reduced in the forage mass and there is an increase in rye grass leaves starting from late July (Figure 1), remaining constant during August and September, from which participation of stems of rye grass gains expressivity.
Pasture dead material presented an increasing behavior (Figure 1) due to the use of two forage species with distinct growth, black oat, which presents growth faster than the one of rye grass, and therefore it enters in the reproductive stage earlier than the other, whereas rye grass tends to present a slower growth. However, its grazing is longer, (Fonseca, 1997), thus increasing participation of dead material throughout grazing.
The chemical composition of grazing pasture simulation apprehended by heifers did not present interaction between treatment and period and it did not differ (P>0.05) between treatments (Table 2).
Pasture dry matter (DM) ranged during the oat + rye grass grazing period, in which the leaf of rye grass was the main factor for this behavior, presenting a correlation of -0.55 (P<0.0001). Pasture crude protein (CP) increased until day 55, and then it decreased until final grazing period. The leaf/stem ratio (Table 3) presented an evolution close to CP, with maximum participation on the 66th day and when the variables were correlated, the resulting coefficient was 0.41 (P = 0.0037). The CP content found in all periods in analyses of grazing simulation is above that recommended by the NRC (1996), 126 g/kg of CP, for beef heifers to gain
approximately 1.1 kg. Although the CP requirement was met in all periods, it is important to highlight that there are some variations over the grazing cycle, once the use of average content to infer the gain of the grazing heifers may induce to errors which will influence animal performance, especially if the pasture does not present a high content of CP, like temperate grasses.
The content of total digestible nutrients (TDN) presented a cubic behavior (Y = 829.7598-6.1384*Day+0.1026*Day2
-0.0005121*Day3 R2=0.17; CV=2.96% P=0.0212), which
was higher than 70% in all periods of the pasture cycle. High content of pasture TDN is particularly associated with the amount of ether extract and the low neutral detergent fiber obtained in samples of grazing simulations, which are in agreement with data reported in the literature (Silveira et al., 2006; Rodrigues et al., 2002).
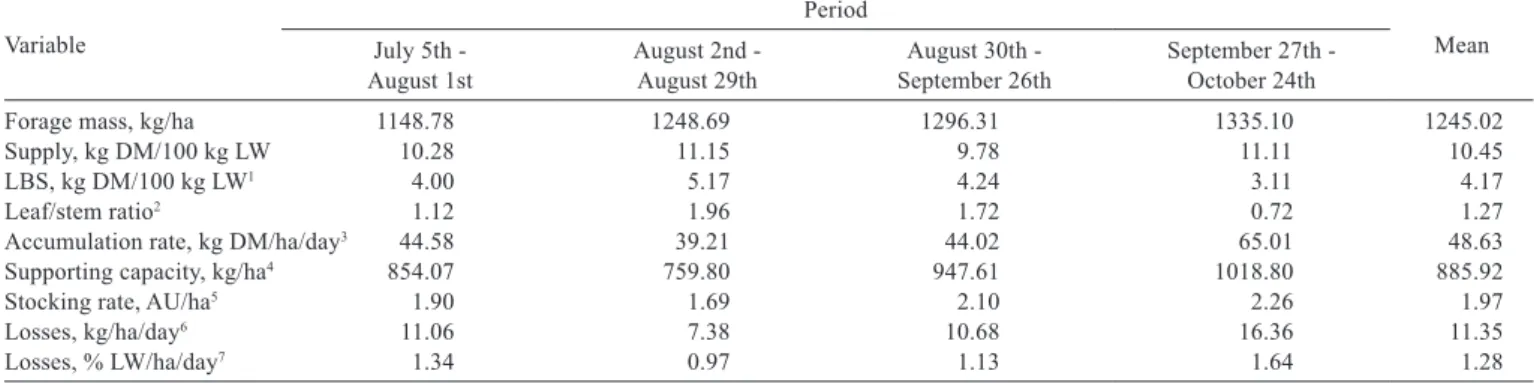
There was no interaction (P>0.05) between treatment and period for the variables of pasture response (Table 3). Forage mass did not present a significant alteration over the periods, staying close to the target forage mass of 1200 kg of DM/ha, so forage offer was not altered either. To avoid reduction of pasture intake, with a consequence compromising of animal performance, pasture shall be managed keeping a minimum availability of 1200 kg/ha/DM (Moraes, 1991).
Besides not compromising animal performance, the lower maintenance of forage availability by using supplementation enables increase in the supporting capacity of the animal (Pilau et al., 2005a), which is very important for obtaining increase in the productive response per area, mainly when the animal category is beef heifers for reposition.
Variable, g/kg
Period
Mean July 5th -
August 1st August 2nd - August 29th September 26th August 30th - September 27th - October 24th
Dry matter1 188.4 176.7 168.2 202.7 184.4
Organic matter2 880.6 877.7 895.4 896.4 887.3
Crude protein3 212.9 219.2 215.5 158.5 201.1
Neutral detergent fibera4 379.1 397.9 432.4 420.9 407.3
Acid detergent fibera5 206.7 237.0 242.7 247.9 233.6
Ether extract6 52.1 56.8 57.9 41.0 51.4
Lignin7 23.5 27.7 22.2 27.5 25.2
Ash8 119.4 122.3 104.6 103.6 112.7
Total digestible nutrients9 727.1 717.8 736.5 709.8 722.0
Table 2 - Means and regression equations of chemical analyses of samples from grazing simulation in different periods
1Y = 163.65+2.0111*Day-0.0486*Day2+0.0003017*Day3 (R2=0.56; CV=6.47%; P=0.0179). 2Y = 940.8917-3.6204*Day+0.0602*Day2-0.0002807*Day3 (R2=0.46; CV=1.08%; P=0.0053). 3Y = 165.4277+2.1803*Day-0.0199*Day2 (R2=0.44; CV=14.23%; P=0.0005).
4Y = 367.6208+0.5698*Day (R2=0.27; CV=7.33%; P=0.0002). 5Y = 201.2792+0.4633*Day (R2=0.33; CV=9.01%; P<0.0001).
6Y = 34.8636+0.7788*Day-0.00064219*Day2 (R2=0.63; CV=9.71%; P<0.0001).
Although forage mass did not vary, the supply of leaf blades had more participation in pasture intermediate periods at the same time when there was a more significant contribution of rye grass leaves, with a high correlation (r=0.66; P<0.0001) between the two variables. This difference, which was caused by pasture structure, is also found in the last period, when participation of stem mass of rye grass increases due to the reproductive stage of the species in this period, making accumulation rate kg/day/ ha/DM more expressive at this moment. As forage mass was kept the same in all periods (Table 3), the supporting capacity of the animal supported by grazing ranged according to accumulation rate in kg/day/ha/DM, with the lowest load found in the second period (759.80 kg/ha) and the heaviest one found in the last period (1018.80 kg/ha). If the observed mean, 885.92 kg/ha, is taken into account, stocking rate was around 2 AU/ha, but since yearling heifers were used, if the objective was to reach 65% of the adult weight for mating, this would make it possible to manage 3 AU/ha, maximizing gain per grazing area.
It was found that forage losses expressed in absolute values, kg/ha/day and in % of LW (Table 3) presented a quadratic behavior as the supporting capacity of the animal increased, the losses in kg/ha/day also increased, presenting a correlation of 0.40 (P = 0.0058). According to Hillesheim (1998), trampling, difficulty of apprehension and natural senescence of the plants determine forage losses, where the supporting capacity of the animal and forage mass are one of the main variables determining the intensity of the losses. The same quadratic behavior for losses in %LW and in kg/ha/day was obtained by Rocha et al. (2004), during
the months of evaluation, with a reduction in the losses during August and with greater losses as the grazing period reached the final stage.
Both the composition of the harvested forage (Table 2) and the forage supply (Table 3) during the grazing period did not limit pasture intake, which increased linearly over days of pasture use with an increase of 0.165 g/day (Figure 2).
According to Forbes (1995), animal voluntary intake is controlled by more than one factor, and in high palatability diets, total dry matter intake may increase as a consequence of animal performance (Russek, 1978). Because factors which may limit this linear increase in dry matter intake are not detected and because animals presented a constant evolution of live weight, it is likely that this increase occurred to supply the energy required for maintenance and
Variable
Period
Mean July 5th -
August 1st August 2nd - August 29th September 26th August 30th - September 27th - October 24th
Forage mass, kg/ha 1148.78 1248.69 1296.31 1335.10 1245.02
Supply, kg DM/100 kg LW 10.28 11.15 9.78 11.11 10.45
LBS, kg DM/100 kg LW1 4.00 5.17 4.24 3.11 4.17
Leaf/stem ratio2 1.12 1.96 1.72 0.72 1.27
Accumulation rate, kg DM/ha/day3 44.58 39.21 44.02 65.01 48.63
Supporting capacity, kg/ha4 854.07 759.80 947.61 1018.80 885.92
Stocking rate, AU/ha5 1.90 1.69 2.10 2.26 1.97
Losses, kg/ha/day6 11.06 7.38 10.68 16.36 11.35
Losses, % LW/ha/day7 1.34 0.97 1.13 1.64 1.28
Table 3 - Response of oat + rye grass grazing over grazing periods
LBS - leaf blade supply; AU - animal unit (450 kg).
1Y = 1.9399+0.09832*Day-0.00078967*Day2 (R2=0.41; CV=21.73%; P<0.0001). 2Y = -0.55563+0.07691*Day-0.00058594*Day2 (R2=0.72; CV=22.52%; P<0.0001). 3Y = 62.81857-0.87086*Day+0.00794*Day2 (R2=0.37; CV=27.08%; P=0.0023). 4Y = 979.10718-6.79126*Day+0.06493*Day2 (R2=0.30; CV=16.00%; P=0.0178). 5Y = 2.17562-0.01510*Day+0.0001444*Day2 (R2=0.30; CV=16.00%; P=0.0178). 6Y = 18.51883-0.35888*Day+0.00305*Day2 (R2=0.32; CV=42.35%; P=0.0014). 7Y = 2.08069-0.03462*Day+0.00027473*Day2 (R2=0.15; CV=46.84%; P=0.0175).
Figure 2 - Variation in pasture intake in percentage of live weight during periods of oat + rye grass pasture use.
Y = 27.1542+0.1665*Day (R2 = 0.18; CV = 28.63%; P = 0.0023)
gain. However, it is important to stress that from the second period on, pasture DM intake was over 30 g/kg of live weight at the same time when there was an increase in the occurrence of dead material on pastures, so it can be inferred that determination of intake by the agronomic method may have overestimated intake as pasture cycle advances.
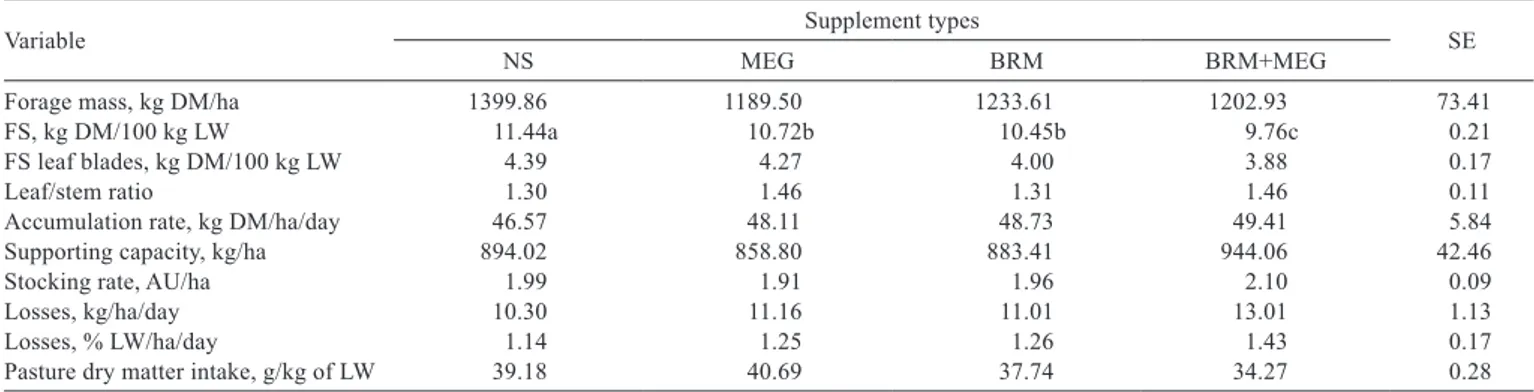
Forage mass did not differ significantly between treatments (Table 4), and all of them were within the range from 1200 to 1600 kg DM/ha, which Mott (1984) considers as necessary for the maximum animal performance in temperate pastures.
Forage supply, in kg of DM/100 kg LW, was higher for the NS treatment, and the MEG and BRM treatments were intermediate; the lowest supply was found for BRM + MEG. Although there were differences between the supplies, there was no limitation for animal performance, once the lowest supply found was 9.76 kg DM/100 kg LW and for intake to be unlimited, forage supply should always be higher than 4 to 6 kg/100 kg of LW (Mott, 1984). According to Bandinelli et al. (2005), real supply of average biomass higher than 5.74 kg of DM/100 kg of LW allows individual gains higher than 1 kg/day. When grazing is managed with daily supply from 10 to 12 kg of DM/ 100 kg of LW, the maximum animal performance can be demonstrated (Hodgson, 1990), so heifers of all treatments had the opportunity to show their maximum potential of individual performance due to the supplies and per area, because the forage mass to which they were subjected was 1245.02 kg DM/ha (Table 3) on average. Regarding the supply of leaf blades, in which, according to Forbes & Hodgson (1985), of the components of the forage, leaf fraction is the one which presents the best quality and represents more than 80% of the diet, there was no difference between treatments (P>0.05) (Table 4).
No significant difference was found for the leaf/stem ratio in function of the type of supplement supplied, corroborating the results found by Freitas et al. (2005b), when increasing, decreasing and fixed levels of supplement were offered to heifers on oat + rye grass pastures. This shows that response of pasture for structural components such as leaves and stems is not affected by the different types of supplements offered to heifers. Animal supporting capacity did not differ (P>0.05) between treatments even when supplement was offered to the heifers. For the MEG treatment, it was expected that the supporting capacity of the animal would not increase due to the reduced amount supplement provided, which corresponded to 3% over the total dry matter intake stipulated at 3%. Pasture intake was reduced, but not in a significant manner among treatments, for treatments BRM and BRM + MEG with a greater inclusion of concentrate, 8 g/kg of LW. Because pasture intake did not differ between treatments, despite the reduction by 3.83% and 12.5% in treatments BRM and BRM + MEG in relation to the treatment without supplementation, and because there was no difference in daily accumulation rate kg/DM/ha/day of pasture (Table 4), supporting capacity of the animals was not influenced by treatments (P>0.05). Supplement type may be one of the determining factors for the increase in supporting capacity of the animal. For supplements such as soybean or corn hulls with a supply of 9 g/kg of LW, the supporting capacity of the animal was incremented only with the use of corn (977.6 kg/ha), not differing between soybean hull and exclusive grazing: 923.7 and 877.0 kg/ha, respectively (Santos et al., 2004). When increasing or decreasing (3; 6; 9; 12; 15 g/100 kg of LW) supplements of wheat meal or fixed value of 9 g/kg of LW were used during the grazing period, the supporting capacity of the animal was not changed, with an average of 1,961.0 kg/ha of live weight (Freitas et al., 2005b).
Variable Supplement types SE
NS MEG BRM BRM+MEG
Forage mass, kg DM/ha 1399.86 1189.50 1233.61 1202.93 73.41
FS, kg DM/100 kg LW 11.44a 10.72b 10.45b 9.76c 0.21
FS leaf blades, kg DM/100 kg LW 4.39 4.27 4.00 3.88 0.17
Leaf/stem ratio 1.30 1.46 1.31 1.46 0.11
Accumulation rate, kg DM/ha/day 46.57 48.11 48.73 49.41 5.84
Supporting capacity, kg/ha 894.02 858.80 883.41 944.06 42.46
Stocking rate, AU/ha 1.99 1.91 1.96 2.10 0.09
Losses, kg/ha/day 10.30 11.16 11.01 13.01 1.13
Losses, % LW/ha/day 1.14 1.25 1.26 1.43 0.17
Pasture dry matter intake, g/kg of LW 39.18 40.69 37.74 34.27 0.28
Table 4 - Response of oat + rye grass grazing subjected to grazing by beef heifers supplemented with different energy sources
Means followed by different letters in the row differ (P<0.05) by the t test.
Conclusions
Supplementation of beef heifers with brown rice meal and/or protected fat does not reflect in changes in the production parameters of oat + rye grass grazing or change pasture intake.
Acknowledgments
The authors would like to thank Química Geral do Nordeste for suplying Megalac® so this experiment could
be carried out.
References
ASSOCIATION OF OFFICIAL ANALYTICAL CHEMISTRY - AOAC. Official methods of analysis. 16.ed. Washington, D.C. 1995. 2000p. BAIER, C.A.; FLOSS, E.L.; AUDE, M.I.S. As lavouras de inverno-1.
Aveia, triticale, centeio, colza e alpiste. 2.ed. São Paulo: Editora Globo, 1989. 172p.
BANDINELLI, D.G.; QUADROS, F.L.F.; MAIXNER, A.R. et al. Desempenho animal em pasto de aveia e azevém com distintas biomassas de lâminas foliares. Pesquisa Agropecuária Brasileira, v.40, n.12, p.1231-1238, 2005.
CAMPBELL, A.G. Grazed pasture parameters. Pasture dry matter production and availability in a stocking rate and grazing management experiment with dairy cow. Journal of Agricultural Science, v.67, n.2, p.199-210, 1966.
EMPRESA BRASILEIRA DE PESQUISA AGROPECUÁRIA - EMBRAPA. Centro Nacional de Pesquisa de Solos. Sistema brasileiro de classificação de solos. Brasília: EMBRAPA; Rio de Janeiro, 1999. 412p.
EUCLIDES, V.P.B.; MACEDO, M.C.M.; OLIVEIRA, M.P. Avaliação de diferentes métodos de amostragem sob pastejo. Revista Brasileira de Zootecnia, v.21, n.4, p.691-702, 1992.
FREITAS, F.K.; ROCHA, M.G.; BRONDANI, I.L. Suplementação energética na recria de fêmeas de corte em pastagem cultivada de inverno. Dinâmica da pastagem. Revista Brasileira de Zootecnia, v.34, n.6, p.2029-2038, 2005a.
FREITAS, F.K.; ROCHA, M.G.; RESTLE, J. et al. Suplementação energética na recria de fêmeas de corte em pastagem cultivada de inverno. Produção animal. Revista Brasileira de Zootecnia, v.34, n.4, p.1256-1266, 2005b.
FRIZZO, A.; ROCHA, M.G.; RESTLE, J. et al. Produção de forragem e retorno econômico da pastagem de aveia e azevém sob pastejo com bezerras de corte submetidas a níveis de suplementação energética. Revista Brasileira de Zootecnia, v.32, n.3, p.632-642, 2003. FONSECA, M. Plantio direto de forrageiras: sistema de produção.
Guaíba: Editora Agropecuária, 1997. 101p.
FORBES, J.M. Voluntary intake and diet selection in farm animals. Wallingford: CAB Publishing, 1995. 544p.
FORBES, T.D.A.; HODGSON, J. Comparative studies of the influence of sward conditions on the ingestive behaviour of cows and sheep. Grass and Forage Science, v.40, p.69-77, 1985.
FUNSTON, R. N. Fat supplementation and reproduction in beef females. Journal of Animal Science, v.82, p.154-161, 2004. (E. Suppl.). HILLESHEIM, A. Fatores que afetam o consumo e perdas de capim
elefante (Pennisetum purpureum SCHUM.) sob pastejo. 1987. 94f. Dissertação (Mestrado em Agronomia) - Escola Superior de Agricultura “Luiz de Queiroz”/Universidade de São Paulo, São Paulo.
HILLESHEIM, A. Manejo do gênero Pennisetum sob pastejo. In: SIMPÓSIO SOBRE MANEJO DE PASTAGEM, 9., 1998, Piracicaba. Anais... Piracicaba: Fundação de Estudos Agronômicos “Luiz de Queiroz”, 1998.
HODGSON, J. Grazing management. Science into practice. England: Longman Scientific & Technical, 1990. 203p.
KLINGMANN, D.L.; MILES, S.R.; MOTT, G.O. The cage method for determining consumption and yield of pasture herbage. Journal of Society Agronomy, v.35, p.739-746, 1943.
LICITRA, G.; HERNANDEZ, T.M.; VAN SOEST, P.J. Standardization of procedures for nitrogen fractionation of ruminant feeds. Animal Feed Science and Technology, v.57, p.347-358, 1996.
MORAES, A. Produtividade animal e dinâmica de uma pastagem de pangola (Digitaria decumbens Stent), azevém (Lolium
multiflorum Lam.) e trevo branco (Trifolium repens L.) submetida
a diferentes pressões de pastejo. 1991. 200f. Tese (Doutorado em Zootecnia) - Universidade Federal do Rio Grande do Sul, Porto Alegre.
MORENO, J.A. Clima do Rio Grande do Sul. Porto Alegre: Secretaria da Agricultura, 1961. 41p.
MOTT, G.O.; LUCAS, H.L. The design conduct and interpretation of grazing trials on cultivated and improved pastures. In: INTERNATIONAL GRASSLAND CONGRESS, 6., 1952, Pennsylvania. Proceedings… Pennsylvania: State College Press, 1952. p.1380-1395.
MOTT, G.O. Relationship of available forage and animal performance in tropical grazing systems. In: FORRAGE GRASSLAND CONFERENCE, 1984, Houston, Texas. Proceedings... Lexington: American Forage and Grassland Council, 1984. p.373-377.
NATIONAL RESEARCH COUNCIL - NRC. Nutrient requirements of beef cattle. 7.ed. Washington D.C.: 1996. 244p.
PILAU, A.; ROCHA, M.; RESTLE, J. et al. Recria de novilhas de corte com diferentes níveis de suplementação energética em pastagem de aveia preta e azevém. Revista Brasileira de Zootecnia, v.33, n.6, p.2104-2113, 2004.
PILAU, A.; ROCHA, M.G.; RESTLE, J. et al. Desenvolvimento de novilhas de corte recebendo ou não suplementação energética em pastagem com diferentes disponibilidades de forragem. Revista Brasileira de Zootecnia, v.34, n.5, p.1483-1492, 2005a.
PILAU, A.; ROCHA, M.G.; RESTLE, J. et al. Produção de forragem e produção animal em pastagem com duas disponibilidades de forragem associadas ou não à suplementação energética. Revista Brasileira de Zootecnia, v.34, n.4, p.1130-1137, 2005b.
PÖTTER, L. Uso de suplementos em pastagem cultivada de inverno para bezerras de corte. 2008. 128f. Tese (Doutorado em Zootecnia) - Universidade Federal de Santa Maria, Santa Maria.
ROCHA, M.G.; MONTAGNER, D.B.; SANTOS, D.T. et al. Parâmetros produtivos de uma pastagem temperada submetida a alternativas de utilização. Revista Brasileira de Zootecnia, v.33, n.6, p.1386-1395, 2004.
RODRIGUES, R.C.; COELHO, R.W.; REIS, J.C.L. Rendimento de forragem e composição química de cinco gramíneas de estação fria. Pelotas: EMBRAPA Clima Temperado, 2002. 3p. (Comunicado Técnico, 77)
ROSO, C.; RESTLE, J.; SOARES, A.B. et al. Produção e qualidade de forragem da mistura de gramíneas anuais de estação fria sob pastejo contínuo. Revista Brasileira de Zootecnia, v.28, n.3, p.459-467, 1999.
ROSO, C.; RESTLE, J.; SOARES, A.B. et al. Aveia preta, triticale e centeio em mistura com azevém. 1. Dinâmica, produção e qualidade de forragem. Revista Brasileira de Zootecnia, v.29, n.1, p.75-84, 2000.
RUSSEK, M. Semi-quantitative simulation of food intake control and weiht regulation. In: BOOTH, D.A. (Ed.) Hunger models. Computable theory of the feeding control. New York: Academic Press, 1978. p.195-226.
SANTOS, D.T.; ROCHA, M.G.; GENRO, T.C.M. et al. Suplementos energéticos para recria de novilhas de corte em pastagens anuais. Análise econômica. Revista Brasileira de Zootecnia, v.33, n.6, p.2359-2368, 2004 (supl. 3).
TAIZ, L.; ZEIGER, E. Fisiologia vegetal. 4.ed. Porto Alegre: Editora Artimed, 2009. 719p.
VAN SOEST, P.J.; ROBERTSON, J.B.; LEWIS, B.A. Methods for dietary fiber, neutral detergent fiber, and nonstarch polysaccharides in relation to animal nutrition. Journal of Dairy Science, v.74, p.3583-3597, 1991.
WEISS, W.P.; CONRAD, H.R.; ST. PIERRE, N.R. A theoretically-based model for predicting total digestible nutrient values of forages and concentrates. Animal Feed Science and Technology, v.39, p.95-110, 1992. WILM, H.G.; COSTELLO, D.F.; KLIPPLE, G.E. Estimating foragem