1
ALINE GOMES DA SILVA
SUPPLEMENTATION PLANS FOR DEVELOPMENT OF NELLORE HEIFERS, EFFECTS OF CREEP-FEEDING ON THE LACTATING DAM AND DIETARY STRATEGIES FOR NELLORE COWS IN THE LAST THIRD OF GESTATION
2016
Viçosa
Minas Gerais
–
Brasil
2016
1
ALINE GOMES DA SILVA
SUPPLEMENTATION PLANS FOR DEVELOPMENT OF NELLORE HEIFERS, EFFECTS OF CREEP-FEEDING ON THE LACTATING DAM AND DIETARY STRATEGIES FOR NELLORE COWS IN THE LAST THIRD OF GESTATION
2016
Viçosa
Minas Gerais
–
Brasil
2016
1
Ficha catalográfica preparada pela Biblioteca Central da Universidade Federal de Viçosa - Câmpus Viçosa
T
Silva, Aline Gomes da, 1988-
SS 86s Supplementation plans for development of Nellore heifers, effects 2016 of creep-feeding on the lactating dam and dietary strategies for Nellore
cows in the last third of gestation / Aline Gomes da Silva. — Viçosa, MG, 2016.
xi, 85f. : il. ; 29 cm.
Orientador: Mario Fonseca Paulino.
Tese (doutorado) - Universidade Federal de Viçosa. Inclui bibliografia.
1. Nutrição animal. 2. Bovino - Reprodução. I. Universidade Federal de Viçosa. Departamento de Zootecnia. Programa de Pós- graduação em Zootecnia. II. Título.
1
ALINE GOMES DA SILVA
SUPPLEMENTATION PLANS FOR DEVELOPMENT OF NELLORE HEIFERS, EFFECTS OF CREEP-FEEDING ON THE LACTATING DAM AND DIETARY STRATEGIES FOR NELLORE COWS IN THE LAST THIRD OF GESTATION
Approved: March 9, 2016.
_________________________________ Lincoln da Silva Amorim
_________________________________ Henrique Jorge Fernandes
_________________________________ Rilene Ferreira Diniz Valadares
_________________________________ Luciana Navajas Rennó
(Co-adviser)
_________________________________ Mário Fonseca Paulino
(Adviser)
i
iii
ACKNOWLEDGEMENTS
“Success means having the courage, the determination, and the will to become the person you
believe you were meant to be.” – Dr. George Sheehan
My doctorate would not have achieved a successful conclusion without the guidance of Dr. Mário Paulino, Dr. Rick Funston, Dr. Lincoln Amorin, Dra. Luciana Rennó and Dr. Edenio Detmann. I would like to thank to the Department of Animal Science of Universidade Federal de Viçosa for the support, Fapemig for project funding and CNPq and Capes for the scholarships. I am grateful to all the friends from ‘Gado de Corte’ who helped me to perform the experiments; a special acknowledgment to Felipe Moura, Marcos Manso, Luciano de Melo and Paulo Paiva, closely involved in this work.
My courage, determination and success should also be credit to my parents, Ely and Arlindo da Silva, my brother, Arlindo da Silva Filho, and the close friends who helped me overcome many struggles: Dani Oss, Lays Mariz, Ben and Whitney Tibbitts, Erick Darlisson, Lincoln Amorim, Henrique Fernandes, Laura Prados and Pedro Benedeti.
iv
BIOGRAPHY
Aline Gomes da Silva, daughter of Arlindo Dávila da Silva and Ely Gomes da Silva, was born in Muqui/ES-Brazil on November 6, 1988.
She started the undergrad in Animal Science at Universidade Federal de Viçosa in 2006 and became a Bachelor of Science in Animal Science in 2010. At the same year she started the M.S. program with major on ruminant nutrition and beef cattle production.
v
LIST OF CONTENTS
ABSTRACT ... vii
RESUMO... ix
INTRODUCTION ... 1
REFERENCES ... 4
MANUSCRIPT 1 - PERFORMANCE, ENDOCRINE, METABOLIC, AND REPRODUCTIVE RESPONSES OF NELLORE HEIFERS SUBMITTED TO DIFFERENT SUPPLEMENTATION LEVELS PRE AND POST-WEANING Abstract ... 8
Introduction ... 9
Material and methods... 10
Results ... 17
Discussion ... 21
References ... 26
MANUSCRIPT 2 - PERFORMANCE, MILK PRODUCTION, AND METABOLISM OF NELLORE COWS WHEN THEIR CALVES ARE SUBMITTED TO DIFFERENT SUPPLEMENTATION LEVELS Abstract ... 41
Introduction ... 41
Material and methods... 42
Results ... 46
Discussion ... 47
References ... 49
MANUSCRIPT 3 - SUPPLEMENT DELIVERY STRATEGIES FOR NELLORE COWS DURING THE LAST THIRD OF GESTATION Abstract ... 57
Introduction ... 58
Material and methods... 58
Results ... 66
Discussion ... 68
vi
ABSTRACT
SILVA, Aline Gomes da, D.Sc., Universidade Federal de Viçosa, March of 2016.
Supplementation plans for development of Nellore heifers, effects of creep-feeding on the lactating dam and dietary strategies for Nellore cows in the last third of gestation.
Adviser: Mário Fonseca Paulino. Co-Advisers: Edenio Detmann and Luciana Navajas Rennó.
vii
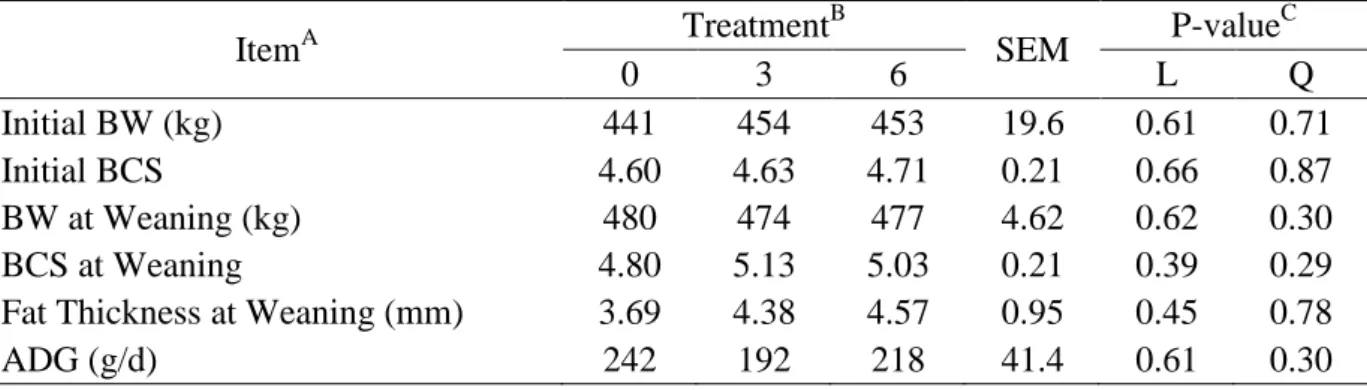
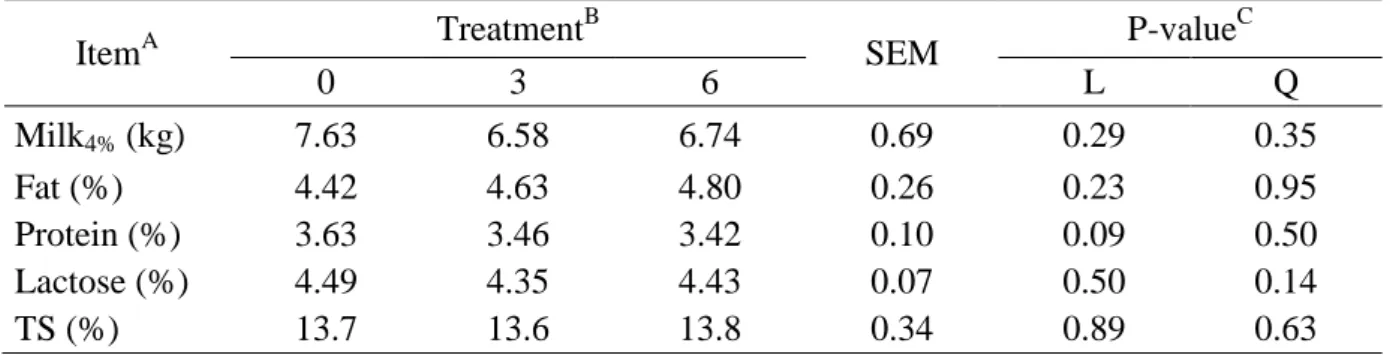
supplementation post-weaning on serum total protein concentration (P < 0.05). Supplementation increased albumin levels (P < 0.05) and animals receiving high amount of supplement had higher albumin levels as well (P < 0.05). There was no significant difference in globulins concentrations (P > 0.10). In summary, performance, endocrine, metabolic and reproductive variables evaluated were improved by level of supplement fed post-weaning, with heifers receiving 6 g/kg of BW having greater responses, independently of level received pre-weaning. The same fifty pairs used in the study described for the previous paper were used in the second paper to evaluate the effects of high and low supplementation levels for Nellore heifer calves on performance, milk production and metabolic prolife of their dams. The same treatments evaluated during the pre-weaning phase of the previous paper were also here evaluated: 0 – control, no supplement was fed to calves; 3 - calves received supplement in the amount of 3 g/kg of BW; 6 - calves received supplement in the amount of 6 g/kg of BW. There was no significant effect level of supplementation offered to offspring on cow BW, BCS and subcutaneous fat thickness (P > 0.10). Level of supplementation of heifer calves did not significantly affect milk production corrected to 4% of fat (P > 0.10). Fat, protein, lactose and total solids of the milk also did not differ among supplementation strategies (P > 0.10). Level of supplement fed to calves had no effect on cows’ glucose, total cholesterol, HDL, LDL, triglycerides, total protein and albumin levels (P > 0.10). In conclusion, creep-feeding calves in the amounts of 3 or 6 g/kg of BW daily has no major
viii
ix
RESUMO
SILVA, Aline Gomes da, D.Sc., Universidade Federal de Viçosa, março de 2016. Planos de
suplementação para desenvolvimento de novilhas Nelore, efeitos do creep-feeding sobre a matriz lactante e estratégias dietéticas para vacas Nelore no terço final de gestação.
Orientador: Mário Fonseca Paulino. Coorientadores: Edenio Detmann e Luciana Navajas Rennó.
x
xi
1
INTRODUCTION
Reproduction is the single most important economic component in any beef
production system (Willham, 1973). The low offtake rate observed in the Brazilian herd
reflects the low fertility rate of cows and the late puberty of replacement heifers.
Nellore breed represents 90% of the Brazilian beef herd. Although well adapted to
tropical conditions, Bos indicus heifers are older and have higher body weight at puberty
when compared to European breeds, even when raised in similar conditions (Rodrigues et al.,
2002).
Age at puberty varies depending on numerous factors including body weight, genetics,
nutrition, and management. Reproduction appears to be more sensitive than the growth axis in
relation to the availability of nutrients and a particular metabolic state may be required for the
onset of puberty (Steiner et al., 1983). Several hormones and metabolites have been studied as
nutritional signals to reproduction, for example, IGF-I, insulin, GH, leptin, glucose and others
(Steiner, 1987; Schillo et al., 1992).
Understanding how nutrition affects the central nervous system and modulates the
frequency of release of LH pulses from the pituitary gland has been researched for decades.
Fluctuations of the intermediary metabolism associated with changes in both body mass and
body fat may modulate the release of LH pulses (Schillo et al., 1992; Hiney et al., 1996).
Reserves of body fat have been related to the maintenance of the estrous cycle in cattle
(Imakawa et al., 1986; Richards et al., 1989) and may act as a marker of energy available for
reproductive activity (Hall et al., 1995). According to Frish (1976), there is a minimum body
fat at which puberty happens. Hall et al. (1995) found greater fat thickness, higher amount of
2
average daily gain (1 kg/d). On other hand, Bronson and Manning (1991) discussed that body
composition has little direct physiological or biological relationship with the beginning of the
estrous cycle.
The occurrence of puberty depends on the growth rate and development of the animal
to support the endocrine mechanisms that result in first ovulation (Maquivar and Day, 2009).
Studies have shown different results on when is the best time to accelerate growth in bovine
females. Some authors have reported the occurrence of early puberty with increased rate of
gain in early stages of development (Wiltbank et al., 1969; Arije and Wiltbank, 1971; Buskirk
et al., 1995; Patterson et al., 1992; Gasser et al., 2006; Cardoso et al., 2014;
Rodríguez-Sánchez et al., 2015), while others observed a reduction in age at puberty with higher weight
gain post-weaning (Buskirk et al., 1955; Hall et al., 1995; Lammers et al., 1999; Gojjan et al.,
2011; Barcellos et al., 2014; Rodríguez-Sánchez et al., 2015).
The early phase of development may be critical for the establishment of many
components of the reproductive axis, thus the possibility that pre-weaning nutritional status
have more influence on puberty is consistent with the dynamic changes of this period.
However, establishing a phase-specific target ADG is not so simple when the existence of
complex interactions between genotype and environment variability are considered.
The biological foundation of beef systems is the cow-calf pair, understanding how
nutritional strategies applied to offspring can impact dams’ performance is of paramount
importance. It is estimated that 50% of the cows in extensive beef systems do not receive
adequate nutritional management and that is one of the major reasons for low fertility rates in
tropical herds (Madureira et al., 2014). Body condition score at parturition and weaning can
3
that affect milk production, such as creep-feeding, can impact cows’ requirements and
consequently performance.
Some authors have found that creep-feeding can reduce milk production and
consequently improve cows’ performance (Kress et al., 1990; Fordyce et al., 1996; Henriques
et al., 2011) while several others have found that supplementing calves have no effect on their
mothers’ performance (Valente el al., 2012; Valente et al., 2013; Moriel and Arthington,
2013).
The use of protein-energetic supplement for cows in the last third of gestation is a
strategy that can be adopted in order to accumulate energy in body tissues and lessen the post
calving negative energy balance. According to Baruselli et al. (2004) inadequate nutritional
status at calving is the main factor limiting adequate response to synchronization protocols.
Meeting nutritional requirements for pregnant cows is important to maintain an adequate
supply of nutrients for development of the fetus and to ensure appropriate cow’s body
condition score at calving. In this context, finding the best strategy of supplementation for
pregnant cows is necessary to reduce feeding costs related to gas, labor and machinery,
without compromising performance.
With the information above in mind, studies were conducted aiming to:
1- Evaluate the effects of high and low supplementation levels in the pre and
post-weaning phases of Nellore heifers grazing tropical pastures on performance,
endocrine and metabolic responses and characteristics related to reproduction;
2- Evaluate the effects of high and low supplementation levels for Nellore heifer calves
4
3- Evaluate the effect of supplement delivery strategies for pregnant beef cows on the
last third of gestation.
REFERENCES
Arije GF, Wiltbank JN (1971) Age and weight at puberty in Hereford heifers. Journal of
Animal Science 33, 401-406.
Barcellos JOJ, Pereira GR, Dias EA, McManus C, Canellas L, Bernardi ML, Tarouco A,
Prates ER (2014) Higher feeding diets effects on age and liveweight gain at puberty in
crossbred Nelore × Hereford heifers. Tropical Animal Health and Production 46, 953-960.
Baruselli PS, Reis EL, Marques MO, Nasser LF, Bó GA (2004) The use of hormonal
treatments to improve reproductive performance of anestrous beef cattle in tropical climates.
Animal Reproduction Science 120, 479-486.
Bronson FH, Manning JM (1991) The energetic regulation of ovulation: A realistic role for
body fat. Biology of Reproduction 44, 945-950.
Buskirk DD, Faulkner DB, Ireland FA (1995) Increased postweaning gain of beef reifers
enhances fertility and milk production. Journal of Animal Science 73, 937-946.
Cardoso RC, Alves BRC, Prezotto LD, Thorson JF, Tedeschi LO, Keisler DH (2014) Use of a
stair-step compensatory gain nutritional regimen to program the onset of puberty in beef
heifers. Journal of Animal Science 92, 2942-2949.
Fordyce J, Cooper NJ, Kendall IE (1996) Creep feeding and prepartum supplementation
effects on growth and fertility of Brahman-cross cattle in the dry tropics, Australian Journal
5
Frisch RE (1984) Body fat, puberty and fertility. Biological Reviews 59, 161-188.
Gasser CL, Behlke EJ, Grum DE, Day ML (2006) Effect of timing of feeding a
high-concentrate diet on growth and attainment of puberty in early-weaned heifers. Journal of
Animal Science 84, 3118-3122.
Gojjam Y, Tolera A, Mesfin R (2011) Management options to accelerate growth rate and
reduce age at first calving in Friesian–Boran crossbred heifers. Tropical Animal Health and
Production 43, 393-399.
Hall JB, Staigmiller RB, Bellows RA, Short RE, Moseley WM, Bellows SE (1995) Body
composition and metabolic profiles associated with puberty in beef heifers. Journal of Animal
Science 73, 3409-3420.
Henriques LT, Valadares Filho SC, Paulino MF, Paulino PV, Detmann E, Valadares RFD
(2011) Avaliação de modelos não-lineares e da relação do consumo voluntário de vacas
primíparas e de bezerros com a curva de lactação de vacas Nelore. Revista Brasileira de
Zootecnia 40, 1287-1295.
Hiney JK, Srivastava V, Nyberg CL, Ojeda SR, Dees WL (1996) Insulin-like growth factor of
peripheral origin acts centrally to accelerate the initiation of female puberty. Endocrinology
137, 3717-3728.
Imakawa K, Day ML, Zalesky DD, Garcia-Winder M, Kittok RJ, Kinder JE (1986) Influence
of dietary-induced weight change on serum luteinizing hormone, estrogen and progesterone in
the bovine female. Biology of Reproduction 35, 377-384.
Kress DD, Doornbos DE, Anderson DC (1990) Performance of crosses among Hereford,
6
production and reproduction of three to eight year old dams, Journal of Animal Science 68,
1910-1921.
Lammers BP, Heinrichs AJ, Kensinger RS (1999) The effects of accelerated growth rates and
estrogen implants in prepubertal holstein heifers on estimates of mammary development and
subsequent reproduction and milk production. Jounal of Dairy Science 82, 1753-1764.
Madureira ED, Maturana Filho M, Lemes KM, Silva JCB, Santini T (2014) Análise crítica de
fatores que interferem na fertilidade de vacas zebuínas. In ‘Proceedings of 9th Symposium of
Beef Cattle Production’. pp. 367-400 (Departamento de Zootecnia – UFV: Viçosa)
Maquivar M, Day ML (2009) Regulação nutricional da puberdade In: ‘Curso Novos
Enfoques na Produção e Reprodução de Bovinos’. pp. 143-158 (Unesp: Uberlândia)
Moriel P, Arthington JD (2013) Effects of trace mineral-fortifi ed, limit-fed preweaning
supplements on performance of pre- and postweaned beef calves. Journal of Animal Science
91, 1371-1380.
Patterson DJ, Perry RC, Kiracof GH, Bellows RA, Staigmiller RB, Corah LR (1992)
Management considerations in heifer development and puberty. Journal of Animal Science
70, 4018-4035.
Richards MW, Wettemann RP, Schoenemann HM (1989) Nutritional anestrus in beef cows:
Body weight change, body condition, luteinizing hormone in serum and ovarian activity.
Journal of Animal Science 67, 1520-1526.
Rodrigues HD, Kinder JE, Fitzpatrick LA (2002) Estradiol regulation of luteinizing hormone
secretion in heifers of two breed types that reach puberty at different ages. Biology of
7
Rodríguez-Sánchez JA, Sanz A, Tamanini C, Casasús I (2015) Metabolic, endocrine, and
reproductive responses of beef heifers submitted to different growth strategies during the
lactation and post-weaning periods. Journal of Animal Science 93, 3871-3885.
Schillo KK, Hall JB, Hileman SM (1992) Effects of nutrition and season on the onset of
puberty in the beef heifer. Journal of Animal Science 70, 3994-4005.
Steiner RA (1987) Nutritional and metabolic factors in the regulation of reproductive
hormone secretion in the primate. The Proceedings of the Nutrition Society 46, 159-175.
Steiner RA, Cameron JL, McNeil TH, Cliffton DK, Bremmer WJ (1983) Metabolic signals
for the onset of puberty. In: ‘Neuroendocrine Aspects of Reproduction’. (Ed RL Norman)
pp.183-227 (Academic Press: New York NY).
Valente EEL, Paulino MF, Detmann E, Valadares Filho SC, Barros LV, Cabral CHA, da
Silva AG, Duarte MS (2012) Strategies of supplementation of female pre-weaning calves and
nutrition parameters of beef cows on tropical pasture. Tropical Animal Health and Production
44, 1803-1811.
Valente EEL, Paulino MF, Detmann E, Valadares Filho SC, Barros LV, de Paula NF, Lopes
SA, de Almeida DM, Martins LS (2013) Effect of calves’ supplementation on performance,
nutritional and behavioral characteristics of their dams. Tropical Animal Health and
Production 45, 487-495.
Willham RL (1973) Beef breeding programs. In: ‘Beef Cattle Science Handbook’. (Ed FH
Baker) pp.194-201. (Westview Press: Boulder CO).
Wiltbank JN, Kasson CW, Ingalls JE (1969) Puberty in crossbred and straightbred beef
8
Performance, endocrine, metabolic, and reproductive responses of Nellore heifers
submitted to different supplementation levels pre and post-weaning
Abstract. Literature presents mixed results on when is the best time to accelerate growth in
bovine females in order to induce precocious puberty. The present study was conducted to
evaluate the effects of high and low supplementation levels pre and post-weaning on
performance, endocrine, metabolic and reproductive responses of Nellore heifers. Fifty
Nellore heifers with 131.8 ± 9.9 kg average body weight (BW) and 138 ± 19 d of age were
supplemented from 4 to 14 months. Heifers were distributed in five supplementation plans:
HH – animals received 6 g/kg of BW pre and post-weaning; HL – animals received 6 g/kg of
BW of supplement pre-weaning and 3 g/kg of BW post-weaning; LH – animals received 3
g/kg of BW pre-weaning and 6 g/kg of BW post-weaning; LL – animals received 3 g/kg of
BW pre and post-weaning; and CC – control, no supplement was fed. Interaction between
level of supplementation offered in pre and post-weaning phases were not significant for any
performance variables evaluated (P > 0.10). Level of supplement fed pre-weaning did not
affect any of the performance variables evaluated at the end of the experiment (P > 0.10).
There was a significant effect of supplementation and level of supplementation fed
post-weaning on average daily gain (ADG) and final BW (P < 0.05). Overall ADG was also
affected only by supplementation and level of supplement fed post-weaning (P < 0.05) with
animals receiving 6 g/kg of BW post-weaning gaining more. Follicular diameter was greater
for animals receiving 6 g/kg of BW post-weaning (P < 0.05). Pre-weaning, growth hormone
(GH) tended to be higher for heifers receiving 6 g/kg of BW (P < 0.10) and GH was lower for
heifers receiving supplement post-weaning (P < 0.05). No difference in insulin levels was
9
affected only by level of supplementation fed post-weaning (P < 0.05). During the
pre-weaning phase, most metabolites were not affected by treatment (P > 0.10). There was no
difference in total cholesterol, HDL and LDL levels among treatments pre-weaning (P >
0.10). All metabolites related to fat metabolism reduced post-weaning but only LDL was
significantly different among treatments (P < 0.10). There was a positive effect of level of
supplementation post-weaning on serum total protein concentration (P < 0.05).
Supplementation increased albumin levels (P < 0.05) and animals receiving high amount of
supplement had higher albumin levels as well (P < 0.05). There was no significant difference
in globulins concentrations (P > 0.10). In summary, performance, endocrine, metabolic and
reproductive variables evaluated in the current study were improved by level of supplement
fed post-weaning, heifers receiving 6 g/kg of BW post-weaning had greater responses,
independently of level received during the pre-weaning phase.
Additional keywords: body measures, GH, insulin, metabolism
Introduction
Nellore animals represent approximately 90% of the Brazilian beef herd. Although well
adapted to tropical conditions, Bos indicus heifers are older and heavier at puberty when
compared to European breeds, even when raised in similar conditions (Rodrigues et al.,
2002). Age at puberty has an important impact on production, economic and reproductive
efficiency of the future dam and varies depending on numerous factors, including body
weight, genetics, nutrition, and management.
The occurrence of puberty depends on the growth rate and development of the animal
to support the endocrine mechanisms that result in first ovulation (Maquivar & Day, 2009).
10
females. Some authors have reported the occurrence of early puberty with increased rate of
gain in early stages of development (Wiltbank et al., 1969; Arije and Wiltbank, 1971; Buskirk
et al., 1995; Patterson et al., 1992; Gasser et al., 2006; Cardoso et al., 2014;
Rodríguez-Sánchez et al., 2015), while others observed a reduction in age at puberty with higher weight
gain post-weaning (Buskirk et al., 1955; Hall et al., 1995; Lammers et al., 1999; Gojjan et al.,
2011; Barcellos et al., 2014; Rodríguez-Sánchez et al., 2015).
However, a target average daily gain (ADG) should not be established based solely on
animal’s physiological response, the existence of complex interactions between genotype and
environment, seasonality in forage production and economic efficiency might also be
considered when planning a nutritional strategy to develop heifers.
This study was conducted to evaluate the effects of high and low supplementation
levels pre- and post-weaning on performance, endocrine and metabolic responses and
characteristics related to reproduction of Nellore heifers.
Material and Methods
All animal care and handling procedures were approved by the Animal Care and Use
Committee of the Universidade Federal de Viçosa, Brazil (protocol CEUAP-UFV 0011).
Experimental Design and Treatments
The experiment was conducted at the facilities of the Department of Animal Science –
Universidade Federal de Viçosa, Brazil, from February to November of 2013. Fifty Nellore
heifers with 131.8 ± 9.9 kg average body weight (BW) and 138 ± 19 d of age were used (10
11
The experimental design was completely randomized in a 2 × 2 + 1 factorial design
with two levels of supplementation, 6 or 3 g/kg of BW – high (H) and low (L), respectively –
in two phases, pre and post-weaning. In this way, heifers were distributed in five
supplementation plans: HH – animals received 6 g/kg of BW pre and post-weaning; HL –
animals received 6 g/kg of BW of supplement pre-weaning and 3 g/kg of BW post-weaning;
LH – animals received 3 g/kg of BW pre-weaning and 6 g/kg of BW post-weaning; LL –
animals received 3 g/kg of BW pre and post-weaning; and CC – control, no supplement was
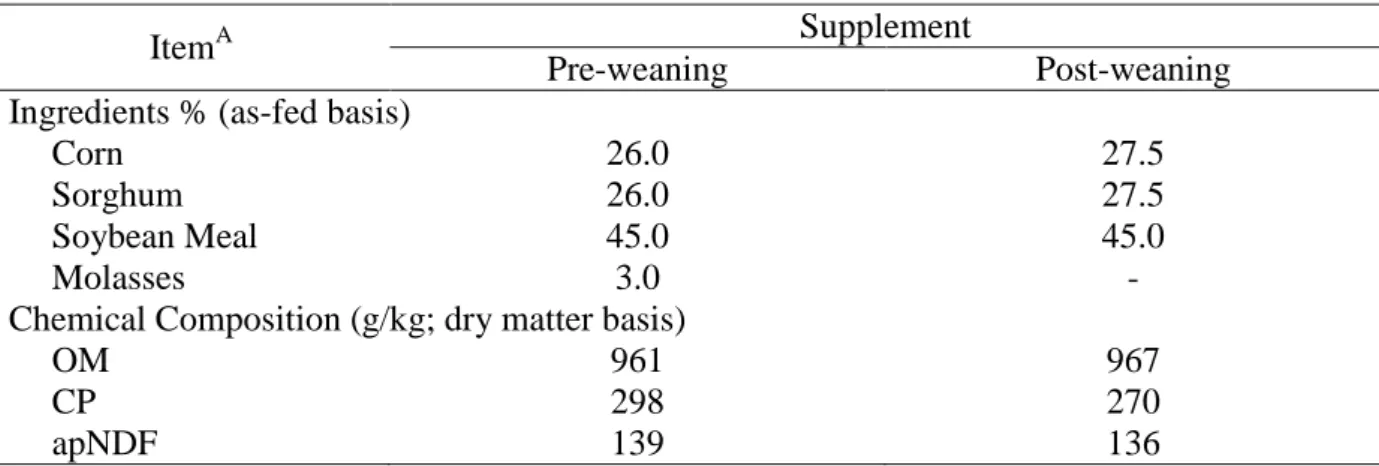
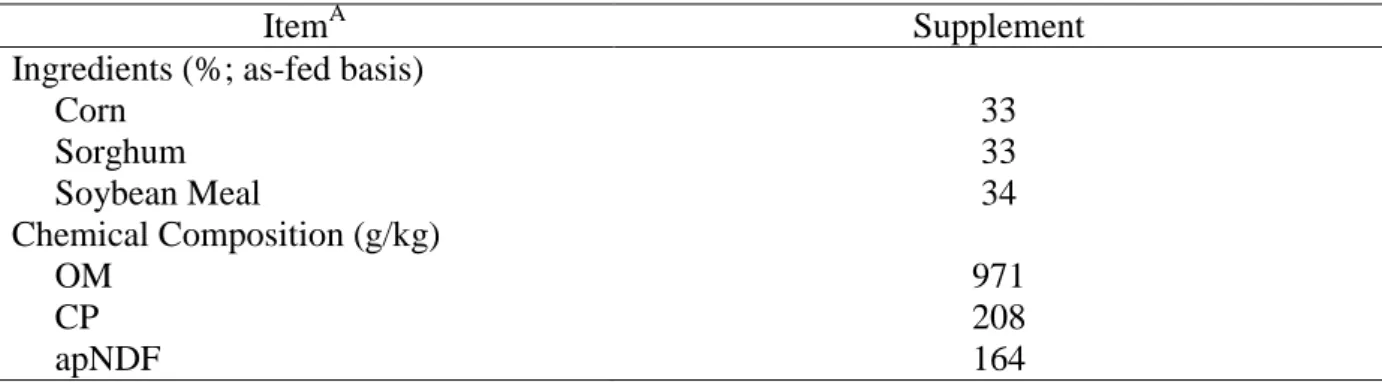
fed. The supplement was composed of corn, sorghum and soybean meal and formulated to
contain approximately 25% crude protein (CP) as presented in Table 1. Animals from all
treatments had unlimited access to mineral salt throughout the experiment. The mineral salt
was composed of 8.7% calcium, 9.0% phosphor, 18.7% sodium, 9.0% sulfur, 2400 mg/kg of
zinc, 800 mg/kg of copper, 1600 mg/kg of manganese, 40.0 mg/kg of iodine, 8.00 mg/kg of
cobalt, 8.16 mg/kg of selenium.
The pre-weaning phase lasted 120 d divided into three experimental periods of 40 d
and the post-weaning phase lasted 180 d divided into five experimental periods of 36 d.
In the pre-weaning phase, heifer calves with their respective dams were placed in an
experimental area of Brachiaria decumbens, divided in 5 paddocks of 7.0 ha each with free
access to water and creep-feeders. Heifer calves were weaned at 240 d of age. After weaned,
calves were transferred to another area of Brachiaria decumbens and distributed in five
paddocks of 2.5 ha each with water dispensers and feeders.
Performance, Body Measures and Carcass Characteristics
After 14h of solids fasting, animals were weighted in the beginning and in the end of each
12
Body measures (BM) were taken at weaning and end of the experiment. The rump
width (the maximum distance between iliac tuberosities), rump length (from the ischial
tuberosity to the iliac tuberosity), rib depth (vertically from the highest point over the
scapulae to the end point of the rib), body length (from the anterior point of the scapulae
vertically to the posterior midline), height at withers (from the highest point of the shoulder
blade to the ground) and rump height (from the iliac tuberosity vertically to the ground) were
recorded with a height stick. The heart girth (the body circumference immediately posterior to
the front legs) was measured with a flexible tape.
At weaning and at the end of the experiment, Longissimus muscle area (LMA) and fat
thickness over the Longissimus muscle were measured by ultrasound scan (Aloka SSD 500;
3.5 MHz linear probe) of the area between the 13th-14th ribs. Vegetable oil was used to
ensure adequate acoustic contact.
Follicle Diameter
At the end of the experiment, an ultrasound Aloka SSD500 with trans-rectal transducer of
5MHz was used to measure the diameter of the dominant follicle.
Forage Analysis and Intake Trial
Pasture chemical composition was assessed by samples hand-plucked every 2 weeks. In the
middle of every experimental period, a second pasture sample was also collected to estimate
forage potentially digestible dry matter (pdDM) as proposed by Paulino et al. (2008), 4
subsamples were randomly collected in each plot by cutting it close to the ground using a
metal square (0.5 × 0.5 m). Samples were weighed and oven dried at 60ºC for 72 h. After that,
mill grounded to pass through a 2 mm screen for indigestible neutral detergent fiber (iNDF)
13
through a 1 mm screen for analyses of dry matter (DM), ash, crude protein (CP) and neutral
detergent fiber (NDF).
A 9 d intake trial was carried out in each phase. Chromium oxide (Cr2O3) was used as
external maker to estimate fecal excretion (in the amount of 10 and 15 g per animal pre and
post-weaning, respectively). The chromium oxide was packed in paper cartridges and
delivered via esophagus with a metal probe once daily, at 10 a.m. Individual intake of
supplement was estimated using titanium dioxide (TiO2) mixed in the supplement at the
proportion of 10 g/kg of supplement. Finally, iNDF was used as internal marker to estimate
DM intake. Six days were allowed for stabilization of markers excretion, after that, fecal
samples were collected at 3 p.m. on the 7th d, at 11 a.m. on the 8th d, and at 7 a.m. on the 9th
d of the intake trial.
Feces samples were collected immediately after defecation or directly into the rectum
of animals at amounts of approximately 200 g, identified, dried (60°C/72 h) and mill
grounded to pass through a 2 mm screen for indigestible neutral detergent fiber (iNDF)
analysis (Casali et al., 2008). A sub portion of 20 g of each sample was grounded to pass
through a 1 mm screen for analyses of dry matter (DM), ash, crude protein (CP) and neutral
detergent fiber (NDF) as described for forage samples. Grounded samples were
proportionally sub-sampled to a pooled 3 d sample per animal per phase.
Milk intake by calves was estimated on d 20, 60 and 100 of the experimental period
(pre-weaning phase), the milk production of the three sampling days were averaged by cow.
Aiming to empty the udder, calves were separated from their mothers from 3 p.m. to 5:45
p.m, when they were reunited to the dams and allowed to suckle. At 6 p.m. calves were again
separated from their dams until the next morning. At 6 a.m. of the next day, cows were
14
in the mammary vein and the produced milk was weighted. The milking was planned to do
not occur time longer than 2 h from the first and the last cow milked. The exact time when
each cow was milked was recorded and the milk production was converted into a 24h
production. The milk produced was corrected to 4% of fat (Milk4%) calculated by the
following equation (NRC, 2001):
Milk4% (kg) = 0.4 × (milk production) + [15 × (fat production × milk production/100)]
Samples of forage, feces and supplement were analyzed following procedures
described by Detmann et al. (2012) for DM (index INCT-CA G-003/1), CP (index INCT-CA
N-001/1), ash (index INCT-CA M-001/1), NDF (index INCT-CA F-002/1) corrected for ash
residue (index INCT-CA M-002/1) and residual nitrogen compounds (index INCT-CA
N-004/1), the iNDF (index INCT-CA F-009/1) was evaluated using F57 (Ankon®) bags
incubated in rumen by 288 h. Fecal samples were also analyzed for levels of chromium by
atomic absorption spectrophotometry (index INCT-CA M-005/1) and titanium dioxide by
colorimetry (index INCT-CA M-007/1) as recommended by Detmann et al. (2012). Milk was
analyzed for protein, fat, lactose, and total solids content, using spectroscopy (Foss
MilkoScan FT120, Hillerød, Denmark).
The potentially digestible dry matter (pdDM) was estimated using the pasture sample
collected in each period using a metal square as described previously, using the following
equation (Paulino et al., 2008):
pdDM (%; dry matter basis) = 0.98 × (100 – apNDF) + (apNDF – iNDF)
Where: 0.98 is the true digestibility coefficient of intracellular content; apNDF is
forage content of neutral detergent fiber corrected for residual ash and nitrogen; iNDF is
15
Fecal excretion (FE) was estimated by ratio of chromium oxide and its concentration
in the feces. The estimate of individual supplement intake (SI) was obtained by using the
following equation:
SI (kg/d) = (FE × TCF)/TCS
Where: SI is the dry matter supplement intake (kg/d); FE is the fecal excretion (kg/d);
TCF is the concentration of titanium dioxide in the feces (kg/kg); TCS is the concentration of
titanium dioxide in the supplement (kg/kg).
Dry matter intake (DMI) was estimated by using the iNDF as an internal marker and
calculated by the following equation:
DMI (kg/d) = [((FE × iNDF feces) – iNDF supplement) ÷ iNDF forage] + SI + MI
Where: FE is the fecal excretion (kg/d); iNDF feces is the concentration of iNDF in
the feces (kg/kg); iNDF supplement is the iNDF in the supplement (kg); iNDF forage is the
concentration of iNDF in forage (kg/kg); SI is the supplement intake (kg/d) and MI is the
milk intake corrected to 4% of fat (kg/d).
Blood Sampling and Analysis
Blood samples were collected each 40 d during the pre-weaning phase and each 36 d in the
post-weaning phase, at 8:00 am, to measure levels of growth hormone (GH), insulin, glucose,
total cholesterol, high density lipoproteins (HDL), low density lipoproteins (LDL),
triglycerides, total protein, albumin, globulins and urea. Two samples of each heifer were
collected from the jugular vein with vacuum tubes. One of the samples was collected in tubes
with clot activator and gel for serum separation (BD Vacuntainer® SST II Plus, São Paulo,
16
albumin and urea. The sample collected in the second tube, with EDTA and sodium fluoride
(BD Vacutainer® Fluoreto/EDTA, São Paulo, Brazil), was used for glucose analysis. After
collected, samples were centrifuged at 3600 × g for 20 min, serum and plasma were
immediately frozen at -20°C in triplicates until further analysis.
Growth hormone and insulin were analyzed by chemiluminescent method using
Access Ultrasensitive hGH Reagent (Ref. Number 33580, Beckman Coulter®, Brea, USA)
and Access Ultrasensitive Insulin Reagent (Ref. Number 33410, Beckman Coulter®, Brea,
USA) in the Access 2 Immunoassay System (Beckman Coulter Inc., Brea, USA). Glucose
(Ref. Number K082, Bioclin® Quibasa, Belo Horizonte, Brazil), total cholesterol (Ref.
Number K083, Bioclin® Quibasa, Belo Horizonte, Brazil), HDL (Ref. Number K071,
Bioclin® Quibasa, Belo Horizonte, Brazil), triglycerides (Ref. Number K117, Bioclin®
Quibasa, Belo Horizonte, Brazil), and urea (Ref. Number K056, Bioclin® Quibasa, Belo
Horizonte, Brazil) were quantified by enzymatic-colorimetric method and total protein (Ref.
Number K031, Bioclin® Quibasa, Belo Horizonte, Brazil) and albumin (Ref. Number K040,
Bioclin® Quibasa, Belo Horizonte, Brazil) by colorimetric method. The LDL levels were
estimated according to the Friedewald equation (Tietz, 1986). Globulins were calculated
subtracting the albumin quantified from the total protein level. Serum urea N (SUN) was
estimated as 46.67% of total serum urea. Metabolites were analyzed in accordance with
manufacturer’s instructions in an automatic biochemistry analyzer (Mindray BS200E,
Shenzhen, China). Results were averaged by phase, resulting in the serum and plasma
concentrations of hormones and metabolites for each animal per phase (pre and
post-weaning).
On the last day of experiment, a blood sample was taken from the jugular vein, using
17
Plus, São Paulo, Brazil). Immediately after collection the samples were centrifuged at 3600 ×
g for 20 min, the serum was frozen at -20°C and subsequently analyzed for progesterone
levels by chemiluminescent method using Access Progesterone Reagent (Ref. Number 33550,
Beckman Coulter®, Brea, USA) in the Access 2 Immunoassay System (Beckman Coulter Inc.,
Brea, USA).
Statistical Analysis
Statistical analyzes were performed using PROC GLIMMIX in SAS 9.4. Treatments were
compared using orthogonal contrasts (Steel et al., 1997). Within the pre-weaning, phase linear
and quadratic effects of level were evaluated. For the whole experimental period, contrasts
were constructed in order to evaluate the effects of supplementation (CC vs HH, HL, LH and
LL) and level of supplementation fed pre-weaning (HH and HL vs LH and LL) and
post-weaning (HH and LH vs HL and LL). Initial body weight was used as covariate for
performance data analysis. Significant difference was considered at P < 0.05 and tendency at
0.05 < P < 0.10, interaction was considered significant when P < 0.10.
Results
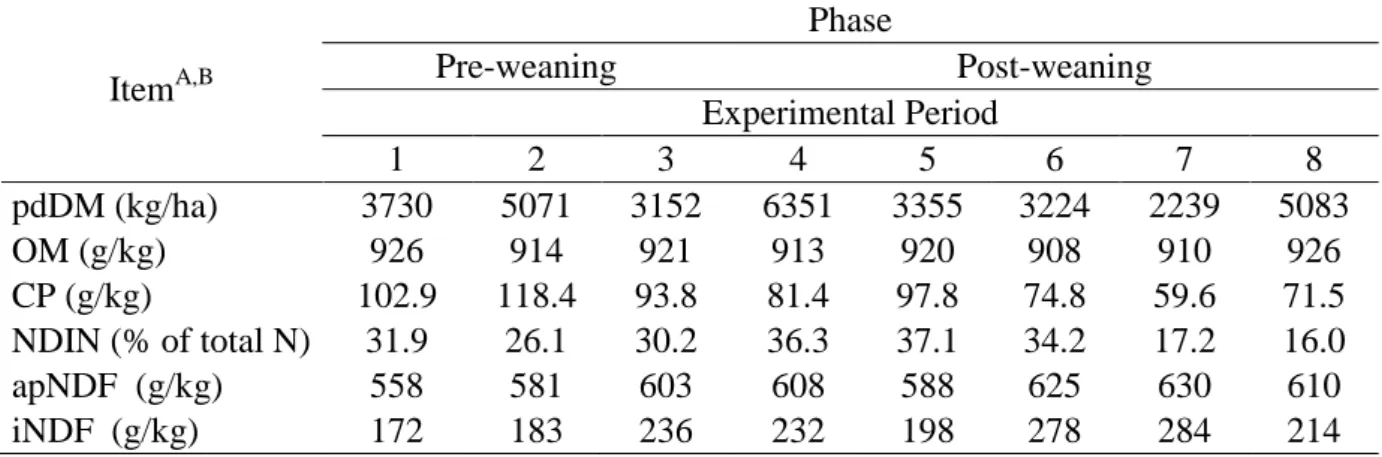
Potentially digestible forage mass and CP content of forage throughout the experiment are
presented in Table 2. Average pdDM and CP content in forage were 3984 kg/ha and 105 g/kg
in pre-weaning phase and 4070 kg/ha and 77 g/kg in post-weaning phase.
No significant difference was observed in BW at weaning, ADG, and LMA according
to supplementation level offered pre-weaning (Table 3; P > 0.10). Heifer calves were weaned
with average of 219 kg of BW across treatments. Despite no difference in BW and ADG,
there was a positive linear effect of supplementation level on fat thickness at weaning (P <
18
Iteration between L-Pre-weaning × L-Post-weaning was not significant for any
performance variables evaluated (P > 0.10). Level of supplement fed pre-weaning had no
significant effect afterwards, and did not influence any of the performance variables evaluated
at the end of the experiment (P > 0.10). There was a significant effect of supplementation and
level of supplementation offered post-weaning on post-weaning ADG (P < 0.01).
Post-weaning ADG was 410 g/d for heifers receiving high level of supplementation, 315 g/d for
heifer receiving low level and 157 g/d for control heifers. Overall ADG was also affected
only by supplementation and level of supplementation offered post-weaning (P < 0.01), with
animals receiving 6 g/kg of BW after weaning gaining more. The average BW at the
beginning of the breeding season (at the ending of the experiment) differed among strategies
(P < 0.01) and was 297 kg for heifers in supplementation strategies HH and LH, 275 for
heifers in HL and LL and 244 kg for control (CC) heifers.
At the end of the experiment, supplemented animals had higher LMA (P < 0.05).
Animals receiving 6 g/kg of supplement also had higher fat thickness (P < 0.01), 3.43 mm
and 2.98 mm for HH and LH heifers, respectively, while HL and LL heifers had fat thickness
comparable to the control heifers (2.54 for HL and 2.27 for LL vs. 2.52 for control). Despite a
linear effect of level of supplementation on fat thickness at weaning, supplementation level
offered in the previous phase (pre-weaning) did not affect fat thickness at the end of the
experiment (P > 0.10).
Follicular diameter was greater for animals receiving 6 g/kg of BW post-weaning (P <
0.01) and although only two animals have reached puberty before the breeding season, both
were receiving high level of supplementation in post-weaning, one from HH and one from
LH (pubertal status evaluated via ultrasonography, data no presented). No difference in
19
Body measures (BM) of heifers at weaning and beginning of breeding season are
presented in Table 4. Height at withers and rump height were not different among treatments
at weaning or breeding season (P > 0.05). At weaning, only rib depth and body length were
linearly and positively affected by level of supplementation (P < 0.05). At the end of the
experiment important BM were improved by supplementation and level of supplementation
offered post-weaning (P < 0.05). Rump width, rump length, rib depth, body length, heart
girth, and BW:height ratio were greater for supplemented animals. Heart girth tended to be
higher for animals receiving high level of supplementation post-weaning (P = 0.09) and
BW:height ratio was also greater for animals receiving high level of supplementation
post-weaning (P < 0.05).
Supplementation linearly increased intake of DM, OM and CP (Table 5; P < 0.05) in
the pre-weaning phase. Compared to control, supplemented animals had higher intake of DM,
OM and CP post-weaning, (P < 0.05), level of supplementation positively affected intake of
DM, OM and CP post-weaning as well (P < 0.01).
Endocrine and metabolic profile of heifers in pre and post-weaning phases are
presented in Table 6. Pre-weaning, growth hormone tended to be higher for heifers receiving
6 g/kg of BW (P = 0.06). Post-weaning, growth hormone was lower for heifers receiving
supplement (30.2 ng/mL) compared to control heifers (35.2 ng/mL; P < 0.05) and tended to
be affected by level of supplement fed previously, in the pre-weaning phase, with heifers that
received high level pre-weaning having higher serum concentrations of GH (P = 0.09).
No difference in insulin levels was observed pre-weaning (P > 0.10). Insulin level
post-weaning was affected only by level of supplementation fed post-weaning (P < 0.01),
animals receiving high level of supplement post-weaning had greater insulin serum
20
Pre-weaning, most metabolites were not affected by treatment (P > 0.10). Exception
was SUN, that linearly increased with level of supplement offered (P < 0.01), and
triglycerides that tended to be higher for control heifers (P < 0.10).
Glucose level was not different among treatments pre-weaning (P > 0.10) and reduced
for all treatments post-weaning, when animals receiving supplementation tended to have
higher levels of glucose compared to control animals, 70 vs. 65 for supplemented and not
supplemented, respectively (P = 0.06).
There was no difference in total cholesterol, HDL and LDL levels among treatments
pre-weaning (P > 0.10). All metabolites related to fat metabolism (cholesterol, HDL, LDL
and triglycerides) reduced post-weaning, but only LDL was significantly different among
treatments (supplementation effect; P < 0.01), with control heifers (CC) having the highest
LDL levels (37 mg/dL).
Total protein in serum was not different among treatments pre-weaning (P > 0.10) but
there was a positive effect of level of supplementation offered post-weaning on total protein
concentrations (P < 0.05). Supplementation increased albumin levels (P < 0.05) and animals
receiving high amount of supplement had higher albumin levels as well (P < 0.05). The
difference observed in total protein in serum was due to albumin, whereas no significant
difference was observed in globulins concentrations (P > 0.10).
Concentrations of SUN were higher for supplemented heifers post-weaning (P < 0.01)
and were also affected by level of supplement received pre-weaning (P < 0.05), heifers that
have received high level of supplementation pre-weaning had higher levels of SUN
21
offered post-weaning also affected SUN levels (P < 0.01), HH and LH heifers had average
15.6 mg/dL of SUN vs 12.8 mg/dL in HL and LL heifers.
Discussion
Important performance, endocrine and metabolic variables evaluated in the present study
were affected by supplementation level offered post-weaning, with level of supplementation
offered pre-weaning having low or no effect on animals’ performance at weaning and at the
end of the experiment, corresponding to the breeding season.
Roberts et al. (2009) demonstrated that puberty was much more affected by variation
in rate of growth up to approximately 8 months of age than subsequent growth up to the start
of breeding. Together, results from Gasser et al. (2006) and Cardoso et al. (2014) indicate that
during early calfhood development, plausibly between 4 and 6.5 months of age, heifers are
more sensitive to nutritional programming that can accelerate puberty. Most of studies
proving this positive effect of early nutrition on heifer development were conducted using
level of feeding in order to change ADG, most of them using heifers weaned early (Gasser et
al., 2006; Cardoso et al., 2014) or in controlled pre-weaning regimen (Rodríguez-Sánchez et
al., 2015).
Results from those studies raised our hypothesis that creep-feeding heifers
accompanied of their dams with high level of supplementation could improve heifer
performance. This hypothesis was refuted in the present study; creep-feeding heifer calves in
ad libitum suckling was not efficient to improve their performance at weaning and had no
effect on performance variables evaluated later in their lives, in the post-weaning phase.
There is an inverse association between genetic potential for milk production and age
22
especially genetics and milk supply, contribute to the influence of pre-weaning growth rate on
subsequent attainment of puberty. As such, it would not be advantageous to implement
management strategies to increase pre-weaning growth in attempt to increase proportion
pubertal as this would result in retention of more heifers with less desirable genetic
characteristics for growth and reproduction (Roberts et al., unpublished data).
When forages CP content is less than about 70 g/kg, feeding a protein supplement
generally improves animal performance by improving rumen microbial activity, forage
intake, and digestibility. As we can observe in Table 2, average CP content of forage during
the pre-weaning phase was 105 g/kg of forage and combined with milk ingested ad libitum
was probably enough to attend heifers requirement of CP for maintenance and genetic
programed growth in all treatments. The linear increase in intake of DM, OM and CP
pre-weaning reflected in more fat being deposited and increased fat thickness at pre-weaning instead
of muscle deposition, as no difference in LMA or ADG was observed at weaning.
Optimal SUN concentrations in beef heifers range between 11 and 15 mg/dL (Byers
and Moxon, 1980), indicating that heifers in the high level were consuming CP in excess.
Given that energy is also required to metabolize ruminal ammonia into urea by the liver
(Reynolds, 1992), the lack of differences on pre-weaning ADG among treatments may also be
associated with a greater amount of energy being partitioned towards N recycling instead of
growth in supplemented heifers (Moriel et al., 2012).
Nutritional management of replacement heifers from weaning to breeding is critical to
their lifetime productivity (Eborn et al., 2013). Improved forage intake increases total dietary
energy intake; in mature forage-based diets, as during the dry season, inadequate supply of
nitrogen to the rumen would be the main factor limiting intake, which would in turn lead to
23
content of forage was lower than in the pre-weaning phase, in this way, providing
supplementation in higher level efficiently improved heifers’ post-weaning ADG, and
consequently overall ADG and final BW.
Rodríguez-Sánchez et al. (2015) showed that heifers compensated for the lower
pre-weaning ADG during the post-pre-weaning phase and for body size as well, except for heifers
that remain in low feed treatment, although animals are more able to compensate for BW than
for skeletal growth (Swali et al., 2008; Rodríguez-Sánchez et al., 2015). In this way, severe
nutritional restriction can cause permanent impairment to heifers’ growth.
The height at withers in cattle is primarily a composite of the long bone measurement
of the forelimb and is a good indicator of skeletal development. While other authors have
reported difference in height due to nutritional treatment applied (Roberts et al., 2009;
Rodríguez-Sánchez et al., 2015), the lack of difference in height indicates that level of feed or
nutrient restriction applied in the present study was not detrimental for skeletal development
and subsequent mature size, reflected by height.
The BW:height ratio reflects animals’ body condition (Eborn et al., 2013).
Supplemented heifers had greater BW:height ratio and within supplemented heifers, heifers
receiving 6 g/kg of BW had grater BW:height ratio, showing that higher level of
supplementation post-weaning improves animals’ capacity of muscle and fat deposition.
The rump width and length provide an estimate of the internal pelvic area, which can
influence the incidence and degree of calving difficulty in heifers calving for the first time.
24
The heart girth is the BM that most correlates to BW. In the current study, heart girth
was influenced only by feeding treatment applied post-weaning, with heifers receiving higher
level of supplementation after weaning tending to have higher heart girth.
Reserves of body fat have been related to the maintenance of the estrous cycle in cattle
(Imakawa et al., 1986; Richards et al., 1989) and may act as a marker of energy available for
reproductive activity (Hall et al., 1995), acting as a permissive signal allowing ovulation and
pregnancy. In the present study, animals receiving high level of supplementation
post-weaning had greater fat thickness at the end of the experiment.
Concentrations of GH are increased during feed restriction (Bossis et al., 1999), when
GH plays a catabolic role mobilizing lipid from adipose tissue in order to conserve glucose
(Lawrence et al., 2012). The post-weaning phase of heifers development is characterized by
annual drought that usually takes place in Southeast and Midwest Brazil. In the present study,
not supplemented animals had higher GH and lower insulin concentrations compared to
animals receiving high amount of supplement (Table 6). Endocrine profile of control heifers
is in accordance with their lower feeding and nutritional level,which in turn is reflex of lower
DM, OM and CP intakes (Table 5). The higher GH concentration was not enough to equalize
glucose levels of control heifers to the supplemented heifers thought, and not supplemented
heifers had lower glucose serum concentrations in the post-weaning period.
High-starch diets increase propionate production, and propionate is converted to
glucose in the liver and stimulates release of insulin, increased insulin concentration can be
the result of aminoacids stimulation of insulin secretion as well (Harmon, 1992). Heifers
receiving high supplementation level post-weaning had greater intake of CP and OM, and
consequently energy, due better quality of supplement provided in comparison with forage; as
25
The insulin like growth factor-1 (IGF-1) is a potent stimulus to cell proliferation and
cell hypertrophy (Lawrence et al., 2012). Insulin plays an important role in regulating the
ability of GH to stimulate IGF-1 production; during periods of fasting, the lack of insulin
uncouples GH from IGF-1 production and GH plays an important role in shifting metabolism
to metabolize lipids (Lawrence et al., 2012). Due to GH and insulin pattern among strategies,
not supplemented heifers probably had lower IGF-1 concentration and therefore the reduced
corporal growth and follicular size observed.
Expression of glucose transporters (GLUT) 1, 3 and 4 have been reported in the
bovine ovary (Nishimoto et al., 2006). The same authors found that expression of GLUT1 and
3 in ovarian and in all bovine tissues and organs examined at substantial levels, but GLUT4,
an insulin-dependent transporter, is lower in ovary than in muscle and adipose tissue,
indicating that insulin-activated glucose uptake by ovarian cells have lower priority in
comparison to muscular cells, for example. Therefore, GLUT4 may play a supporting role in
the bovine follicle (Nishimoto et al., 2006), providing more glucose to follicle metabolism
when more glucose is available in the blood steam. In accordance with these findings, in our
study, animals receiving high level of supplementation post-weaning had higher insulin
concentrations and follicle diameter.
Availability of metabolic fuels seems to be the most important factor influencing
reproduction (Hall et al., 1995); cholesterol, for example, is substrate for progesterone and
other steroidal hormones production. Quantities of circulating lipoproteins in blood, main
source of cholesterol for tissues, changes according to physiological and nutritional status in
cattle. High density lipoproteins are the primary source of cholesterol for luteal progesterone
26
findings, in our study no difference was observed for total cholesterol or HDL concentrations,
in accordance with equal progesterone concentrations among treatments.
Serum proteins are constituted mainly by albumin and globulins. Serum proteins are
nutrient, hormone and growth factor transporters and play a role on determining degradation
rate and buffering hormone concentrations (Lawrence et al., 2012). The difference in serum
protein observed between supplemented and not supplemented animals post-weaning is due
higher albumin levels in supplemented heifers, as there was no difference in globulin
concentration among treatments.
Albumin is the main serum protein synthetized by the liver and its concentrations can
be related to aminoacids and nutrient availability, the lower values for albumin concentrations
in control heifers and heifers receiving low level of supplementation post-weaning further
indicates that animals from high supplementation strategy were in greater nutritional status at
the end of the experiment.
In summary, performance, endocrine, metabolic and reproductive variables evaluated
in the current study were improved by level of supplementation applied post-weaning. Due to
higher nutrient intake provided via concentrate supplement, heifers receiving 6 g/kg of BW
post-weaning had greater responses, independently of level received pre-weaning. Further
research is needed to evaluate the effects of pre and post-weaning supplementation strategies
on development of grazing Nellore heifers.
Acknowledgements
The authors thank to Fapemig for project funding (Grant: APQ-00389-13) and CNPq and
Capes for the scholarships provided to the first author.
27
Arije GF, Wiltbank JN (1971) Age and weight at puberty in Hereford heifers. Journal of
Animal Science 33, 401-406.
Barcellos JOJ, Pereira GR, Dias EA, McManus C, Canellas L, Bernardi ML, Tarouco A,
Prates ER (2014) Higher feeding diets effects on age and liveweight gain at puberty in
crossbred Nelore × Hereford heifers. Tropical Animal Health and Production 46, 953-960.
Bao B, Thomas MG, Griffith MK, Burghardt RC, Williams GL (1995) Steroidogenic activity,
insulin-like growth factor-I production and proliferation of granulosa and theca cells obtained
from dominant preovulatory and nonovulatory follicles during the bovine estrous cycle:
Effects of low-density and high-density lipoproteins. Biology of Reproduction 53, 1271-1279.
Bao B, Thomas MG, Williams GL (1997) Regulatory Roles of High-Density and
Low-Density Lipoproteins in Cellular Proliferation and Secretion of Progesterone and Insulin-Like
Growth Factor I by Enriched Cultures of Bovine Small and Large Luteal Cells. Journal of
Animal Science 75, 3235-3245.
Bossis I, Wettemann RP, Welty SD, Vizcarra JA, Spicer LJ, Diskin MG (1999) Nutritionally
induced anovulation in beef heifers: Ovarian and endocrine function preceding cessation of
ovulation. Journal of Animal Science 77, 1536-1546.
Buskirk DD, Faulkner DB, Ireland FA (1995) Increased postweaning gain of beef reifers
enhances fertility and milk production. Journal of Animal Science 73, 937-946.
Byers FM, Moxon AL (1980) Protein and selenium levels for growing and finishing beef
28
Cardoso RC, Alves BRC, Prezotto LD, Thorson JF, Tedeschi LO, Keisler DH (2014) Use of a
stair-step compensatory gain nutritional regimen to program the onset of puberty in beef
heifers. Journal of Animal Science 92, 2942-2949.
Casali AO, Detmann E, Valadares Filho SC, Pereira JC, Henriques LT, Freitas SG, Paulino
MF (2008) Influência do tempo de incubação e do tamanho de partículas sobre os teores de
compostos indigestíveis em alimentos e fezes bovinas obtidos por procedimentos in situ.
Revista Brasileira de Zootecnia 37, 335-342.
Detmann E, Paulino MF, Valadares Filho SC (2010) Otimização do uso de recursos
forrageiros basais. In: ‘Proceedings of 7th Symposium of Beef Cattle Production’. pp. 191
-240 (Departamento de Zootecnia – UFV: Viçosa)
Detmann E, Souza MA, Valadares Filho SC (2012) ‘Métodos para análise de alimentos –
INCT –Ciência Animal.’ (Suprema Gráfica: Visconde do Rio Branco, MG)
Eborn DR, Cushman RA, Echternkamp SE (2013) Effect of postweaning diet on ovarian
development and fertility in replacement beef heifers. Journal of Animal Science 91,
4168-4179.
Gasser CL, Behlke EJ, Grum DE, Day ML (2006) Effect of timing of feeding a
high-concentrate diet on growth and attainment of puberty in early-weaned heifers. Journal of
Animal Science 84, 3118-3122.
Gojjam Y, Tolera A, Mesfin R (2011) Management options to accelerate growth rate and
reduce age at first calving in Friesian–Boran crossbred heifers. Tropical Animal Health and
29
Hall JB, Staigmiller RB, Bellows RA, Short RE, Moseley WM, Bellows SE (1995) Body
composition and metabolic profiles associated with puberty in beef heifers. Journal of Animal
Science 73, 3409-3420.
Harmon DL (1992) Impact of nutrition on pancreatic exocrine and endocrine secretion in
ruminants. A review. Journal of Animal Science 70, 1290-1301.
Imakawa K, Day ML, Zalesky DD, Garcia-Winder M, Kittok RJ, Kinder JE (1986) Influence
of dietary-induced weight change on serum luteinizing hormone, estrogen and progesterone in
the bovine female. Biology of Reproduction 35, 377-384.
Lammers BP, Heinrichs AJ, Kensinger RS (1999) The effects of accelerated growth rates and
estrogen implants in prepubertal holstein heifers on estimates of mammary development and
subsequent reproduction and milk production. Jounal of Dairy Science 82, 1753-1764.
Lawrence TLJ, Fowler VR, Novakofski JE (2012) ‘Growth of Farm Animals (3rd edn).’
(CABI Publishing: London, UK)
Maquivar M, Day ML (2009) Regulação nutricional da puberdade In: ‘Curso Novos
Enfoques na Produção e Reprodução de Bovinos’. pp. 143-158 (Unesp: Uberlândia)
Martin LC, Brinks JS, Bourdon RM, Cundiff LV (1992) Genetic effects on beef heifer
puberty and subsequent reproduction. Journal of Animal Science 70, 4006-4017.
Moriel P, Cooke RF, Bohnert DW, Vendramini JMB, Arthington JD (2012) Effects of energy
supplementation frequency and forage quality on performance, reproductive, and
physiological responses of replacement beef heifers. Journal of Animal Science 90,
30
Nishimoto H, Matsutani R, Yamamoto S, Takahashi T, Hayashi K-G, Miyamoto A, Hamano
S, Tetsuka M (2006) Gene expression of glucose transporter (GLUT) 1, 3 and 4 in bovine
follicle and corpus luteum. Journal of Endocrinology 188, 111-119.
Notter DR, Cundiff LV, Smith GM, Laster DB, Gregory KE (1978) Characterization of
biological types of cattle. VII. Milk production in young cows and transmitted and maternal
effects on preweaning growth of cattle. Journal of Animal Science 46, 908-921.
NRC (2001) ‘Nutrient requeriments of dairy cattle (7th edn).’ (National Academy Press:
Washington, DC)
Patterson DJ, Perry RC, Kiracof GH, Bellows RA, Staigmiller RB, Corah LR (1992)
Management considerations in heifer development and puberty. Journal of Animal Science
70, 4018-4035.
Paulino MF, Detmann E, Valadares Filho SC (2008) Bovinocultura funcional nos trópicos.
In: ‘Proceedings of 6th Symposium of Beef Cattle Production’. pp. 275-306 (Departamento
de Zootecnia – UFV: Viçosa)
Reynolds CK (1992) Metabolism of nitrogenous compounds by ruminant liver. Journal of
Nutrition 122, 850-854.
Richards MW, Wettemann RP, Schoenemann HM (1989) Nutritional anestrus in beef cows:
Body weight change, body condition, luteinizing hormone in serum and ovarian activity.
Journal of Animal Science 67, 1520-1526.
Roberts AJ, Geary TW, Grings EE, Waterman RC, MacNeil MD (2009) Reproductive
performance of heifers offered ad libitum or restricted access to feed for a one hundred
31
Rodrigues HD, Kinder JE, Fitzpatrick LA (2002) Estradiol regulation of luteinizing hormone
secretion in heifers of two breed types that reach puberty at different ages. Biology of
reproduction 66, 603-609.
Rodríguez-Sánchez JA, Sanz A, Tamanini C, Casasús I (2015) Metabolic, endocrine, and
reproductive responses of beef heifers submitted to different growth strategies during the
lactation and post-weaning periods. Journal of Animal Science 93, 3871-3885.
Steel RGD, Torrie JH, Dickey DA (1997) ‘Principles and procedures of statistics. A
biometrical approach (3rd edn).’ McGraw Hill Co.: New York, NY)
Swali A, Cheng Z, Bourne N, Wathes DC (2008) Metabolic traits affecting growth rates of
pre-pubertal calves and their relationship with subsequent survival. Domestic Animal
Endocrinology 35, 300-313.
Tietz NW (1986) ‘Textbook of Clinical Chemistry.’ (W.B. Saunders Co.: Philadelphia, PA)
Wiltbank JN, Kasson CW, Ingalls JE (1969) Puberty in crossbred and straightbred beef
32
Table 1. Ingredients and composition of supplements provided to heifers pre and
post-weaning
A
OM – organic matter; CP – crude protein; NDF – neutral detergent fiber corrected for ash and protein residue.
ItemA Supplement
Pre-weaning Post-weaning
Ingredients % (as-fed basis)
Corn 26.0 27.5
Sorghum 26.0 27.5
Soybean Meal 45.0 45.0
Molasses 3.0 -
Chemical Composition (g/kg; dry matter basis)
OM 961 967
CP 298 270
33
Table 2. Potentially digestible forage mass and chemical composition of forage during the
experiment
A
pdDM – potentially digestible forage dry matter; OM – organic matter; CP – crude protein; NDIN – neutral
detergent insoluble N; apNDF – neutral detergent fiber corrected for ash and protein residue; iNDF –
indigestible neutral detergent fiber.
B pdDM was estimated for forage sampled in the area delimited by a metal square 0.5 × 0.5; chemical
composition was evaluated in the hand-plucked forage sample.
ItemA,B
Phase
Pre-weaning Post-weaning
Experimental Period
1 2 3 4 5 6 7 8
pdDM (kg/ha) 3730 5071 3152 6351 3355 3224 2239 5083
OM (g/kg) 926 914 921 913 920 908 910 926
CP (g/kg) 102.9 118.4 93.8 81.4 97.8 74.8 59.6 71.5
NDIN (% of total N) 31.9 26.1 30.2 36.3 37.1 34.2 17.2 16.0
apNDF (g/kg) 558 581 603 608 588 625 630 610
34
Table 3. Performance, carcass characteristics and reproductive performance of heifers according to supplementation plan applied pre and
post-weaning
A
BW – body weight; ADG – average daily gain; LMA – Longissimus muscle area; Fat thickness– fat thickness over the Longissimus muscle.
B Carcass characteristics accessed by ultrasonography.
C
H – animals received 6 g/kg of BW; L – animals received 3 g/kg of BW; and C – control, no supplement offered.
D L – linear effect of level of supplementation offered in the pre-weaning phase; Q – quadratic effect of level of supplementation offered in pre-weaning phase; S –
Supplementation effect in the pre-weaning phase; L-Pre-weaning– effect of supplementation level in the pre-weaning phase; L-Post-weaning – effect of supplementation level
in the post-weaning phase; L-Pre-weaning × L-Post-weaning – interaction between supplementation level pre and post-weaning.
ItemA,B
Pre-weaningC
SEM
P-valueD
H L C Pre-weaning Overall
Post-weaning
L Q S L-Pre-weaning L-Post-weaning
L-Pre-weaning ×
L-Post-weaning
H L H L C
8 months – Weaning
BW (kg) 218 221 216 3.53 0.50 0.31 - - - -
Pre-weaning ADG (g/d) 706 727 678 29.4 0.45 0.27 - - - -
LMA (cm²) 38.7 39.1 36.9 1.68 0.38 0.53 - - - -
Fat thickness (mm) 2.06 1.48 0.51 0.30 <0.01 0.83 - - - -
14 months - Breeding Season
BW (kg) 296 275 297 274 244 6.60 - - <0.01 0.98 <0.01 0.88
Post-weaning ADG (g/d) 416 323 406 307 157 23.8 - - <0.01 0.58 <0.01 0.89
35
LMA (cm2) 49.8 46.7 49.0 46.4 42.4 2.10 - - 0.02 0.75 0.11 0.90
Fat thickness (mm) 3.43 2.54 2.98 2.27 2.52 0.33 - - 0.43 0.21 <0.01 0.75
Follicular Diameter (mm) 11.5 9.5 11.3 7.7 9.9 0.78 - - 0.91 0.24 <0.01 0.38