Faculty of Sports Sciences and Physical Education
Bioenergetical and biomechanical
characterisation of butterfly stroke
Presentation of doctoral thesis in Sport Sciences according to the Dec-Lei n.º
216/92 in 13th of October.
Orientation: João Paulo Vilas-Boas, PhD
Tiago Manuel Cabral dos Santos Barbosa
Barbosa, TM (2005). Bioenergetical and biomechanical characterisation of
Butterfly stroke. Dissertação apresentada às provas de doutoramento.
Faculdade de Ciências do Desporto e de Educação Física da Universidade do
Porto. Porto.
Palavras-chave:
NATAÇÃO
MARIPOSA
CUSTO ENERGÉTICO
MECÂNICA GESTUAL
VELOCIDADE SEGMENTAR
The following parts of the present thesis are published:
1. BARBOSA T, SANTOS SILVA JV, SOUSA F, VILAS-BOAS JP. (2002). Measurement of butterfly average resultant impulse per phase. In: K. Gianikellis (ed.). Proceeding of the XXth International Symposium on Biomechanics in Sports. pp. 35-38. Universidad
de Extremadura, Cáceres.
2. BARBOSA T, KESKINEN K, FERNANDES R, COLAÇO C, LIMA A, VILAS-BOAS JP. (2005). Energy cost and intra-cyclic variations of the velocity of the centre of mass in butterfly stroke. Eur J Appl Phhysiol. 93: 519-523.
3. BARBOSA T, KESKINEN K, FERNANDES R, COLAÇO C, CARMO C, VILAS-BOAS JP. (2005). Relationship between energetic, stroke determinants and velocity in butterfly. Int J Sports Med. 26: 1-6.
The following parts of the present thesis have been submitted for publication:
1. BARBOSA, T, LIMA A, FERNANDES R, MOROUÇO P, VILAS-BOAS JP. Predicting the intra-cyclic variation of velocity of the centre of mass from segmental velocities in butterfly stroke. Sports Biomech.
2. BARBOSA T, FERNANDES R, KESKINEN K, COLAÇO P, CARDOSO C, SILVA J, VILAS-BOAS JP. Evaluation of the energy expenditure in competitive swimming strokes. Int J Sports Med.
Acknowledgments
A doctoral thesis is an important landmark in the academic carrier of anyone. Although one
single author is referred in the front page, several persons were directly and indirectly involved
in its preparation. Therefore, I would like to share my deep acknowledgment to every one of
them.
To Prof. Dr. João Paulo Vilas-Boas for being, and still be, an example to follow in relation to
he’s high interest in his job, he’s competence and in he’s capability of achieve the excellence in
the activities in witch is involved.
To MSc. Ricardo Fernandes, with who I shared several moments of anxiety during all the
process. I also would like to express my thank you due to all logistic activities in which he was
involved before and during the swimmers evaluations.
To Prof. Dr. Kari Keskinen, from the University of Jyväskylä, due to he’s collaboration during the
swimmers evaluations, reviewing and correcting some papers before submission.
To MSc. Paulo Colaço, MSc. Carla Cardoso, MSc. José Silva, MSc. Susana Soares, Dr.
António Lima, Dr. Sónia Vilar, Dr. Pedro Morouço and Dr. Carla Carmo for their assistance
during the swimmers evaluations.
To all my colleagues, from the Department of Sports Sciences and Physical Education of the
Polytechnic Institute of Bragança, for their support and friendship.
To my family. Those persons who are unconditionally with us in good and in the bad moments.
Index
Page
Chapter 1:Introduction 1
Chapter 2:Purpose of the study 7
Chapter 3: Total energy expenditure in butterfly stroke 11
Chapter 4: Average resultant impulses per phase in butterfly stroke 21
Chapter 5: Energetics and stroke determinants in butterfly stroke 27
Chapter 6: Energetics and speed fluctuation in butterfly stroke 37
Chapter 7: Speed fluctuation and stroke determinants in butterfly stroke
45
Chapter 8: Contributions of segmental velocities to speed fluctuation in butterfly stroke 55
Chapter 9: General discussion and conclusions
69
Chapter 10: References 81
Figures index
Page
Chapter 1 Figure 1: An overall perspective of the steps to be taken, for a
biophysical evaluation, of butterfly stroke.
5
Chapter 3 Figure 1: Relationship between the total energy expenditure and the
swimming velocity from two of the studied swimmers.
15
Chapter 3 Figure 2: Energy expenditure profile, of the four swimming techniques,
for the selected velocities.
16
Chapter 3 Figure 3: Comparison of total energy expenditure between the
swimming stroke according to the Fisher’s Post-hoc test, in each selected velocity.
17
Chapter 4 Figure 1: Comparison of the average resultant impulse, in each swim
phase, between the breathing techniques.
25
Chapter 4 Figure 2: Comparison of the intra-cyclic variations of the average
resultant impulse using the different breathing techniques.
26
Chapter 5 Figure 1: Relationship between the total energy expenditure and the
mean swimming velocity for one swimmer.
32
Chapter 5 Figure 2: Relation between: a) energy cost (EC) and the stroke
frequency; b) EC and stroke length; c) EC and stroke index of one of the analyzed swimmers.
32
Chapter 5 Figure 3: Relation between: a) stroke frequency and mean velocity (V);
b) stroke length and V; c) stroke index and V for one of the evaluated swimmers.
33
Chapter 6 Figure 1: The VO2 kinetics from one of the studied swimmers during a
200-m stage.
40
Chapter 6 Figure 2: The intra-cyclic fluctuation of the velocity of the center of
mass for one of the swimmers.
41
Chapter 6 Figure 3: Economy profile established between the total energy
expenditure and the velocity of displacemen for all the swimmers.
42
Chapter 6 Figure 4: Overall regression between the energy cost and the
intracyclic variation of the horizontal displacement of the centre of mass.
42
Chapter 7 Figure 1: Regression plots between the intra-cyclic variation of the
horizontal velocity of the centre of mass and the mean horizontal velocity of displacement, the stroke length, the stroke frequency and the stroke index at slow and high swimming velocity.
51
Chapter 7 Figure 2: Overall regression plots between the intra-cyclic variation of
the horizontal velocity of the centre of mass and the mean horizontal velocity of displacement, the stroke length, the stroke frequency and the stroke index.
Chapter 9 Figure 1: Comparison between data from literature and present results, of swimming economy.
72
Chapter 9 Figure 2: Deterministic model for the relationships between
bioenergetical and biomechanical variables, in Butterfly stroke.
Tables index
Page
Chapter 5 Table 1: Anthropometrical and performance characteristics in short
course of the butterfliers studied.
30
Chapter 5 Table 2: Individual regression equations and correlation coefficients
between total energy expenditure and velocity, energy cost and stroke frequency, energy cost and stroke length and EC and stroke index.
33
Chapter 5 Table 3: Individual regression equations and correlation coefficients
between the mean velocity and the stroke frequency, the stroke length and the stroke index.
34
Chapter 6 Table 1: Anthropometrical data and performance characteristics of the
subjects in short course.
40
Chapter 8 Table 1: Descriptive statistics of the intra-cyclic variation of the
horizontal velocity of the centre of mass, the hands and feet’s velocity at slow and high velocity.
62
Chapter 8 Table 2: Pearson product correlation coefficient between dV, the
hands and feet’s velocities at slow velocity, high velocity and overall velocity.
63
Chapter 8 Table 3: Summary of the model, included in the forward step-by-step
regression equation, for predictors of speed fluctuation, at slow velocity, high velocity and for overall velocity.
63
Chapter 9 Table 1: Revision of the most important studies about average
resultant impulses per phase in competitive swimming techniques.
Symbols index
(1dwn) First downbeat
(2dwn) Second downbeat
(1upb) First upbeat
(2upb) Second upbeat
(APAS) Ariel Performance Analysis System
(ARI) Average resultant impulse per phase
(BxB) Breath-by-breath
(dV) Intra-cycle variation of the horizontal velocity of displacement
(EC) Energy cost
(ent) Hand’s entry
(Eq) Equation
(Ėtot) Total energy expenditure
(ins) Hand’s insweep
(max) Maximal value
(min) Minimal value
(N.S.) Not significant.
(out) Hand’s outsweep
(r) Coefficient of correlation
(S.D.) Standard desviation
(SF) Stroke frequency
(SI) Stroke index
(SL) Stroke length
(ups) Hand’s upsweep
(V) Mean swimming velocity
(VO2) Oxygen consumption
(Vx) Horizontal component of the segmental velocity
(Vy) Vertical component of the segmental velocity
Resumo
O estudo da Biofísica da natação é uma das áreas de maior interesse para os investigadores em Ciências do Desporto. No entanto, existe um défice de entendimento sobre as relações que se estabelecem entre as variáveis bioenergéticas e biomecânicas, especialmente na técnica de Mariposa. Assim, foi objectivo desta tese efectuar uma caracterização bioenergética e biomecânica da técnica de Mariposa, compreendendo as relações que se estabelecem entre estes dois domínios. Na presente tese são apresentados 6 estudos independentes que foram levados a cabo no sentido de atingir o objectivo geral definido previamente. Os dois primeiros estudos tiveram como objectivo efectuar uma caracterização geral da técnica de Mariposa.
Num primeiro estudo efectuou-se a comparação do dispêndio energético total (Ėtot) nas quarto
técnicas de nado formal, mas com especial referência à técnica de Mariposa. A técnica de Crol foi a mais económica, seguida das técnicas de Costas, de Mariposa e por fim de Bruços. Num segundo estudo, o propósito foi o de estimar o impulso médio resultante (ARI) por fase propulsiva do ciclo gestual. A técnica de Mariposa caracteriza-se pelas elevadas variações intracíclicas do ARI. Este facto parece dever-se às significativas reduções da ARI ocorridas durante a recuperação dos membros superiores e a entrada destes na água. De seguida foram desenvolvidos estudos no sentido de compreender as relações que se estabelecem entre as
variáveis bionergéticas e biomecânicas. Aumentos do Ėtot foram significativamente
relacionados com o aumento da velocidade de nado (V). O custo energético (EC) aumentou significativamente com o aumento da frequência gestual (SF) e do índice de nado (SI). O EC diminui com o aumento da distância de ciclo (SL). O aumento do EC também foi significativamente associado ao aumento da variação intracíclica da velocidade horizontal do deslocamento do centro de massa (dV). Os últimos estudos procuraram identificar as relações que se estabelecem entre as diversas variáveis biomecânicas com a dV. As relações entre a SF e a V, assim como, entre a SI e a V foram positivas e significativas. No caso da relação entre a V e a SL, verificou-se uma ligeira tendência para a diminuição da SL com o aumento da V. Observou-se uma relação significativa e negativa entre a dV e a V, entre a dV e a SL e entre a dV e a SI. A uma dada V, verificou-se uma relação positiva e significativa entre a dV e a SF. Elevadas velocidade segmentares, nas fases mais propulsivas do ciclo gestual, foram significativamente associadas com a diminuição da dV. Em conclusão, o comportamento de diversas variáveis biomecânicas, tais como os parâmetros gerais do ciclo gestual, a velocidade segmentar dos pés e das mãos, influenciam significativamente a V e o perfil da dV. Em
consequência, estes parâmetros irão influenciar significativamente o Ėtot e o EC. Logo, os
treinadores e os mariposistas devem efectuar uma avaliação exaustiva e frequente da técnica de nado, por forma a reduzir o EC associado a uma determinada velocidade de deslocamento.
PALAVRAS-CHAVE: natação, mariposa, custo energético, mecânica gestual, velocidade
Abstract
The Biophysical study of swimming is one of the major interests of the sport sciences investigators. However, there is a lack of investigation trying to understand the relationships established between the bioenergetical and biomechanical variables, especially in butterfly stroke. Therefore, the purpose of this thesis was to conduct a bioenergetical and biomechanical characterizations of the butterfly stroke, understanding the relationships established between those two domains. In this thesis 6 independent studies are presented in order to achieve the purpose defined. The first two investigations had the purpose to obtain a general characterisation of butterfly stroke. The purpose of the first study was to compare the total
energy expenditure (Ėtot) of the four competitive swimming techniques, with special reference to
butterfly stroke. The freestyle was the most economic swimming technique, followed by the backstroke, the butterfly and the breaststroke. The purpose of a second study was to estimate the average resultant impulse (ARI) per stroke phase. Butterfly stroke is a swimming technique where it is possible to observe high intra-cycle variations of the ARI, due to significant reductions of this parameter during the arm’s recovery and hand’s entry. The following papers had the aim of understand the relationships established between the biomechanical and
bioenergetical variables. Increases in the Ėtot were significantly related to the increase of
swimming velocity (V). The energy cost (EC) increased significantly along with the increasing stroke frequency (SF) and stroke index (SI). The EC decreases with increasing stroke length (SL). The increase of the EC is significantly associated with the increase of the intra-cyclic variations of the horizontal velocity of the centre of mass (dV), in Butterfly stroke. The last papers had the aim to identify the relationships established between the biomechanical variables and the dV. The relationships between SF and V, as well as, between SI and V were positive and significant. For the relationship between V and SL, there was a slight tendency to decrease SL with the increase in V. There was a negative and significant relationship between dV and V, between dV and SL and between dV and SI. For a given swimming velocity, it is observed a positive and significant relationship between dV and SF. High segmental velocities, in the most propulsive phases of the stroke cycle, were significantly associated to decreases of dV. As a conclusion, the behavior of biomechanical variables, such as the stroke determinant, the hand’s and feet’s velocities, influence the V and the dV profile. Consequently, these
parameters will affect the Ėtot and the EC of swimming. Therefore, coaches and butterfliers
should conduct an exhaustive and frequent evaluation of their technique in order to reduce the EC associated to a given swimming velocity.
KEYWORDS: swimming, butterfly stroke, energy cost, stroke mechanics, segmental velocity,
Resumé
L’étude de la Biophysique de la nage est un des secteurs les plus intéressants pour les chercheurs des Sciences du Sport. Il y a cependant, un déficit, de compréhension sur les relations qui s’établissent entre les variables bio-énergétiques et bio-méchaniques, spécialement en ce qui concerne la technique Papillon. Ce fut donc l’objectif de cette thèse d’entreprendre une caractérisation bio-énergétique et bio-méchanique de la technique Papillon, en comprenant les relations qui s’établissent entre ces deus domaines. Nous présentons dans cette thèse 6 études indépendantes qui ont été entreprises dans le but d’atteindre l’objectif général préalablement défini. Les deux premières études ont eu pour but de réaliser une caractérisation générale de la technique Papillon. Dans une première étude nous avons
entrepris la comparaison de la dépense énergétique totale (Ėtot) dans les quatre techniques de
nage formelles, mais avec une référence particulière à la technique Papillon. La technique du Crawl fut la plus économique, suivie des techniques du Dos, Papillon et enfin Brasse. Dans une deuxième étude, le but fut celui d’estimer l’impulsion moyenne résultante (ARI) par phase propulsive du cycle gestuel. La technique Papillon se caractérise par d’élevées variations intra-cycliques de l’ARI. Ce fait semble être causé par de significatives variations de l’ARI lors de la récupération des membres supérieurs et leur entrée dans l’eau. Nous avons ensuite développé des études allant dans le sens de comprendre les relations qui s’établissent entre les variables
bio-énergétiques et bio-méchaniques. Des augmentations de la Ėtot ont été significativement
mises en rapport avec l’augmentation de la vitesse de la nage (V). Le coût énergétique (EC) a augmenté de façon significative avec l’augmentation de fréquence gestuelle (SF) et de l’indice de la nage (SI). La EC diminue avec l’augmentation de la distance de cycle (SL). L’augmentation de la EC a aussi été significativement associée à l’augmentation de variation intra cyclique de la vitesse horizontale du déplacement du centre de masse (dV). Les dernières études ont cherché à identifier les relations qui s’établissent les différentes variables bio-méchaniques et la dV. Les relations ente la SF et la V, bien que celles entre le SI et la V ont été positives et significatives. Dans le cas de la relation entre la V et la SL nous avons remarqué une légère diminution de la SL avec l’augmentation de la V. Nous avons remarqué une relation significative et négative entre la dV et la V. Pour une V donnée, nous avons remarqué une relation positive et significative entre la dV et la SF. Des vitesses segmentaires élevées dans les phases les plus propulsives du cycle gestuel ont été significativement associées avec la diminution de la dV. En conclusion, le comportement des différentes variables bio-méchaniques telles que les paramètres généraux du cycle gestuel, la vitesse segmentaire des pieds et des mains, influencent de façon significative et a V et le profil de la dV. Conséquemment, ces
paramètres iront influencer significativement et la Ėtot et la EC. Donc. Les entraîneurs et les
nageurs Papillon devront entreprendre une évaluation exhaustive et fréquente de la technique de la nage de façon à réduire la EC associée à une vitesse déterminée de déplacement.
MOTS CLES: nage, papillon, coût énergétique, mécanique gestuelle, vitesse segmentaire,
Swimming performance is influenced by several factors. The kineanthropometric characteristics
(e.g., van Tilborgh et al., 1983; Zhu et al., 1997; Saavedra et al., 2002), the psychological
factors (e.g., Stallman et al., 1992; Zientek, 2003), the genetic background (e.g., Bouchard,
1986), the environment, as for example, the pool length, the pool depth or the water
temperature (e.g., Keskinen et al., 1996; Lyttle et al., 1998; Srámek et al., 2000), the energetics
and technical characteristics of the swimmers (e.g., Holmér, 1974; 1983: Miyashita, 1975; 1996;
Troup, 1996) are some of those factors.
The Biophysical study of swimming is one of the major interests of the sport scientists Clarys
(1996) analysed 685 papers related to swimming and distinguish them according to the area of
knowledge applied for its study: Physiology, Biochemistry, Termoregulation, Psychology,
Medicine/Clinic, Biomechanics, Hydrodynamics, Electromyography, Kineantropometry,
Methodology/Instrumentarium, Evaluation/Education and other interdisciplinary areas. The
category with the highest number of studies was Biomechanics with 20%, followed by
Physiology with 18%, Medicine/Clinic with 16%, Hydrodynamics with 9% and Electromyography
with 8%. It seems that the Biophysical principals related to swimming performance are one of
the more attractive areas of investigation. This might be related to the fact that performance, in
this sport, is strongly affected by the swimming technique, the swimmer’s physiological profile
and the training procedures.
Butterfly stroke is one of the least studied strokes, especially when compared with front crawl or
breaststroke. A major focus in front crawl might be associated to the fact of being the swimming
technique with the higher number of events in the official competitions. Front crawl is the stroke
that promotes the highest swimming velocity and represent the most important swimming event:
the 100-m freestyle. Probably the strong interest in breaststroke is justified because it is one of
the earliest swimming techniques and due to the restrictions imposed by swimming rules, witch
limits the development of more efficient patterns of displacement.
There are some classic studies comparing the swimming economy of several swimming
techniques (Karpovich, 1930; Karpovich and Pestrecov, 1939; Karpovich and Le Maistre, 1940;
Holmér, 1974; 1983; Holmér and Haglund, 1978; Pendergast et al., 1978). Based on these
studies, it is common to assume that, for a given velocity, butterfly is the less economical
swimming technique, followed by the breaststroke, the backstroke and the front crawl. Since the
publication of these papers, major changes in the training procedures and in the swimming
techniques occurred. For example, the ondulatory breaststroke is used on a regular base by
several swimmers. Different breathing models are adopted in butterfly. There was an increment
in the number of kicks per stroke cycle (from 2 to 6) in front crawl. Therefore, it is important to
comparative profile of all of them. It is also interesting to know if there was an evolution of the
butterfly stroke, in the last few years, in what concerns to improvements in its relative economy
profile.
Some studies about the relationship between speed fluctuation and energy cost were done in
breaststroke (Vilas-Boas, 1996), front crawl and backstroke (Alves et al., 1996). In breaststroke,
the correlation coefficients and the determination coefficients between the intra-cyclic variation
of the horizontal velocity of the hip and the energy cost presented significant values, when
analysed intra-individually. For the front crawl, there were not observed significant relationships
between the same variables, at any swimming velocity studied (Alves et al., 1996). According to
Alves et al. (1996), in backstroke, the relationship was significant at low velocities, such as,
1.1m.s–1 (r=0.78) and 1.2m.s–1 (r=0.66). Apparently there is an increment of the energy cost
with the increment of the intra-cyclic variations in breaststroke and in backstroke at low
velocities. The relationship between speed fluctuation and energy cost seems to be more
consistent, or at lest, easier to be observed, in the simultaneous techniques (breaststroke and
butterfly) than in the alternated techniques (front crawl and backstroke). Probably this is justified
due to the higher intra-cyclic variations of the horizontal velocity of the swimmer in breaststroke
and butterfly (Mason et al., 1989; 1992; Vilas-Boas, 1996; Barbosa et al., 2003). It is known
that, in breaststroke, the high speed fluctuation promotes also a higher average resultant
impulse of the swimmer’s body (van Tilborgh et al., 1988; Vilas-Boas, 1994). It is the needs of
re-accelerate the body mass after each resistive phase that induces an increase of the energy
cost (Vilas-Boas, 1996). However, there is no study published about the average resultant
impulse per phase and the relationship between the speed fluctuation and the energy cost, in
butterfly stroke.
Still in the edge areas of Biomechanics and Physiology, Wakayoshi et al. (1995; 1996) and
Nomura and Shimoyana (2003) studied the relationships between stroke determinants (stroke
length and stroke frequency) and the bioenergetical profile at various swim speeds. Only one
study (Wakayoshi et al., 1995) analyzed butterfly stroke. But, evaluating a single butterflier, in a
sample of ten swimmers. Despite Nomura and Shimoyana (2003) described the evaluation of
one butterflier, they did not presented its results. According to the authors, the butterflier’s
results were quite different from all the other swimmers evaluated. In the study of Wakayoshi et
al. (1995), it was observed significant correlation coefficients between energy cost and
swimming velocity, as well as, between energy cost and stroke frequency. However, the reduce
number of subjects evaluated in butterfly should lead investigators to consider to perform a
Martins-Silva and Alves (2000) studied the components of the hand’s velocity and how they
affected the intra-cyclic variation of the horizontal velocity of the centre of mass, in butterfly
stroke. Using a stepwise regression, Martins-Silva and Alves (2000) verified that all 3D
components of the hand’s velocity were important to the intra-cyclic variations of the horizontal
velocity, especially during the most propulsive phases (upsweep and insweep). The first
variable to be included in the model was the 3D resultant of the hand’s velocity during the
insweep (r2=-0.98), followed by the lateral component of the hand’s velocity during the insweep
(r2=0.99) and the vertical component of the hand’s velocity during the insweep (r2=1).
Butterfly stroke is a swimming technique characterised by the body waving action (Sanders et
al., 1995); phenomena associated to the leg’s actions from the neuromuscular (Barthels and
Adrian, 1971) and kinematical (Sanders et al., 1995; Barbosa et al., 1999) point of views. In
fact, Sanders et al. (1995) observed a significant association between the body wave and the
swimming velocity (r=0.88 for males and r=0.96 for females). Therefore, it might be interesting
to understand not only the contribution of the hand’s velocity to the intra-cyclic variations of the
horizontal velocity of the centre of mass, but also the influence of the feet’s to the speed
fluctuation.
Despite the studies referred above, there is a lack of research trying to understand the
relationships established between the bioenergetical and biomechanical variables in swimming,
especially in butterfly stroke. The study of efficiency, in the water, becomes more complex due
to difficulties in quantifying, with accuracy, the energetic exchanges between the swimmer and
the environment. In our days, one of the most active groups studding the efficiency of the
aquatic locomotion, as for example, kayaking, rowing or swimming, is from the Udine University
(Zamparo et al., 2002; Pendergast et al., 2003). There are also other important groups working
in this area of knowledge, as for example the Vrije University Amsterdam (Hollander et al.,
1986; Toussaint, 1988; Berger, 1996) or the International Center for Aquatic Research in
Colorado Spring (Cappaert et al., 1992). However, it should be developed an increasing
quantity and quality of studies about the efficiency of different aquatic locomotion activities.
Including the study of butterflier efficiency.
Butterfly stroke is an aquatic locomotion technique where much investigation is to be done.
What is the bionergetical profile of butterfly stroke? What is the intra-cyclic variation profile of
the swimmer’s velocity? Are there any relationships between bioenergetical and biomechanical
variables? An overall perspective of the steps to be taken for a biophysical evaluation of
butterfly stroke is presented in figure 1. In one first approach, it would be interesting to
understand how biomechanical variables (e.g., intra-cycle variation of the horizontal velocity of
understand how the segmental velocities and the stroke determinants influence the intra-cyclic
variations of the horizontal displacement of the centre of mass and/or the swimming velocity.
Achieving this goal, it might be possible to identify biomechanical variables that have significant
influence in the butterfly bioenergetical profile. Therefore, coaches can modify the swimming
technique of butterfliers, in order to reduce energy cost, and consequently, improve swimming
performance. ,7 ,72 ,74 ,76 ,78 ,8 ,82 ,84 ,86 ,88 ,9 ,92 E/ v
1 1,051,11,151,21,251,31,35 V el E/v = -,082 + ,751 * V el; R^2 = ,948
Energy cost Energy expenditure 1,5 2 2,5 3 3,5 4 4,5 5 5,5 6 6,5
entry outsw eepins w eepups w eep
Segmental velocity Stroke mechanics 0 0,5 1 1,5 2 2,5 3
0,033 0,200 0,367 0,533 0,700 0,867 1,033
tempo (s) vel (m .s -1) anca CM Intra-cyclic variations 2nd step 1st step
Figure 1. An overall perspective of the steps to be taken, for a biophysical evaluation, of butterfly stroke.
Therefore, the purpose of this thesis was to conduct a bioenergetical and biomechanical
characterizations of the butterfly stroke, understanding the relationships established between
those two domains.
In Chapter 2 is presented the research problem from this investigation and the research
purposes (including the general purpose and the specific purposes).
In Chapter 3 is presented an experimental study, with the purpose to compare the total energy
expenditure of the four competitive swimming techniques, with special reference to butterfly
stroke.
In Chapter 4 is presented another experimental study, with the aim of estimate the average
resultant impulse per stroke phase in Butterfly stroke.
In Chapter 5 is presented a study identifying the relationships between the stroke determinants
(stroke frequency, stroke length and stroke index) and the velocity in Butterfly stroke; as well as,
identifying the relationships established between the energy cost and the stroke determinants
through a range of swimming velocities.
In Chapter 6 is presented an investigation investigating the relationship between the intra-cycle
In Chapter 7 is presented an investigation investigating the relationships between the
intra-cyclic variations of the horizontal velocity of the center of mass, the stroke determinants (stroke
length, stroke frequency and stroke index) and the swimming velocity in butterfly stroke.
In Chapter 8 is presented an investigation investigating the relationships between the intra-cycle
variation of the horizontal velocity of the center of mass, the hand’s and feet’s velocities, as well
as, to identify the variables that most predict the intra-cyclic variations of swimming velocity, in
butterfly stroke.
In Chapter 9 a general discussion from the results obtained in the 6 independent studies is
1. RESEARCH PROBLEM
With the present study, it was tried to answer to the following research problems:
What is it the bioenergetical profile of the butterfly stroke?
What is the intra-cyclic variation profile of the horizontal velocity of the centre of mass of
the butterfly stroke?
What biomechanical factors do affect the intra-cyclic variations of the horizontal velocity
of the centre of mass and the swimming velocity in butterfly stroke?
Is there any relationship between the bioenergetical profile and the biomechanical
variables in butterfly stroke?
2. RESEARCH PURPOSES 2.1. GENERAL PURPOSE
The general purpose of this thesis was to perform a bioenergetical and biomechanical
characterization of the butterfly stroke. Moreover, the aim was also to understand the
relationships between the bioenergetical and the biomechanical domains in this swimming
technique.
2.2. SPECIFIC PURPOSES
Based on the major goal of the research, the purposes have been decomposed in the form of
the following specific purposes:
To compare the total energy expenditure of the four competitive swimming techniques,
with special reference to butterfly stroke (chapter 3);
To estimate the average resultant impulse per stroke phase in Butterfly stroke (chapter
4);
To identify the relationships between the stroke determinants (stroke frequency, stroke
To identify the relationships established between the energy cost and the stroke
determinants through a range of swimming velocities (chapter 5);
To examine the relationship between the intra-cycle variation of the horizontal velocity
of the center of mass and the energy cost in butterfly stroke (chapter 6);
To examine the relationships between the intra-cyclic variations of the horizontal
velocity of the center of mass, the stroke determinants (stroke length, stroke frequency
and stroke index) and the swimming velocity in butterfly stroke (chapter 7);
To examine the relationships between the intra-cycle variation of the horizontal velocity
of the center of mass, the hand’s and feet’s velocities (chapter 8) and;
To identify the variables that most predict the intra-cyclic variations of swimming
The purpose of this study was to measure and compare the total energy expenditure of the four
competitive swimming strokes. 26 swimmers of international level were submitted to an
incremental set of 200-m swims (5 swimmers at Breaststroke, 5 swimmers at Backstroke, 4
swimmers at Butterfly and 12 swimmers at Front Crawl). The velocity was increased by 0.05
m·s-1 after each swim until exhaustion. Cardio-pulmonary and gas exchange parameters were
measured breath-by-breath (BxB) for each swim to analyse oxygen consumption (VO2) and
other energetic parameters by portable metabolic cart (K4b2, Cosmed, Italy). A respiratory
snorkel and valve system with low hydrodynamic resistance was used to measure pulmonary
ventilation and to collect breathing air samples. Blood samples from the ear lobe were collected
before and after each swim to analyze blood lactate concentration (YSI 1500L, Yellow Springs,
US). Total energy expenditure (Ėtot), was calculated for each 200-m stage. Ėtot differed
significantly between the strokes at all selected velocities. At the velocity of 1.0 m.s-1 and of 1.2
m.s-1 the Ėtot was significantly higher in Breaststroke than in Backstroke, in Breaststroke than in
Freestyle and in Butterfly than in Freestyle. At the velocity of 1.4 m.s-1, the Ėtot was significantly
higher in Breaststroke than in Backstroke, in Backstroke than in Freestyle, in Breaststroke than
in Freestyle and in Butterfly than in Freestyle. At the velocity of 1.6 m.s-1, the Ėtot was
significantly higher in Breaststroke and in Butterfly that in Freestyle. As a conclusion, Ėtot of
well-trained competitive swimmers was measured over a large range of velocities utilising a new
BxB technique. Freestyle was shown to be the most economic among the competitive
swimming strokes, followed by the Backstroke, the Butterfly and the Breaststroke.
KEYWORDS: total energy expenditure, aerobic contribution, anaerobic contribution, swimming
1. INTRODUCTION
It was in the 1960’s that physiological data about swimming began to be published regularly.
However, one landmark in this area of knowledge it was the investigation developed Holmér
(1974).
Holmér (1974) compared the swimming economy of several competitive swimming strokes in a
flume. An obvious dichotomy was observed between the alternated (Freestyle and Backstroke)
and the simultaneous (Breaststroke and Butterfly) techniques, later on confirmed by other
authors (Pendergast et al., 1978; Lavoie and Montpetit, 1986). For a given velocity, and by this
order, the Butterfly and the Breaststroke were the least economical strokes, the Backstroke and
the Freestyle being the most economical ones.
More recently, Troup (1991) observed that the Breaststroke was less economical than the
Butterfly, for a range of swimming velocities. The researcher explained this finding by the higher
velocities chosen for his study, when compared with the previously published ones. In fact,
Karpovich and Millman (1944) verified the same occurrence. At velocities higher than 2.5
feets.s–1 (equivalent to 0.76 m.s–1), the “side stroke” variant at breaststroke presented a higher
cost than the Butterfly.
Since the study of Holmér (1974) three decades have passed. In this period of time, major
changes in the training procedures and in the swimming strokes have occurred. Obviously, this
can’t be disconnected from the evolution of research regarding swimming.
Several studies have only analyzed the aerobic contribution to the swimming economy (e.g.,
Holmér, 1974; Pendergast et al., 1978; van Handel et al., 1988; Chatard et al., 1990). Presently,
however, the analysis of the energy expenditure should also allow understanding the role of the
anaerobic contribution (di Prampero et al., 1978; Camus et al., 1984; Thevelein et al., 1984;
Camus and Thys, 1991). In fact, the perceptual contribution of the anaerobic system to the
overall energy expenditure must not be disregarded.
Most studies about cardiorespiratory profiles in swimming have used Douglas bags or mixing
chamber gas analyzers (e.g., Holmér, 1974; Lavoie and Montpetit, 1986; Chatard et al., 1990;
Wakayoshi et al., 1995; 1996). The recent development of improved instrumentation and
technology in breath-by-breath (BxB) analysis has resulted in new approaches to study
cardiorespiratory variables. Several studies verified that these equipments recorded with
acceptable accuracy, reliability and validity oxygen consumption and other metabolic
2001; Keskinen et al., 2003; Maiolo et al., 2003). The last version of miniaturized metabolic
carts has been developed for BxB gas analysis, allowing direct measurement of
cardiorespiratory parameters during free swimming in an easiest way. Moreover, this apparatus
allows the characterization of oxygen uptake kinetics in a more feasible and detailed manner,
during direct measurement. Nevertheless, there is a lack of studies around this topic, using BxB
technology, in swimming.
The purpose of this study was to compare the total energy expenditure of the four competitive
swimming strokes in high-level swimmers of both genders.
2. METHODS
Subjects. 26 swimmers (8 females and 18 males) of international level volunteered to serve as
subjects. 5 swimmers were evaluated performing Breaststroke (including one female swimmer),
4 swimmers performing Butterfly (including one female swimmer), 5 swimmers performing
Backstroke and 12 swimmers performing Freestyle (including 6 female swimmer). The fat mass
for Breaststroke swimmers was 6,4 ± 2.9%, for Butterfly 6.1 ± 3.0%, for Backstroke 6.8 ± 2.4%
and for Freestyle was 7.6 ± 2.3%.
Design.The subjects were submitted to an incremental set of 200-m swims. The velocities and
increments were chosen in agreement with swimmers so that they would make their best
performance on the 7th trial. The starting velocity was set at a speed, which represented a low
training pace. The last trial should represent the swimmers best performance, in competitive
context, at that time. After each successive 200-m swim, the velocity was increased by 0.05
m·s-1 until exhaustion and/or until the swimmer could not swim at the predetermined pace. The
resting period between swims was 30s to collect blood samples. Under-water pace-maker lights
(GBK-Pacer, GBK Electronics, Portugal), on the bottom of the 25-m pool, were used to control
the swimming speed and to help the swimmers keep an even pace along each step.
Data Collection. The swimmers breathed through a respiratory snorkel and valve system
(Keskinen et al., 2003; Rodríguez et al., 2003) connected to a telemetric portable gas analyzer
(K4 b2, Cosmed, Italy). Cardio-respiratory and gas exchange parameters were measured BxB
for each swim to analyze oxygen consumption (VO2) and other energetic parameters.
Blood samples (25 µl) from the ear lobe were collected to analyze blood lactate concentration
(YSI 1500 L, Yellow Springs, US) before and after each swim as well as 1, 3, 5 and 7 minutes
after the last swim.
The total energy expenditure (Ėtot) was calculated using the VO2 net (difference between the
value measured in the end of the stage and the rest value) and the blood lactate net (difference
between the value measured in two consecutive stages), transformed into VO2 equivalents
using a 2.7 mlO2.Kg
-1
.mmol-1 constant (di Prampero et al., 1978; Thevelein et al., 1984).
Individual regression equations were computed between the Ėtot and the V, for all the
swimmers. Figure 1 presents, as an example, the relationship between Ėtot and V obtained with
two swimmers. Ėtot was extrapolated or interpolated for the velocities of 1.0 m.s
–1
, 1.2 m.s–1, 1.4
m.s–1 and 1.6 m.s–1, using the individual regression equations computed. These velocities were
selected from the range of velocities swum during the incremental protocol and are similar to
the ones previously used by Troup [33]. The maximal swimming velocity achieved in Freestyle
was 1.57 m.s–1, in Backstroke was 1.46 m.s–1, in Breaststroke was 1.18 m.s–1 and in Butterfly
was 1.30 m.s–1.
20 30 40 50 60 70 80 E -to t ( m l0 2 /K g /m in )
1,1 1,15 1,2 1,25 1,3 1,35 1,4 1,45 1,5 1,55 1,6
v (m/s )
s w 2 s w 1 E-tot= -34,664 + 66,4*v ;
R^2 = ,938 (s w 2)
E-tot = -134,607 + 137,007*v ; R^2 = ,977 (s w 1)
Figure 1. Relationship between the total energy expenditure (E-tot) and the swimming velocity (v) from two of the studied swimmers (sw). From the individual regression equations computed,
Ėtot was extrapolated or interpolated for 1.0 m.s
–1
, 1.2 m.s–1, 1.4 m.s–1 and 1.6 m.s–1, for both
swimmers.
Statistical procedures. Individual regression equations, describing the relation between the
Ėtot and the velocity were computed, as well as, its coefficients of determination and correlation.
The analysis of variance (ANOVA 1 factor) was used to detect statistically significant
differences between the bioenergetical parameters of the swimming strokes for a given velocity
(Ėtot x swimming technique) with Fisher’s PLSD as post-hoc test. The level of statistical
significance was set at p≤0.05.
3. RESULTS
Figure 2 presents the overall energy expenditure profile of the four swimming techniques. For
all of the selected velocities, the Freestyle was the most economic one (lowest Ėtot at all
observed that the alternated techniques (Freestyle and Backstroke) were more economical then
the simultaneous ones (Butterfly and Breaststroke).
Significant variations were observed on the Ėtot of the four strokes at the velocity of 1.0 m.s
-1
[F(3;22)=5.48, p<0.01], at the velocity of 1.2 m.s-1 [F(3;22)=12.41, p<0.01], at the velocity of 1.4
m.s-1 [F(3;22)=12.04, p<0.01] and at the velocity of 1.6 m.s-1 [F(3;22)=5.19, p=0.01].
10 20 30 40 50 60 70 80 90 100 110
E
-to
t (
m
lO
2
/K
g
/m
in
)
1.0 m/s 1.2 m/s 1.4 m/s 1.6 m/s
Free Fly Breas t Bac k
Figure 2. Energy expenditure (E-tot) profile, of the four swimming techniques, for the selected velocities.
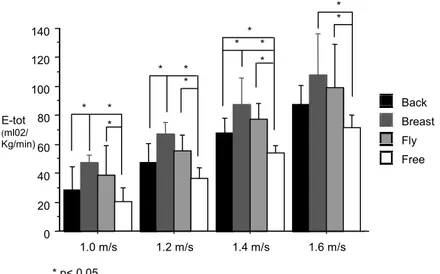
Figure 3 presents the post-hoc comparison of Ėtot at a given velocity. At the velocity of 1.0 m.s
-1
it was verified that the Ėtot was significantly higher in Breaststroke than in Backstroke (p=0.03),
in Breaststroke than in Freestyle (p<0.01) and in Butterfly than in Freestyle (p=0.02). At the
velocity of 1.2 m.s-1 the same profile was found. The Ėtot was significantly higher in Breaststroke
than in Backstroke (p<0.01), in Breaststroke than in Freestyle (p<0.01) and in Butterfly than in
Freestyle (p<0.01). Therefore, Breaststroke was the less economical swimming stroke and the
Freestyle the most economical one. In the next selected velocity, 1.4 m.s-1, the Ėtot was
significantly higher in Breaststroke than in Backstroke (p=0.01), in Backstroke than in Freestyle
(p=0.03), in Breaststroke than in Freestyle (p<0.01) and in Butterfly than in Freestyle (p<0.01).
This result confirmed the assumption that, at least at 1.4 m.s-1, the Freestyle was significantly
more economical than any other competitive swimming stroke. Finally, at the selected velocity
of 1.6 m.s-1, the Ėtot was significantly higher in Breaststroke (p<0.01) and in Butterfly (p=0.02)
* * *
* * *
* * * *
*
0 20 40 60 80 100 120 140
E-tot
(ml02/ Kg/min)
1.0 m/s 1.2 m/s 1.4 m/s 1.6 m/s
Free Fly Breast Back *
* p< 0.05
Figure 3. Comparison of total energy expenditure (E-tot) between the swimming stroke according to the Fisher’s Post-hoc test, in each selected velocity.
4. DISCUSSION
The purpose of this study was to compare the total energy expenditure of the four competitive
swimming strokes. The main finding of the study was that for all the selected velocities, the
Freestyle was the most economic stroke, followed by the Backstroke, the Butterfly and the
Breaststroke.
From the 23 swimmers evaluated, 8 were female swimmers. It is reported that swimming
economy is influenced by the swimmer’s gender. Female swimmers are more economical then
male swimmers (Onodera et al., 1999). Those differences are related to anthropometrical
characteristics, such as body density and hydrodynamic torque (Onodera et al., 1999). Female
swimmers can adopt a better horizontal body alignment and are affected by a lower
hydrodynamic torque (Zamparo et al., 1996; Yanai, 2001). In the present investigation, once the
sample was a convenience one, the effect of gender was only controlled later on. In
Breaststroke and Butterfly it was evaluated only one female swimmer in each stroke. In
Backstroke, there was no female swimmer evaluated. Therefore, in these strokes, the influence
of gender was minimal or non-existent. Only Freestyle an expressive number of female
swimmers were studied. In this swimming technique, 6 female swimmers were evaluates, but
this was also the swimming technique with the higher number of subjects studied. The absolute
number of female swimmers can under-estimate the Ėtot in Freestyle. However, comparing the
Ėtot in Freestyle according to gender, there were no significant differences in any swimming
velocity selected. For example, at the velocity of 1.6 m.s-1, the mean Ėtot for males swimmers
was 70.9±7.4 ml.kg-1.min-1 and for female swimmers was 71.8±9.8 ml.kg-1.min-1. Moreover,
there was no significant difference. Probably, elite female swimmers are becoming more
androgenous, with anthropometrical characteristics even more close to the ones observed in
elite male swimmers. Therefore, the comparison of the Ėtot of the several strokes seems not to
be significantly influenced by gender.
There are some studies in the literature concerned with the economy of the competitive
swimming techniques (e.g., Holmér, 1974; Pendergast et al., 1978; van Handel et al., 1988;
Chatard et al., 1990; Wakayoshi et al., 1995; 1996). However, the role of the anaerobic system
to the total energy expenditure is not always taken in account. The few exceptions are the
investigations developed by Vilas-Boas and Santos (1994), Vilas-Boas (1996) or Rodriguez
(1999). The percentual contribution of this bioenergetical system to the overall energy
expenditure should not be disregarded (di Prampero et al., 1978; Camus et al., 1984; Thevelein
et al., 1984; Camus and Thys, 1991).For example, Troup (1991) in a 200-m swim observed a
contribution of proximally 35% of the anaerobic system in freestyle, 30% in Backstroke, 39% in
Butterfly and 37% in Breaststroke. Nevertheless, well-trained swimmers use a greater
percentage of energy from the aerobic source (Troup et al., 1992). Therefore, the study of the
energy expenditure based exclusively on the oxygen consumption might both underestimate the
values and reduce the validity and utility of the measurements.
Most studies about cardiorespiratory parameters in swimming used Douglas bags or mixing
chamber gas analyses (e.g., Holmér, 1974; Lavoie and Montpetit, 1986; Chatard et al., 1990;
Wakayoshi et al., 1996).However, BxB analysis provides new insights into this field (Keskinen
et al., 2003). The feasibility of this system to measure the oxygen uptake of incremental free
swimming has been proved (Rodríguez et al., 2003). In this way, the BxB technology offers a
more feasible and convenient tool to explore cardiorespiratory adaptations during swimming
and in a more detailed manner (Keskinen et al., 2003; Rodríguez et al., 2003).
For all selected velocities, the Breaststroke and the Butterfly strokes were the swimming
techniques with higher Ėtot. These results are in agreement with data from other authors
(Holmér, 1974; Lavoie and Montpetit, 1986; Pendergast et al., 1978) who observed an obvious
distinction between the alternated and the simultaneous techniques. This might be related with
the higher variation of the swimmer’s impulse along the stroke cycle in both techniques (van
Tilborgh et al., 1988; Vilas-Boas, 1994; Barbosa et al., 2002). The high amplitude of the
swimmer’s impulse is explained by the extreme intracyclic variations of the swimming velocity
(Kornecki and Bober, 1978; Mason et al., 1992; Togashi and Nomura, 1992; Sanders, 1996;
Vilas-Boas, 1996; Barbosa et al., 2003). This phenomenon promotes high peaks of
accelerations and/or high peaks of deceleration. In the butterfly stroke, great intracyclic
(Barbosa et al., 2002). In breaststroke, great intracyclic variations are due to a great and
positive peak during the leg spreading and a negative peak during the leg’s recovery (van
Tilborgh et al., 1988; Vilas-Boas, 1994). Higher intracyclic variations of the impulse, such as the
ones described above, induce an additional mechanical work done by the swimmers and,
consequently, higher energy expenditure (Nigg, 1983).
Holmér (1974) presented a higher VO2, for a given velocity, for Butterfly stroke than for the
Breaststroke. Karpovich and Millman (1944) observed the same up to velocities of 2.5 feets.s-1.
At higher velocities, the Butterfly was more economical than the Breaststroke. Troup (1991)
confirmed that the Breaststroke was the least economical technique. The data from the present
study also revealed higher Ėtot for the Breaststroke than for the Butterfly stroke for all selected
velocities. The lower values observed by Holmér (1974) in butterfly, than in breaststroke, might
be related to the lower range of velocities studied. Whenever these two strokes were evaluated
at higher velocities, Breaststroke was the less economical. Probably, and even though the
energy expenditure changes with the change in swimming velocity due to the increasing drag,
the Breaststroke is the most affected (Kolmogorov et al., 1997). As the velocities increase, the
breaststrokers have less possibility to reduce the drag, especially during the non-propulsive
phase of the leg’s action. At low velocities, swimmers can have higher durations of the legs
actions, expending less energy (Takagi et al., 2003). But at higher velocities the swimmer
pushes both legs forward through the water more quickly (Chollet et al., 1999) leading to
significant increases of the speed fluctuation (Manley and Atha, 1992) and therefore in the
energy cost (Vilas-Boas, 1996).
The freestyle was the most economic competitive technique, followed by the backstroke, at all
selected velocities. This is a consensual result over several studies (Karpovich and Millman,
1944; Holmér, 1974; Lavoie and Montpetit, 1986; Pendergast et al., 1978; Troup, 1991). These
strokes are characterized by the lower intracyclic variations of the swimming velocity (Keskinen
and Komi, 1993; Cappaert et al., 1996; Alves et al., 1998). Consequently one other important
biomechanical repercussion is the low value of the swimmer’s impulses during the stroke cycle
to overcome inertial forces, in comparison to Breaststroke or to Butterfly stroke. Interestingly, in
Backstroke, Alves (1996) verified that the impulse in the final downsweep differed significantly
between a more economical and a less economical group of swimmers and correlated
significantly with the best time in a 100-m event.
One major question is how was the swimming economy evolution over the past decades. Are
the swimmers from 2000 more economical that the swimmers evaluated by Holmér [13] in the
70’s? First of all, it is important to emphasis that the evaluation procedures used by Holmér [13]
present study it was used a BxB apparatus, a swimming pool and under-water pace-lights.
Secondly, the parameters evaluated were not the same. Holmér (1974) measured the absolute
VO2; in the present study the parameter evaluated was the Ėtot. Nevertheless, it was attempted
a comparison between the absolute VO2 reported by Holmér (1974) and the absolute Ėtot from
the present investigation, at the swimming velocity of 1.0 m.s-1. This swimming velocity was
chosen, since it is the only common velocity selected by Holmér (1974) and the present study,
for all strokes. It was verified that, for all strokes, the swimming economy has increased in the
past decades. For Freestyle, the swimming economy increased 45.9%, for Backstroke 27.0%,
for Breaststroke 18.0% and for Butterfly 46.7%. Freestyle, Backstroke and Butterfly presented a
high increase over the past decades. In comparison to these swimming techniques,
Breaststroke was the one with lower increase. The phenomenon can be related to the strong
restrictions imposed in the rules of this swimming technique, in what concerns to its
biomechanical evolution.
The values of Ėtot in swimming seem to be a consequence of the specific mechanical limitations
of each swimming stroke. In other words, probably the Ėtot profile of each swimming technique
is related with its biomechanical characteristics (Kornecki and Bober, 1978; Nigg, 1983; Costill
et al., 1985; Smith et al., 1988; Wakayoshi et al., 1995; 1996). Nevertheless, few studies
focused on the relationship between swimming economy and swimming mechanics, as it was
the cases of Wakayoshi et al. (1995; 1996), Alves et al. (1996) or Vilas-Boas (1996).
5. CONCLUSIONS
As a conclusion, Ėtot of well-trained competitive swimmers was measured over a large range of
velocities utilizing a new BxB technique. Freestyle was shown to be the most economic among
the competitive swimming strokes, followed by the Backstroke, the Butterfly and the
The aim of this study was to measure the average resultant impulse (ARI) per phase of the
stroke cycle in butterfly and to analyse the variability of ARI according to the adopted breathing
technique. The sample was composed of 6 male Portuguese swimmers at national and
international level. 6 cameras were set, obtaining non-coplanar images (2 “dual media” images
included). The study comprised the kinematical analysis of stroke cycles of the butterfly stroke
(Ariel Performance Analysis System, Ariel Dynamics Inc., US) and a VCR (Panasonic, AG7355,
Japan) at a frequency of 50 Hz. The ARI was calculated using the mean horizontal acceleration
of the center of mass in each phase, the absolute duration of each phase and the body mass of
the swimmer. Comparing the ARI according to the breathing technique adopted in each phase
of the stroke cycle, we only observed significant differences in the outsweep. Comparing the
intra-cyclic variations of the ARI in the different breathing techniques adopted, the arm’s
recovery when compared with the remained phases presented a significantly lower ARI.
1. INTRODUCTION
The average resultant impulse (ARI) can provide us with useful information about the technical
proficiency of the swimmer (Alves, 1996). This is possible due to the ARI result from the
differences between propulsion and resistance (van Tilborgh et al., 1988).
One method to estimate the horizontal resultant impulse is through the swimming speed
profiles, knowing the time values and the swimmers body mass (Vilas-Boas, 1994). This
method has the benefit of allowing the calculation of the ARI per stroke phase (van Tilborgh et
al., 1988). In that way, knowing the strongest and the weakest points of the stroke cycle it is
possible to promote an improvement on the mechanics of the swimming technique in study. In
other words, the measurement of the ARI per phase can be a useful diagnostic tool helping the
optimisation of the co-ordination movement, the body position and the stroke mechanics of a
swimmer.
In fact, this approach has been used in several swimming techniques, such as the front crawl
(Alves, 1996), the backstroke (Alves, 1996) and the breaststroke (Persyn et al., 1986; van
Tilborgh et al., 1988; Vilas-Boas and Fernandes, 1993; Vilas-Boas, 1994). However, there
seems to be no investigation regarding the butterfly stroke.
Therefore the aim of this study was to estimate the ARI per stroke phase in Butterfly and to
analyse the variability of these parameter according to the breathing technique adopted by the
swimmers.
2. METHODS
Subjects. The sample was composed of 6 male Portuguese swimmers at national and
international level (19.0±2.0 years old; 67.367±6.571 Kg of body mass; 173.9±4.0 cm of height).
Data Collection. Two pairs of video cameras (JVC GR-SX1 SVHS and JVC GR-SXM 25
SVHS) were used for dual media videotape recording in non-coplanar planes. Both pairs of
cameras were synchronized in real time and edited on a mixing table (Panasonic Digital Mixer
WJ-AVE55 VHS and Panasonic Digital AV Mixer WJ-AVE5) creating one single image of “dual
media” as previously described by Vilas-Boas et al. (1997). One of the two supports was set in
one end walls 8.10m away from the trajectory of the swimmer. The second structure was set in
one of the lateral walls at 9.30m from the forehead wall where the first structure was installed
and at 10.20m from the trajectory of the swimmer. Another camera (Panasonic DP 200 SVHS)
DP 200 SVHS) was set 4.50m above the surface water. In these two last cases, the optical axis
was oriented in the direction of the displacement of the swimmers. In all the situations, all
cameras or pair of cameras recorded images of the swimmer in non-coplanar planes, different
from all the other cameras or pair of cameras. Synchronization of the images was obtained
using LED’s placed on the recording field of every camera or pair of cameras, which were
turned on regularly and simultaneously to initiate the synchronization every time the swimmer
entered the performance volume. This it was assume to be delimited by the calibration volume,
which was defined by a 3x3x3 meters cube. The calibration cube was marked with 32
calibration points. Each swimmer started in water and performed 3 sets of 3x25 meters in
Butterfly stroke at a constant velocity as close as possible from the maximal, using exclusively
frontal inspiration cycles, lateral inspiration cycles and non-inspiratory cycles in each set. The
study comprised the kinematical analysis of the different stroke cycles at the Butterfly stroke
using the “Ariel Performance Analysis System” from Ariel Dynamics Inc. (APAS) and a VCR
(Panasonic AG 7355) at a frequency of 50 Hz. It was used the Zatsiorsky’s model adapted by
de Leva (1996) which is composed by 22 anatomical points of reference. The 3D reconstruction
of the digitized images was performed using the “Direct Linear Transformation” procedure
(Abdel-Aziz and Karara, 1971). It was used a filter with a cut-off frequency of 5Hz, as suggested
by Winter (1990) for the analysis of the velocity and the acceleration of the center of mass. The
ARI was calculated using the mean horizontal acceleration of the center of mass per stroke
phase, the absolute duration of each phase and the swimmers body mass. The acceleration
and the duration values were obtained from the APAS. The mean horizontal velocity of the
center of mass did not presented significant differences between the 3 breathing styles.
Statistical Methods. Differences on ARI between the breathing techniques and in each
technique between phases were tested using the “ANOVA for repeated measures” (p≤ 0.05).
3. RESULTS AND DISCUSSION
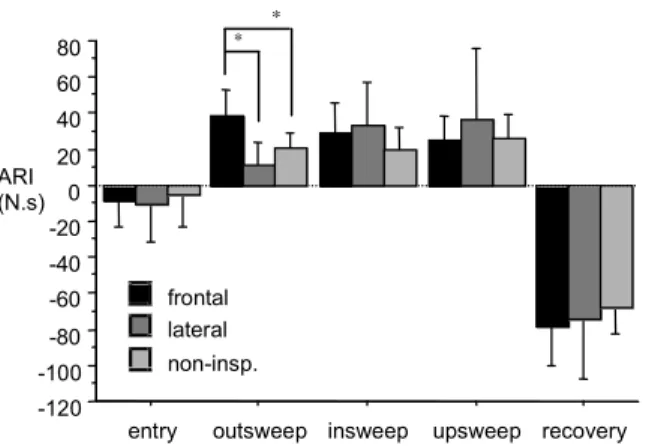
Figure 1 presents the comparison of the ARI in each swim phase between the three breathing
techniques. Comparing the ARI according to the adopted breathing technique in each phase of
the stroke cycle, we only observed significant differences in the outsweep. In this phase, the
ARI was significantly higher using the frontal inspiration cycles rather than the lateral inspiration
cycles [F(1;5)= 82.688, p=0.0003] or the non-inspiratory cycles [F(1;5)= 12.944, p=0.0156].
There was no significant differences between the three breathing techniques in the hands path
or in the relative duration of the outsweep, factors that could explain this results. However, the
absolute duration of the outsweep was higher using the frontal inspiration technique than the
others two, but without statistical significance. However, this is probably one explanation for the
In other way, the inspiration act might also have a little influence in the ARI. Doing the
inspiration through a cervical extension, it will promote an increase of the maximal body
cross-section area; and therefore, an increase of the Drag Force (Clarys, 1979). Therefore, the
swimmer needs a higher horizontal impulse in the subsequent phases, specially the outsweep,
to achieve mean horizontal velocities in the most propulsive phases of the stroke cycle, similar
to the ones observed in the other breathing techniques.
-120 -100 -80 -60 -40 -20 0 20 40 60 80
ARI (N.s)
entry outsweep insweep upsweep recovery non-insp.
lateral frontal
* *
* p≤0.05 between breathing technique
Figure 1. Comparison of the average resultant impulse (ARI), in each swim phase, between the breathing techniques.
Figure 2 presents the intra-cyclic variations of the ARI using the different breathing techniques.
Comparing the intra-cyclic variations of the ARI in the different breathing techniques, they were
quite similar. In all models, the recovery phase when compared with the remained phases
presented a significantly lower ARI. In fact, this is in agreement with the findings of Schleihauf
(1979), Schleihauf et al. (1988) and Mason et al. (1992). This might be explained due to the
body position in that phase, which is characterised by an increase of the maximal body
cross-section area and consequently a decrease of the mean horizontal acceleration of the center of
mass of the swimmer.
In the non-inspiratory cycles the ARI during the entry was significantly lower than in the
outsweep [F(1;5)=18.095, p=0.0081] and in the upsweep [F(1;5)= 8.370, p=0.0341]. In the
frontal inspiration cycles the ARI was significantly lower in the entry than in the outsweep
[F(1;5)= 22.458, p= 0.0052], in the insweep [F(1;5)= 33.349, p=0.0029] and in the upsweep
[F(1;5)=14.706, p=0.0129]. In other word, the entry was the second less propulsive phase of the
stroke cycle as reported previously by Schleihauf (1979), Schleihauf et al. (1988) and Mason et
al. (1992). This might be a result of the entry of the hands in the water as well as of the
previously entry from part of the body, increasing the wave drag and, therefore, promoting a
inspiration cycles in the outsweep was higher than in the insweep [F(1;5)= 0.568, p=0.4853]
and the upsweep [F(1;5)=1.547, p=0.2687]. Although this values did not present significant
differences, the higher ARI in the outsweep might be due to a higher absolute duration of this
phase in the frontal technique.
-100 -80 -60 -40 -20 0 20 40 60 ARI (N.s)
entry outsweep insweep upsweep recovery
+
-º º º
º
non-inspiratory
* p≤0.05 between one phase and the entry + p≤0.05 between one phase and the outsweep # p≤0.05 between one phase and the insweep - p≤0.05 between one phase and the upsweep
º p≤0.05 between one phase and the recovery
-120 -100 -80 -60 -40 -20 0 20 40 60 ARI (N.s)
entry outsweep insweep upsweep recovery
+ -º # º º º frontal inspiration
* p≤0.05 between one phase and the entry + p≤0.05 between one phase and the outsweep # p≤0.05 between one phase and the insweep - p≤0.05 between one phase and the upsweep
º p≤0.05 between one phase and the recovery
-120 -100 -80 -60 -40 -20 0 20 40 60 80 ARI (N.s)
entry outsweep insweep upsweep recovery
º º
º º
lateral inspiration
* p≤0.05 between one phase and the entry + p≤0.05 between one phase and the outsweep # p≤0.05 between one phase and the insweep - p≤0.05 between one phase and the upsweep
º p≤0.05 between one phase and the recovery
Figure 2. Comparison of the intra-cyclic variations of the average resultant impulse (ARI) using the different breathing techniques.
4. CONCLUSIONS
The butterfly stroke is a swimming technique where it is possible to observe some specific
intra-cyclic variations of the ARI due to greater reductions of this parameter during the arm’s
recovery. So swimmers must learn to reduce the drop of the ARI during the arm’s recovery by
increasing the propulsive force produced by the legs actions and adopting a more streamline
position of the body during this phase.
It seems that there is no significant differences in the ARI during almost every phases of the
stroke cycle, except for the outsweep, according to the breathing technique. So, the breathing
The purpose of this study was to identify the relationship between the bioenergetical and the
biomechanical variables (stroke determinants), through a range of swimming velocities, in
butterfly stroke. Three male and one female butterflier of international level were submitted to
an incremental set of 200-m butterfly swims. The starting velocity was 1.18 m·s-1 for the males
and 1.03 m·s-1 for the female swimmer. Thereafter, the velocity was increased by 0.05 m·s-1
after each swim until exhaustion. Cardio-pulmonary and gas exchange parameters were
measured breath by breath for each swim to analyze oxygen consumption and other energetic
parameters by portable metabolic cart (K4b2, Cosmed, Rome, Italy). A respiratory snorkel and
valve system with low hydrodynamic resistance was used to measure pulmonary ventilation and
to collect breathing air samples. Blood samples from the ear lobe were collected before and
after each swim to analyze blood lactate concentration (YSI 1500L, Yellow Springs, US). Total
energy expenditure (Ėtot), energy cost (EC), stroke frequency (SF), stroke length (SL), mean
swimming velocity (V) and stroke index (SI) were calculated for each lap and average for each
200-m stage. Correlation coefficients between Ėtot and V, EC and SF, as well as between EC
and SI were statistically significant. For the relation between EC and SL, only one regression
equation presented a correlation coefficient with statistical significance. Relations between SF
and V, as well as between SI and V were significant in all of the swimmers. Only two individual
regression equations presented statistically significant correlation coefficient values for the
relation established between V and the SL. As a conclusion, the present sample of swims
demonstrated large inter individual variations concerning the relationships between bioenergetic
and biomechanical variables in butterfly stroke. Practitioners should be encouraged to analyze
the relationships between V, SF and SL individually to detect the deflection point in SL in
function of swimming velocity to further determine appropriate training intensities when trying to
improve EC.