UNIVERSIDADE DO ALGARVE
NOTABLE DIFFERENCES IN GENE EXPRESSION BETWEEN
INJURED TURBOT (Scophthalmus maximus) AND BRILL
(Scophthalmus rhombus) SKIN
João Luis Correia Estêvão
Dissertação
Mestrado Integrado em Engenharia Biológica
Trabalho efectuado sob a orientação de Professor Doutor Paulino Martinez Portela
Professora Doutora Deborah Mary Power 2015
1
3
AGRADECIMENTOS
Esta tese de mestrado é fruto de trabalho em equipa de um ano. Porém, todo o meu conhecimento e trabalho elaborado provem de um esforço e caminho feito ao longo de seis anos. Várias pessoas contribuíram para que esta meta fosse atingida mas, principalmente, as que participaram nesta fase final foram, sem dúvida, as mais marcantes e importantes.
Quero, primeiro, agradecer às pessoas que me apoiaram ao longo destes seis anos pela compreensão, paciência e suporte incondicional que me deram durante toda esta fase. Portanto, quero agradecer aos meus amigos de sempre, nomeadamente ao Tiago Maria, ao Jerome Martins, ao Ricardo Rodrigues, ao Luís Gomes e ao Fábio Bravo. Sem eles, provavelmente, não teria chegado até aqui.
Quero também agradecer a quem me apoiou já nesta fase final do mestrado que, para mim, têm tanto significado na minha vida como os meus amigos de sempre. Quero agradecer ao Jorge Pontes, à Vanda Baltazar, à Marta Gonçalves, à Sandra Maceiras e à Laura Silva pelo apoio antes e durante esta etapa final do meu curso. Foram também como uma família para mim.
Outras pessoas às quais queria agradecer e que são ainda mais marcantes são a toda a família Pinheiro do Porto, que sempre tão bem me têm acolhido que me considero um integrante da família. A eles, um enorme obrigado por sempre me receberem de braços abertos.
Outro agradecimento muito grande e especial é a uma pessoa que, para além de grande amiga, é como uma irmã para mim. Quero agradecer especialmente à Elena Pimentel por sempre me ter apoiado durante a minha estadia inicial fora do meu país e me orientado e compreendido em todas as minhas fases da minha estadia. Ainda hoje continua apoiando-me incondicionalmente e sempre lhe estarei grato por sempre me dar esperança e força nas fases mais complicadas, mas também por grandes momentos de amizade e em família partilhados.
Quero agradecer a toda a equipa dos departamentos de Genética e de Anatomia Patológica da Faculdade de Veterinária de Lugo por me terem aceitado, apoiado, ajudado e nunca terem perdido a confiança em mim. Foi um enorme prazer e sorte poder ter trabalhado com todos pois, para além de excelentes profissionais, são como uma família unida fazendo sentir-me como se estivesse em casa.
Quase finalizando, quero dar o meu eterno agradecimento aos professores Deborah Power e Paulino Martinez por sempre terem acreditado e confiado em mim e nas minhas capacidades, embora existisse momentos em que não acreditasse que as tinha. À professora Deborah Power agradeço imenso o facto de me ter aberto as portas para o futuro, confiando-me este bonito projeto e de não ter desistido de mim. Ao professor Paulino Martinez os agradecimentos são eternos, pois apoiou-me, ajudou-me durante todo o projeto, orientou-me da melhor maneira possível, teve uma enorme paciência, camaradagem e capacidade de trabalho. Sinto que um dia gostaria de ter estas grandes qualidades profissionais e humanas que estas enormes pessoas têm.
Por fim, quero agradecer ao pilar da minha chegada a esta meta, que é a minha família. Portanto, quero agradecer ao meu avô, José de Brito Correia, à minha mãe, Ana Maria Valentim Correia Estêvão e à minha irmã, Ana Luisa Correia Estêvão Rodrigues, por todo o apoio financeiro, emocional e pela educação e experiência de vida que sempre partilham comigo e que faz de mim hoje o homem que sou. A eles devo tudo o que tenho hoje.
5
ABSTRACT
The skin, the largest organ of fish’s body and first barrier against external agents, plays a crucial role against environmental aggressions and is decisive in communication between individuals. Cutaneous lesions are common in fish and may result in an open door for infectious agents and originate osmotic stress, which can be life threatening for the animal. Turbot (Scophthalmus maximus) and brill (Scophthalmus rhombus) are two closely related congeneric species with striking differences in their skin, since turbot presents tubercles instead of the scales found in brill. In this work, gene expression analyses were performed in order to analyze the genetic differences in the skin response between the two species. Skin scraping areas (72 h after injury) from three biological replicates of each species were compared with normal skin areas from the same individuals. A previously reported 4x44k Agilent turbot microarray was employed, after evaluating its suitability by comparison of the base sequence of common genes using bioinformatics. Skin-related genes from previous studies (1564 sequences) were taken as a reference to screen the turbot database and the oligo-probes in the microarray. Among them, 584 (~37%) were present in the turbot database (e-value < 9x10-20) and 326 (~21%) contained oligo-probe in the microarray, a notable result since the microarray was especially enriched with immune-related organs. Genes with a significant fluorescent signal in the microarray (>200 fluorescence units) were identified in each (turbot: 15,739; brill: 12,393) and in both species (10,065). Among them, 1750 differentially expressed genes (t-test p-value p<0.005; log2 ratio <-2 and >2) were detected in brill, 1461 in turbot, and 885 showed differences between species, respectively. These results strongly suggest: 1) the turbot microarray is suitable for gene expression analysis in brill, and 2) a notable different occurs in the response of the skin to damage in the two species.
7
RESUMO
A pele dos vertebrados tem um papel crucial na separação do “interior” do indivíduo do “exterior”, funcionando como uma interface para comunicação e contacto. Esta funciona tanto como barreira contra agentes microbiológicos, físicos e químicos/bioquímicos, bem como um órgão complexo que desempenha funções essenciais em conjunto com os seus apêndices, tais como, termorregulação, síntese hormonal, funções sensoriais, metabolismo, homeostasia osmótica, comunicação entre indivíduos, elaboração de estruturas especiais e produção de várias substâncias específicas. Lesões cutâneas e doenças associadas são mais frequentes em peixes do que em vertebrados terrestres e correspondem a um dos fatores primários que condicionam a estrutura da sua pele. Estas, para além de serem, geralmente, pouco específicas e indicativas de uma doença local ou da manifestação de uma doença sistémica, podem originar stress osmótico e representam uma entrada a agentes infeciosos que pode ser ameaçador à saúde destes seres-vivos.
A pele dos peixes, tal como em vertebrados, é composta por três camadas principais: Epiderme, derme e hipoderme. Para além disso, estas camadas dividem-se em vários estratos sendo, em teleósteos, a epiderme composta por cutícula e membrana basal; a derme composta por estrato esponjoso e estrato compacto; e a hipoderme correspondente à tela subcutânea. A epiderme funciona, portanto, como a primeira barreira molecular do sistema imunitário. As escamas são o componente primário do esqueleto da derme em peixes e em teleósteos apresentam-se como placas flexíveis calcificadas incluídas parcialmente entre as bolsas das escamas e orientadas posteriormente (escamas elasmoides). Para além disso, as escamas representam uma reserva de fonte de cálcio que pode ser utilizada em períodos de fome ou de pré-desova, por exemplo. A derme fornece ainda uma integridade estrutural e força de tensão ao integumento, resultando numa rigidez à flexão e maior eficiência à excursão do esqueleto e, assim, numa locomoção mais eficiente. Por outro lado, a hipoderme é menos desenvolvida em peixes, funcionando como uma reserva de energia, uma barreira à difusão de fluidos e como um amortecedor dos choques.
A resolução das lesões cutâneas é altamente dependente da temperatura. Contudo, a cobertura e regeneração epidérmica, em peixes, é menos afetada pela temperatura, sendo a epitelização terminada entre as 6 e 8 horas após a lesão. Depois disso, o processo lento de reconstituição epitelial toma lugar e, por fim, a reconstituição da derme. As lesões
8
cutâneas têm, portanto, um tempo de regeneração da pele de aproximadamente 35 dias. A regeneração das escamas acontece de um modo similar ao da sua ontogénese e tem começo após o encerramento da lesão. Estas desenvolvem-se dentro das bolsas das escamas e têm um crescimento geralmente contínuo, com algumas influências e restrições causadas por fatores intrínsecos e extrínsecos, tais como, períodos de pouca atividade e períodos de stress e de deficiência de cálcio.
Apesar da grande importância da pele em peixes como barreira imune e como tecido regenerante, pouco se conhece acerca dos genes e processos moleculares envolvidos no processo de resposta imunitária e de regeneração deste tecido.
O rodovalho (Scophthalmus rhombus (Linnaeus, 1758)) e o pregado (Scophthalmus maximus (Linnaeus, 1758)) são duas espécies congéneres de peixe plano (Pleuronectiformes) fortemente relacionadas, tanto relativamente à sua distância genética, bem como ao seu cariótipo e à morfologia e função da pele. No entanto, estas duas espécies apresentam uma notável diferença na sua pele, devido ao facto do rodovalho conter escamas e o pregado conter tubérculos.
Neste trabalho analisou-se as diferenças genéticas ocorrentes durante a resposta da pele a uma perturbação entre as duas espécies, 72h após uma escarificação, tomando uso de um oligo-microarray enriquecido com genes relativos à resposta imunitária, previamente desenhado para pregado.
Uma lista inicial de 1564 genes que se expressam em pele de peixe, provenientes de estudos anteriores, foi usada para verificar a presença de genes da pele na base de dados do pregado e no microarray e também a sua adequação para a avaliação dos perfis de expressão génica em rodovalho. De entre estes, 584 genes (~37%) estão presentes na base de dados do pregado e 326 (~21%) contém oligonucleótido no microarray. Esta é uma notável presença de genes relacionados com a pele no microarray e na base de dados. Doze indivíduos (6 rodovalhos e 6 pregados), mantidos nas suas respetivas condições de cultivo, sofreram uma escarificação na qual a zona mais exterior da pele foi retirada. Em seguida, foram mantidos nas suas respetivas condições de cultivo durante 72h. A esta altura, amostras de pele da zona ferida e da zona normal foram colhidas para análise de expressão génica, bem como amostras de pele e músculo de ambas as zonas para avaliação histológica da qualidade das amostras. Posteriormente, seis indivíduos (3 por espécie) foram escolhidos para a análise de expressão génica após consideração da qualidade das amostras de ARN extraído e de secções de pele, tendo como base de consideração amostras com o melhor número de integridade do ARN, com um dano
9
moderado na pele (remoção de epiderme e derme superior) e com um menor número de artefactos possível.
Após hibridização das amostras no microarray e normalização dos dados, um filtro de intensidade de fluorescência (> 200 unidades de fluorescência) foi aplicado de modo a evitar a presença de valores falsos positivos. Portanto, o número de genes com um sinal de fluorescência consistente foi de 15739 genes expressados em pregado, 12393 genes expressados em rodovalho e 10065 genes expressados em ambas as espécies. Um número considerável de genes expressados em pregado é observável, como seria de esperar. No entanto, observou-se também um número notável de genes expressados em rodovalho que, em conjunto com a notável presença de genes relacionados com a pele evidenciada anteriormente, demonstram uma forte viabilidade do microarray na análise dos genes expressados em rodovalho e também a adequação do microarray para rodovalho e para genes relacionados com a pele. Para além disso, denotou-se também uma apreciável quantidade de genes partilhados em ambas as espécies, o que corrobora a proximidade genética entre rodovalho e pregado evidenciada em estudos anteriores.
Na identificação dos genes diferencialmente expressados em cada espécie e entre espécies elaborou-se duas listas para cada análise executada, sendo estas baseadas no valor do log2 razão e no teste t de student. Identificaram-se, em resposta à lesão, 1750 genes diferencialmente expressados em rodovalho, 1461 em pregado e 885 genes demonstraram diferenças de expressão entre espécies. Estes resultados sugerem uma maior resposta em rodovalho do que em pregado e uma diferença observável na resposta a uma perturbação na pele entre ambas as espécies. Contudo, salientou-se o facto de o pregado apresentar um maior desvio-padrão entre os valores de expressão génica das réplicas biológicas (indivíduos) do que o rodovalho, o que pode ter sido causado pela diferença estrutural na pele do pregado em relação ao rodovalho e que pode resultar numa análise menos rigorosa para esta espécie.
Os 326 genes referentes à lista inicial de 1564 genes relacionados com a pele e que estão presentes no microarray foram usados, em conjunto com genes já identificados em estudos anteriores, para verificar os seus níveis de expressão em cada espécie e quais se diferenciam entre espécies. Para além disso, verificou-se a função putativa dos genes mais diferencialmente expressados em cada espécie e entre espécies e também os termos de Ontologia Génica e metabolismos aos quais estes eram classificados. No total, 7 genes em pregado, 3 em rodovalho e 8 entre espécies não foram associados a qualquer termo de Ontologia Génica. Os resultados observados em pregado demonstraram uma inibição nas
10
funções de desenvolvimento e organização da pele e do esqueleto e um maior dispêndio em funções relativas à resposta imunitária. Em rodovalho observou-se um dispêndio em funções relativas à regeneração epitelial, enquanto funções relativas a desenvolvimento da musculatura foram inibidas. As funções que se diferenciaram entre as espécies foram regeneração, reparação e organização da pele.
Usaram-se 9 genes para validação dos resultados do microarray em pregado e 6 genes para validação em rodovalho, através de um PCR em tempo real. Embora o número de genes utilizados tenha sido pequeno, a alta e significante correspondência observada entre o PCR e o microarray sugere a consistência dos resultados obtidos para ambas as espécies.
Este estudo confere a proximidade genética existente entre rodovalho e pregado, mostrando também diferenças genéticas na regeneração da pele, possivelmente relacionadas com a sua diferente estrutura.
11 INDEX ABSTRACT ... 5 1. ABREVIATIONS ... 13 2. INTRODUCTION ... 15 2.1.SKIN STRUCTURE ... 15
2.2.CUTANEOUS INJURIES AND HEALING ... 19
2.3.MOLECULAR AND GENETIC BASIS OF SKIN REGENERATION IN FISH ... 21
2.4.TURBOT AND BRILL: BIOLOGY AND COMMERCIAL INTEREST ... 21
2.5.OBJECTIVES ... 24
3. MATERIALS AND METHODS ... 26
3.1.BIOINFORMATIC STRATEGY USED TO CONFIRM THE TURBOT MICROARRAY HAS A GOOD REPRESENTATION OF TRANSCRIPTS CHARACTERISTIC OF SKIN ... 26
3.2.BIOLOGICAL SAMPLING ... 26
3.3.RNA PREPARATION AND SAMPLE SELECTION ... 27
3.4.MICROARRAY HYBRIDIZATIONS AND ANALYSIS ... 27
3.5.FUNCTIONAL ANNOTATION OF THE MOST DIFFERENTIALLY EXPRESSED GENES 29 3.6.RT-PCR MICROARRAY VALIDATION ... 30
3.7.HISTOLOGICAL QUALITY ANALYSIS ... 31
4. RESULTS AND DISCUSSION ... 32
4.1.BIOINFORMATICS ANALYSIS ... 32
4.2.MICROARRAY GENE EXPRESSION ANALYSIS ... 33
12 5. CONCLUSIONS ... 45 6. REFERENCES ... 46 7. ANNEXES ... 51 7.1.ANNEX 1 ... 51 7.2.ANNEX 2 ... 52 7.3.ANNEX 3 ... 66 7.4.ANNEX 4 ... 66 7.5.ANNEX 5 ... 66 7.6.ANNEX 6 ... 67
13
1. ABREVIATIONS
BLAST Basic local alignment search tool
Bp Base pairs
cDNA Complementary deoxyribonucleic acid
cRNA Complementary ribonucleic acid
Cy3-CTP Cyanine 3 - cytidine triphosphate
DAVID Database for annotation, visualization and integrated discovery
DB4 Turbot 4 database
DB5 Turbot 5 database
DE Differentially expressed
Eda Ectodysplasin
FGF Fibroblast growth factor
GO Gene ontology
H-E Haematoxylin-eosin
HM Turbot treatment sample
hs Brill treatment sample
ID Identity
LOESS method Local regression method
MeV MultiExperiment Viewer
NCBI National Center for Biotechnology Information
PBS Phosphate-buffered saline
PCR Polymerase chain reaction
PFA Paraformaldehyde
QPCR Quantitative-polymerase chain reaction
RIN RNA integrity number
RNA Ribonucleic acid
RPS4 Ribosomal protein S4
RT-PCR Real time-polymerase chain reaction
sa Brill control sample
SM Turbot control sample
15
2. INTRODUCTION
Biological Engineering is featured by engineering and biological knowledge which serve for the development of systems, methodologies and processes that take advantage of biological components for specific applications which points to answer for the various society problems (Universidade do Algarve 2013). Animal production and improvements through breeding and husbandry when considered in the context of aquaculture production are part of the current developments in blue biotechnology. The present study that takes a molecular and morphological approach to studying skin repair in teleosts provides the basis for future studies targeting the barrier function of skin and provides essential knowledge that can be used for maintenance of healthy fish and in this way improving production. The next points will give an overview of the basic structure of skin in vertebrates and, specifically, in teleosts. Moreover, it will introduce the skin repair and regeneration theme by giving a histological overview of the general process. An information about the species studied in this work togheter with the actual molecular knowledge about the skin repair and regeneration and the aim of the work is also provided.
2.1. Skin structure
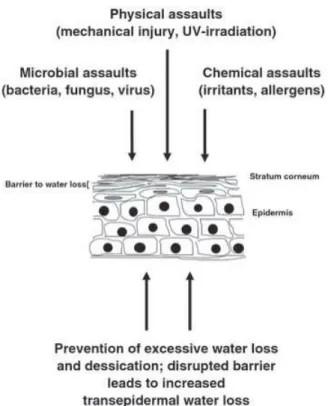
The vertebrate’s skin has a crucial function in separating the individual’s ‘inside’ from its environment working as an interface for communication and contact with the ‘outside’. As a barrier, it protects from microbiological, physical and chemical/biochemical agents (Figure 2.1). It is a complex organ, that displays various essential functions in cooperation with its appendages, ranging from thermoregulation, sensory functions and hormone synthesis, as well as metabolism and maintenance of fluid balance, osmotic homeostasis, inter-individual communication by visual signals (pigments, hair), elaboration of special structures (claws, nails, hair, fins) and production of various specific substances (e.g. pheromones, antimicrobial peptides) through glandular secretion (Goldsmith 1991; Proksch et al. 2008; Rakers et al. 2010). Structure and function of fish skin is, in general, similar to that of vertebrates. The differences lie on the existence of an aquatic external milieu which determines the adaptation of the organism to the physical, chemical and biological properties, and also on the particular
16
evolutionary history of each species or taxonomic group. For these reasons, cutaneous lesions and associated diseases are more common in fish than in terrestrial vertebrates and constitute one of the primary factors which constrain skin structure of fish. These lesions are generally nonspecific and may be indicative of local disease, restricted to the integument, or a manifestation of a systemic disease (Groff 2001). Furthermore, an epidermal damage originates an osmotic stress and represents an open access for the infectious agents that can be life threatening for the fish (Ferguson 2006).
Figure 2.1. Representation of vertebrate’s skin protective and preventive function (Proksch et al. 2008).
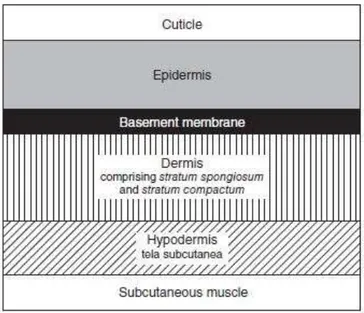
The general structure of the fish integument is common with what is found in higher vertebrates. It is composed of three principal layers: epidermis, dermis (or corium), and hypodermis (Harder 1976). The thickness and cellular composition of the three layers is, however, highly variable and dependent on various intrinsic and extrinsic factors, including species, development and life stage, location of the integument, season, sex, reproductive condition, nutrition, water quality, and general health status of the fish (Harder 1976). In teleosts, the skin can be divided into various strata with i) the epidermis being the most external layer and is composed of a stratified squamous epithelium containing the stratum germinativum (cuticle) and stratum basale (basement membrane) (Harder 1976; Whitear 2009; Whitear 1977); ii) the dermis, the intermediate stratum,
17
composed of the stratum spongiosum/ stratum laxum (external dermis) and stratum compactum (basal dermis) (Harder 1976); and iii) the hypodermis, the inner stratum or tela subcutanea (Figure 2.2) (Bullock & Roberts 1974).
Figure 2.2. Schematic representation of the organization of teleost fish skin (Copied from Bullock & Roberts 1974).
The cuticle includes epithelial cells and mucous secretions, and it is a complex of cell protoplasm, sloughed cells and secreted mucus. The cuticle contains specific immunoglobulins and lysozyme, and free fatty acids and is the first antipathogen molecular barrier of the immune system. It has species specific physical consistency (Speare & Mirailimi 1992; Roberts 2012).
Malpighian cells are the most frequent cell type in the epidermis showing general rounded structure except the outermost ones, which are flattened horizontally. Scattered among the Malpighian cells, mucus-secreting cells are found in the epidermis of all teleosts. For instance, goblet cells are observable in the middle layer of the epidermis and, sometimes, near the basement membrane. However, as they approach to the surface their size and secretion content raises. Their abundance vary considerably with body location and species. Another type of cells may be found in some teleosts, which are known as club cells. These are big cells roundly shaped and can be found in the middle and lower layers of the epidermis. Therefore, the epidermis of fish is a stratified squamous epithelium covering the body surface and part of the tail and fins (Bullock & Roberts 1974; Roberts 2012). The viability and mitotic division capacity of the cells, even at the
18
outermost layer, contrasts with the non-viability of the outermost cells in mammals epidermis, make them more prepared for regeneration and healing (Ferguson 2006). Other cell types can be found in the normal epidermis but less frequently, like lymphocytes and macrophages, related to the immune system (Roberts 2012).
In the dermis, the stratum spongiosum is a loose network of collagen and reticulin fibers contiguous with the basement membrane of the epidermis (Craig et al. 1987; Harder 1976; Bullock & Roberts 1974). Pigment cells, like melanophores, xantophores and iridophores; cells of the scale beds and scales are present in this layer (Craig et al. 1987; Harder 1976; Roberts 2012; Ferguson 2006). Melanophores are responsible for the dark coloration, although they have the capacity of dispersing and concentrating their melanin pigment, changing color in response to external stimuli or stress. Xantophores are other type of pigment cells regularly present in teleosts which give the yellow pigmentation due to their organic solvent-soluble pigments content. The cells responsible for white and silver coloration in fish are called iridophores and contain purines, usually guanine, which are presented as plates of reflecting material with a variable thickness and arranged within the cell cytoplasm in parallel arrays (Bullock & Roberts 1974; Denton & Nicol 2009; Groff 2001). The scales are the primary component of the dermal skeleton in fish and, in teleosts, are calcified flexible plates which are partially included within the ‘scale pockets’ and oriented backwards (Harder 1976; Lagler et al. 1962; Roberts 2012). The most common scales are bony-ridge scales or elasmoid scales. These include two main types: cycloid and ctenoid scales. Cycloid scales are thin, translucent, circular disks with a smooth or entire exposed posterior margin. Ctenoid scales bear multiple comb-like or tooth-like projections, referred as ctenii, on their posterior external edge which makes them different from cycloid scales. Both types present growth rings on their surface that, in many species, can be related to the age of the fish. Scales are constituted by collagen fibers interspersed with a matrix of albuminoid materials with deposition of hydroxyapatite crystals. This fact makes scales a ready source of calcium to be reabsorbed during periods of starvation or pre-spawning in preference to the skeletal reserves (Harder 1976; Roberts 2012; Ferguson 2006). Great inter-species differences in teleost skin can be observed relative to the presence/absence of scales, since some species present no scales, others present numerous large eosinophilic club cells instead of scales and others have conical tubercle plates as a structural modification of elasmoid scales (Faílde et al. 2014; Zylberberg et al. 2003; Ferguson 2006). Besides this relevant description about the upper layer of the dermis, the lower layer (stratum compactum) has a relevant function in
19
the fish skin too. The relatively acellular nature and dense perpendicular collagen bundles with occasional elastic fibers composition of the basal dermis provides the structural integrity and tensile strength of the integument which counters or resists the contraction of skeletal muscle, resulting in flexural stiffness and more efficient excursion of the skeleton, and consequently more efficient locomotion (Long et al. 1996).
The hypodermis is less developed in fish and generally composed of a vascularized, loose adipose tissue that is often a common site for infection (Ferguson 2006). Lipids from this layer include various phospholipids and cholesterol esters which works as an energy reserve during inanition, a barrier to the diffusion of fluids, and a shock absorber (Mittal et al. 1976). Moreover, in certain fish, hypodermis may contain a mucous connective tissue named as mucochondroid tissue (Benjamin 1988). This tissue presents an abundant pale-staining glycosaminoglycan or glycoprotein matrix that contains a variable amount of fibroblasts, collagen, and blood vessels, being more frequent in locations that are associated with underlying bone (e.g. scales) and other sites of the integument (Groff 2001).
2.2. Cutaneous injuries and healing
Cutaneous lesions healing and resolution is highly controlled by temperature, and the process in fish is similar to that in higher terrestrial vertebrates, but faster, since epidermal covering and healing in fish is less affected by temperature, indicating the importance of epidermal integrity in this group. However, healing of the dermis is completely conditioned by temperature being, consequently, a slower process (Bullock & Roberts 1980; Anderson & Roberts 1975; Ferguson 2006; Roberts 1975; Roberts & Bullock 1976). Soon after an injury, a dark pigmentation generally occurs at the periphery of the lesion, there is a loss of intercellular connections between Malpighian cells, and re-epithelization starts immediately through recruitment and migration of Malpighian cells from the margins and over the surface of the dermal limit to the lesion (Groff 2001; Roberts 2012). Hyperplasia of mucous cells, followed by overproduction of mucus, may occur in the adjacent normal epidermis, and an exudate of blood and inflammatory cells immediately occupies the lesion. Once a single layer of epidermis is quickly formed, local hyperplasia of epidermal cells, proliferation of other cell types, increase of epidermal lymphocytes, and thickness reduction of the adjacent normal epidermis occurs (Mittal &
20
Munshi 1974; Quilhac & Sire 1999; Roberts 2012). The complete re-epithelization time is estimated around 4 to 6 hours (Mittal & Munshi 1974; Mittal et al. 1978). Thereafter, the slower process of epithelial cover reconstitution starts with a temperature-dependent normal mitotic proliferation, accompanied by formation of a fibrous scar and, then, reconstitution of the dermis (Bullock & Roberts 1980). Formation of dermal and hypodermal granulation tissue occurs within 72 to 96 hours after the injury. After approximately 25-35 days, epidermal and dermal/ hypodermal injuries are completely healed, respectively (Mittal & Munshi 1974; Mittal et al. 1978). Regeneration of elasmoid scales is performed in similar way as it happens in their ontogenesis and follows the closure of lesions (Sire & Géraudie 1984). In their ontogenesis, scales develop from dermal aggregations of cells (differentiated fibroblasts or scleroblasts) that form a scale-papillae/ scale-platellet within a dermal scale-pocket (Kobayashi et al. 1972; Sire & Géraudie 1984; Sire et al. 1997; Waterman 1970). The primitive scale anlage subsequently develops within the scale-papillae and is composed of multiple calcified layers, being the external layer formed by superficial scleroblasts and the internal layer/ basal plate formed by deep scleroblasts. Scleroblasts produce collagen fibers that are calcified by inotropic deposition of mineral within the interfibrillary matrix and the peripheral ones are responsible for the increase in diameter of the developing scale (Brown & Wellings 1969; Lanzing & Wright 1976; Schönbörner et al. 1979; Sire & Géraudie 1984; Sire et al. 1997; Zylberberg & Nicolas 1982). The fast growth of the scale proceeds from the nuclear zone, and occurs along the outer margins and beneath the scale. The nuclear zone is centrally located but assumes eccentric position near the anterior margin with enlargement of the scale. Their growth is generally continuous with some influences and restrictions by various intrinsic and extrinsic factors, like inactive periods such as winter, during periods of stress and calcium deficiency (e.g. reproduction) which can even lead to scale reabsorption, as previous reported (Harder 1976; Moyle & Cech 1988; Schönbörner et al. 1979). The repair and resolution of a skin injury may, however, be inhibited by the presence of contamination by bacteria in the ulcerated surface (Bullock & Roberts 1980). Usually, scar formation in the skin does not occur, appearing only with severe ulcerative lesions (Groff 2001).
21
2.3. Molecular and genetic basis of skin regeneration in fish
Despite the great importance of the fish skin as an immune barrier and as a fast regenerating tissue, little is known about the genes and molecular processes involved in the process of immune response and regeneration of this tissue, most available information coming from histological and pathological observations. Although in recent years, the number of molecular studies in the fish skin has increased (Casas et al. 2013; Vieira et al. 2011; Liu et al. 2013; Long et al. 2013; Micallef et al. 2012; Campinho et al. 2007), no study has been carried out before on the skin regeneration of brill and turbot. For instance, it is known that the Fibroblast Growth Factor (FGF) signaling pathway and the ectodysplasin (Eda) pathway are relevant for appendages development and likely for skin regeneration in some fish species (Rohner et al. 2009; Harris 2012; Harris et al. 2008; Mikkola & Thesleff 2003; Colosimo et al. 2005; Kondo et al. 2001). Moreover, immune-related genes are essential to control the progression of diseases, and in this regard, mediators like tumor necrosis factor (TNF) have shown to play a fundamental role for the innate and adaptive immune response of skin (Alvarez-Pellitero 2008). Finally, controlling osmotic imbalances is essential to keep body homeostasis, and members of the pituitary growth hormone family of peptide hormones (e.g. growth hormone receptor) work as crucial modulators of osmoregulation, growth, and metabolism (Pierce et al. 2007). Beyond these gene specific studies, a recent molecular study demonstrated the relevance of the first 72h post injury, which shows a majority and variety of molecular processes occuring together (Vieira et al. 2011).
2.4. Turbot and brill: biology and commercial interest
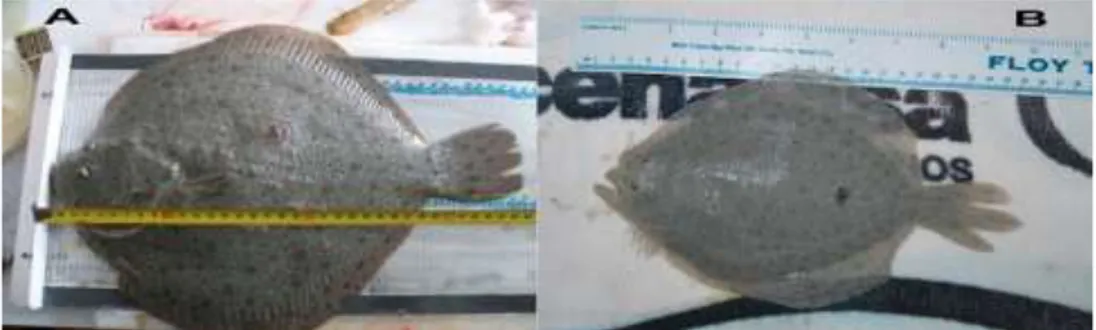
Brill (Scophthalmus rhombus (Linnaeus, 1758)) and turbot (Scophthalmus maximus (Linnaeus, 1758)) are two closely related congeneric flatfish (Pleuronectiformes) species (Froese & Pauly 2015; Wheeler 1992; Pardo et al. 2005a; Azevedo et al. 2008) based on their low genetic distance (Blanquer et al. 1992; Bouza et al. 2002), almost identical karyotype (Pardo et al. 2001) and low phylogenetic distance (Pardo et al. 2005b) (Figure 2.3). Morphology and function of the skin is very similar, but with a striking difference because brill presents cycloid scales (Muus & Nielsen 1999) while turbot has instead conical tubercle plates in their skin (Faílde et al. 2014; Zylberberg
22
et al. 2003) (Figure 2.4). Their distribution is very similar, being present in the East and Northeast Atlantic Ocean from Northwest Africa (Morocco) to the Arctic Circle. They are also present in the Baltic, Mediterranean and Black Sea (Froese & Pauly 2015). These flatfish have a demersal lifestyle characterized by living on sandy and muddy bottoms at varying depth (Besyst et al. 1999; Rodríguez Villanueva & Fernández Souto 2009). Moreover, they have similar ecological characteristics, with differences observed in the size at hatching, in the timing and duration of the spawn period, and in the optimal water conditions (Van der Hammen et al. 2013). The aquaculture production of these species started in the seventies (Daniels & Watanabe 2010) and has suffered a substantial increase, especially that of turbot, in the last few years, being 38.9% higher in 2013 than in 2011. Moreover, Portugal produced a remarkable amount of 4,400 tonnes in the year 2012, showing a strong and important production increase (FAO 2015).
23 Figure 2.3. Phylogenetic distance between turbot and brill (Pardo et al. 2005b).
Figure 2.4. Young adults turbot (A) and brill (B). Photos were taken during the experiment.
24
2.5. Objectives
The aim of this study is the analysis of the genetic differences in the skin response to injury between turbot and brill, 72h after a skin injury, using a previously designed immune-enriched 4x44k Agilent® oligo-microarray (Millán et al. 2010; Millán et al. 2011; Pardo et al. 2012).
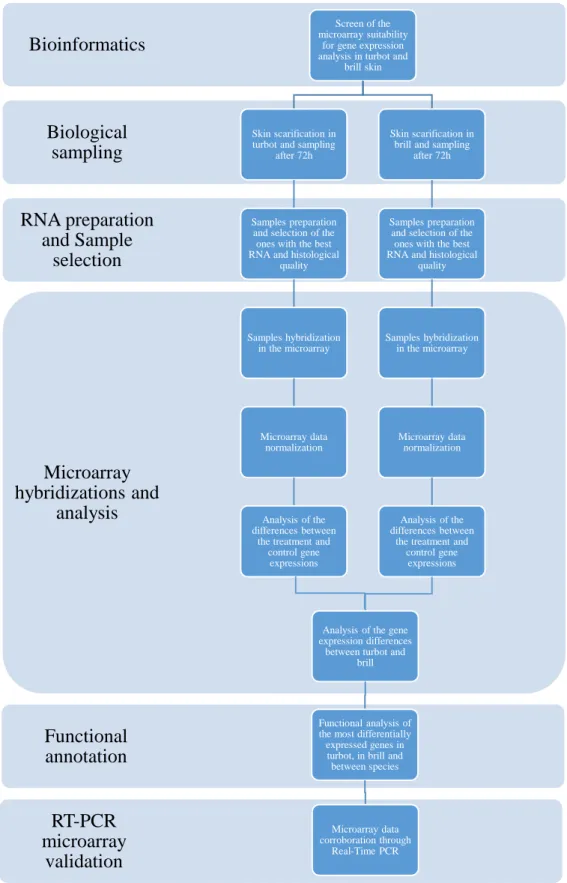
The work was divided in various tasks, being i) screen of the microarray suitability for brill and for skin-related genes using bioinformatics; ii) skin scarification in turbot and brill and sampling after 72h; iii) samples preparation and selection of the ones with the best RNA and histological quality; iv) samples hybridization in the microarray; v) microarray data normalization; vi) analysis of the differences between the treatment and control gene expressions in turbot and in brill; vii) analysis of the gene expression differences between turbot and brill; viii) functional analysis of the most differentially expressed genes in turbot, in brill and between species; ix) microarray data corroboration through Real-Time PCR. A simplificated representation of the work is represented in the Figure 2.5.
25 Figure 2.5. Flow diagram representing the project work plan.
RT-PCR microarray validation Functional annotation Microarray hybridizations and analysis RNA preparation and Sample selection Biological sampling Bioinformatics Screen of the microarray suitability
for gene expression analysis in turbot and
brill skin
Skin scarification in turbot and sampling
after 72h
Samples preparation and selection of the
ones with the best RNA and histological
quality Samples hybridization in the microarray Microarray data normalization Analysis of the differences between
the treatment and control gene
expressions
Skin scarification in brill and sampling
after 72h
Samples preparation and selection of the ones with the best RNA and histological
quality Samples hybridization in the microarray Microarray data normalization Analysis of the differences between
the treatment and control gene expressions
Analysis of the gene expression differences
between turbot and brill
Functional analysis of the most differentially
expressed genes in turbot, in brill and between species
Microarray data corroboration through
26
3. MATERIALS AND METHODS
3.1. Bioinformatic strategy used to confirm the turbot microarray
has a good representation of transcripts characteristic of skin
An initial sample of 1564 sequences (annex 1) from skin-related genes (NCBI database) selected from reported publications (Long et al. 2013; Micallef et al. 2012; Liu et al. 2013) was used to scan the Turbot 5 database (DB5) (Latest unpublished turbot transcriptomic database; Pereiro et al. 2012; Ribas et al. 2013) and the immuno-enriched oligo-microarray probes built for turbot (Turbot 4 database) in order to ascertain the microarray suitability for the skin gene expression analysis in turbot and in brill. First, the DB5 was scanned using a tblastn with the 1564 sequences against the database sequences. Second, the sequences from the DB5 which had homology with the 1564 sequences were BLASTed against the immuno-enriched oligo-microarray probes built for turbot using a nucleotide Megablast with the local alignment program BLAST-2.2.29+, since the turbot oligo-microarray was built with sequences from an older database (Turbot 4 database (DB4)). The e-value cut off and the minimum identity percentage applied for the tblastn was ≤ 9e-20 and ≥ 80%, respectively. The minimum identity percentage applied for the Megablast was ≥ 95%.
3.2. Biological sampling
The skin of healthy young adult brill (n = 6; age: 11 months; weight: 176,8 ± 42,02 g; length: 22,58 ± 3,353 cm) and turbot (n = 6; age: 30 months; weight: 1150 ± 155,5 g; length: 36,92 ± 1,656 cm), maintained under standard culture and feeding conditions at IFAPA Centro Agua del Pino (Huelva, Spain) and at Cluster de la Acuicultura de Galicia (A Coruña, Spain) facilities, respectively, was scraped with the blunt side of a knife on the upper side of the lateral line in order to remove the scales and epidermis. Only the epidermis and superior dermis layers from turbot skin and the scales from brill skin (together with the epidermis and superior dermis layers) were scraped off and the damaged area corresponded approximately to a square of 2 cm2 at the middle of the body relative to the tail. The individuals were keep in normal culture and feeding conditions for 72h. Then, 4 skin samples from each individual were collected. Two skin samples
27
(one from the injured side and the other from intact skin) were obtained and stored in RNA later (1 piece of tissue per 5 volumes of RNA later) for RNA extraction and subsequent RNA quality evaluation. The other 2 samples (one from injured and another from normal skin) of skin and muscle (~1cm3) were obtained and stored [brill samples in 4% PFA (2 g of PFA, 5 ml of H2O, one drop of NaOH (0.5-1 M), 45 ml of PBS, and pH adjusted to 7.4 with HCl. One volume of tissue per 5-10 volumes of fixative was used), and turbot samples into 4% formol (71 ml of acid picric supersaturated in distilled water, 24 ml of formaldehyde, and 5 ml of acetic acid. One volume of tissue per 5-10 volumes of fixative was used.)] for histological quality analysis.
3.3. RNA preparation and Sample selection
Pooled tissues were ground to a fine powder in a mortar and pestle with liquid nitrogen and finally stored at -80ºC until used for RNA extraction. Total RNA was extracted from pooled tissues of control and treatment using TRIZOL reagent (Life Technologies) according to manufacturer’s recommendations. All extractions were performed by the same researcher.
Six individuals (3 brill and 3 turbot) were excluded from the microarray analysis because either, 1) they failed to pass the quality threshold for RNA quality (Bioanalyser, Bonsai Technologies) and quantification (NanoDrop® ND-1000 spectrophotometer, NanoDrop® Technologies Inc) analysis or 2) in light microscopy analysis of thin sections of skin stained with haematoxilin-eosin (H-E) damage was more or less extensive than the superior dermis.
3.4. Microarray hybridizations and a nalysis
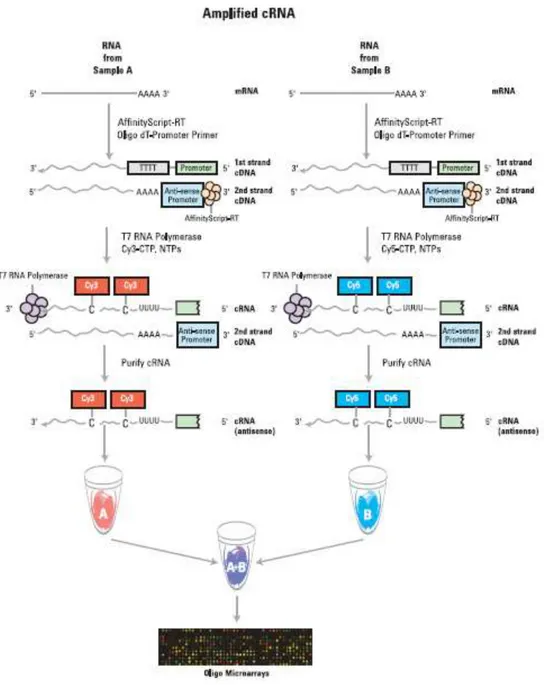
Total RNA selected from quality and quantification analysis was reverse transcribed into cDNA. The double strand cDNA was then transcribed into cRNA and labelled with Cyanine 3 dye for microarray hybridization (Figure 3.1). A solid-phase (glass) 1x3”, 4x44K Agilent® oligo-microarray slide (Millán et al. 2010; Millán et al. 2011; Pardo et al. 2012), including 4 microarrays per slide and 45220 spots per microarray (43803 60-mer oligo-probes, with 3425 duplicated probes and some repeated genes with unknown sequence direction, plus Agilent® RNA spike-in controls), designed using the
28
turbot 4 Database ESTs from spleen, liver and head kidney was used to evaluate gene expression profiles after 72h post skin scraping. Two slides were used in the experiment, one per species, using a 1-color labelling approach. On each slide, 4 microarrays (1 control + 3 individual samples) were used. Hybridizations were performed by loading the labelled cRNA and the corresponding reagents onto the slides at the Universidade de Santiago de Compostela Functional Genomics Platform using Agilent® Gene Expression Analysis. The temperature used for hybridizations was 65ºC for both species. All work was carried out on the same day and by the same researcher.
Figure 3.1. Schematic representation of cRNA amplification procedure for a two-color microarray experiment. For a one-color microarray experiment, only the Cyanine 3-labelled (Cy3-CTP) sample is produced and hybridized (from Agilent Technologies 2014).
29
Since normality of the log (log-normality) microarray signal is assumed, the log2 transformation of the ratios treatment/control was used in the statistical analysis. Normalization within each microarray was carried out using the LOESS method, which assumes that most genes in the microarray are not differentially expressed in relation to the control. Normalized data were organized into .mev files using a homemade R program for statistical analysis with the MultiExperiment Viewer (MeV) program (Saeed et al. 2006). An initial filter of fluorescent signal (<200 fluorescence units) was applied to avoid the presence of false-positives due to background signal. In the statistical analysis, two different criteria were used to identify Differentially Expressed (DE) genes in each species, in response to the skin injury: (a) genes with log2 ratios ≥ 2 or ≤ -2 in at least one of the biological replicates for up- and downregulated genes, respectively, and (b) genes which deviated from the null hypothesis (mean log2 ratio = 0) using t tests at P < 0.005. Another two different criteria were used to identify DE genes between species: (a) genes with mean log2 ratio difference between species ≥ 2, and (b) genes which showed statistical differences in the mean log2 ratio between species using t tests at P < 0.005.
3.5. Functional annotation of the most differentially expressed
genes
Putative functions of the genes represented on the Tables 4.3 – 4.8 (62 genes) were accessed by their gene name annotated in the microarray probes and searched in the UniProt and NCBI databases (http://www.uniprot.org/; http://www.ncbi.nlm.nih.gov/). The represented genes were classified into functional categories, and their term enrichment analyzed through the DAVID program (Huang et al. 2009b; Huang et al. 2009a). Official gene symbols of the represented genes and all available species present in the DAVID database were used as a gene list and as a background, respectively, to test enriched functions. The default p-value given by the DAVID program is 0.1 but since the genes list used with known putative functions was small, a less stringent p-value cut-off was applied, and a cut-off of 0.2 was used.
30
3.6. RT-PCR microarray validation
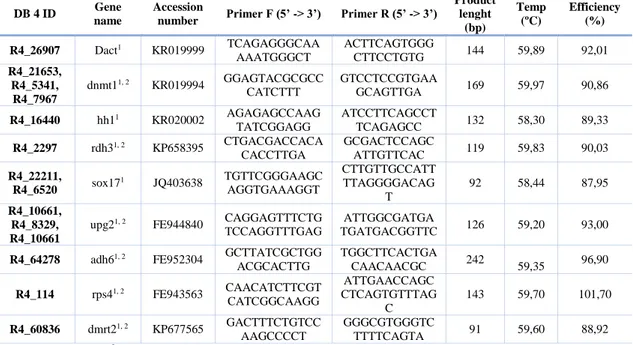
To validate microarray results by RT-PCR we evaluated the suitability of a set of 19 genes, used for microarray validation in previous studies in the turbot, for the brill and turbot RNA from skin samples (Millán et al. 2011; Pardo et al. 2012; Robledo et al. 2014). The first step was to ascertain the performance of the primers set in the brill. A PCR was performed with the 19 primer pairs in the RNA from brill skin samples, using the amplification parameters reported for turbot. After amplification and quality evaluation of the PCR, 17 of the primer pairs were selected for use in brill RT-PCR and all 19 primer pairs were used for turbot RT-PCR. Primer pairs were excluded from the initial 19 pairs due to poor amplification in brill RNA from skin samples, and the lack of fluorescent signal in the microarray hybridization with turbot or brill RNA from skin samples. Finally, primer pairs for amplification of 9 genes were selected to validate the turbot microarray results and 6 genes were selected to validate the brill microarray results throught RT-PCR analysis (Table 3.1). Ribosomal Protein S4 (Official gene symbol: RPS4) was used as the housekeeping gene for RT-PCR analysis as it has previously been shown to have consistent expression in turbot (Robledo et al., 2014). RNA (~1 µg) was reverse transcribed into cDNA using AffinityScript Multiple Temperature cDNA Synthesis kit according to the supplier’s protocol (AGILENT TECHNOLOGIES). The RT-PCR analysis was carried out in a MX3005P thermocycler (STRATAGENE) using ~1 µl of cDNA in 20 µl reaction following the Brilliant III Ultra-Fast SYBR® Green QPCR Master Mix (AGILENT TECHNOLOGIES) as described by Millán et al. (2011).
31 Table 3.1. List of primers used for RT-PCR in turbot and brill.
DB 4 ID Gene
name
Accession
number Primer F (5’ -> 3’) Primer R (5’ -> 3’)
Product lenght (bp) Temp (ºC) Efficiency (%) R4_26907 Dact1 KR019999 TCAGAGGGCAA AAATGGGCT ACTTCAGTGGG CTTCCTGTG 144 59,89 92,01 R4_21653, R4_5341, R4_7967 dnmt11, 2 KR019994 GGAGTACGCGCC CATCTTT GTCCTCCGTGAA GCAGTTGA 169 59,97 90,86 R4_16440 hh11 KR020002 AGAGAGCCAAG TATCGGAGG ATCCTTCAGCCT TCAGAGCC 132 58,30 89,33 R4_2297 rdh31, 2 KP658395 CTGACGACCACA CACCTTGA GCGACTCCAGC ATTGTTCAC 119 59,83 90,03 R4_22211, R4_6520 sox17 1 JQ403638 TGTTCGGGAAGC AGGTGAAAGGT CTTGTTGCCATT TTAGGGGACAG T 92 58,44 87,95 R4_10661, R4_8329, R4_10661
upg21, 2 FE944840 CAGGAGTTTCTG
TCCAGGTTTGAG
ATTGGCGATGA
TGATGACGGTTC 126 59,20 93,00
R4_64278 adh61, 2 FE952304 GCTTATCGCTGG
ACGCACTTG TGGCTTCACTGA CAACAACGC 242 59,35 96,90 R4_114 rps41, 2 FE943563 CAACATCTTCGT CATCGGCAAGG ATTGAACCAGC CTCAGTGTTTAG C 143 59,70 101,70 R4_60836 dmrt21, 2 KP677565 GACTTTCTGTCC AAGCCCCT GGGCGTGGGTC TTTTCAGTA 91 59,60 88,92
1 Primer used in turbot. 2 Primer used in brill.
3.7. Histological quality analysis
To analyze the quality of tissues for the final selection of samples, brill samples were fixed in 4% PFA (2 g of PFA, 5 ml of H2O, one drop of NaOH (0.5-1 M), 45 ml of PBS, and pH adjusted to 7.4 with HCl. One volume of tissue per 5-10 volumes of fixative was used), and turbot samples into 4% formol (71 ml of acid picric supersaturated in distilled water, 24 ml of formaldehyde, and 5 ml of acetic acid. One volume of tissue per 5-10 volumes of fixative was used). Tissue samples were processed by first dehydrating in alcohol, followed by clearing in xylene and embedding in paraffin. Thin sections (2-3 µm) were prepared, mounted on glass slides and stained with haematoxylin-eosin (H-E) (Bancroft & Gamble 2008).
32
4. RESULTS AND DISCUSSION
4.1. Bioinformatics analysis
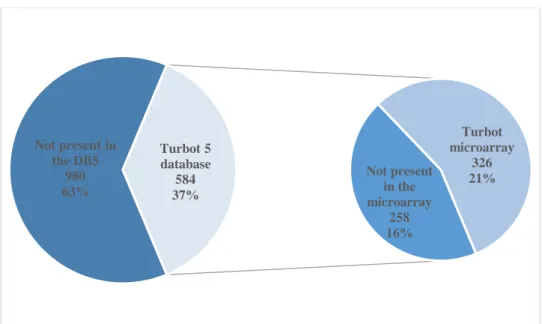
An initial sample of 1564 sequences (annex 1) was used to scan the Turbot 5 database (DB5) (Latest unpublished turbot transcriptomic database; Pereiro et al. 2012; Ribas et al. 2013) and the immuno-enriched oligo-microarray probes built for turbot (Turbot 4 database) as described in the subsection 3.1 of Materials and Methods. A total of 584 genes (~37% of the initial sample) were present in DB5 and 326 (~21% of the initial sample) were present in the oligo-microarray (Figure 4.1; annex 2). A notable presence of skin-related genes in both the DB5 and the microarray is observable, especially for the turbot microarray, since it was made and enriched with immune-related tissue genes (Millán et al. 2010; Millán et al. 2011; Pardo et al. 2012).
A preliminary bioinformatic analysis was made to ascertain the suitability of the turbot oligo-microarray for gene expression analysis in brill. However, the number of brill sequences available on the NCBI database was scarce which meant statistical analysis could not be used and, therefore, this comparative sequence analysis was excluded from the thesis presentation.
Figure 4.1. Skin-related genes from previous studies (1564 genes) detected in the turbot database and in the turbot oligo-microarray. Not present in the DB5 980 63% Not present in the microarray 258 16% Turbot microarray 326 21% Turbot 5 database 584 37%
33
4.2. Microarray gene expression analysis
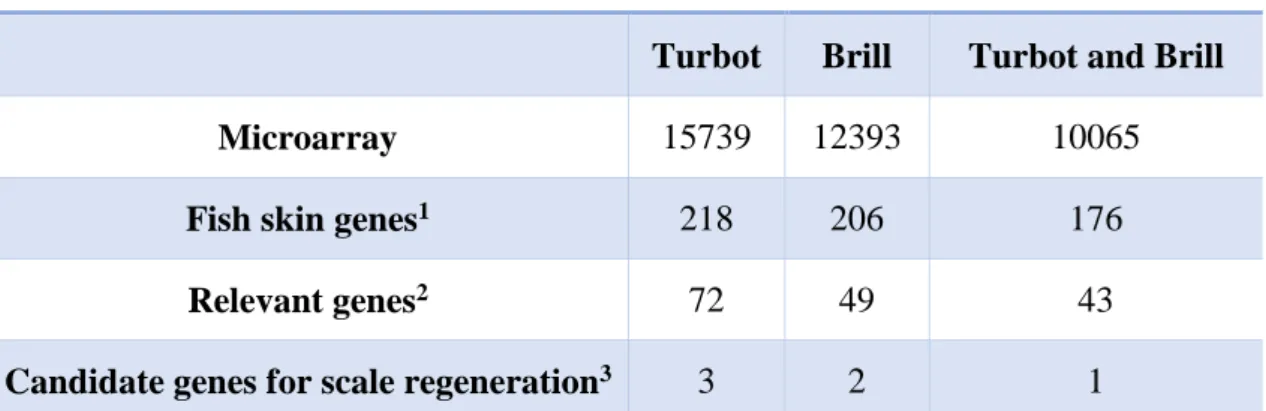
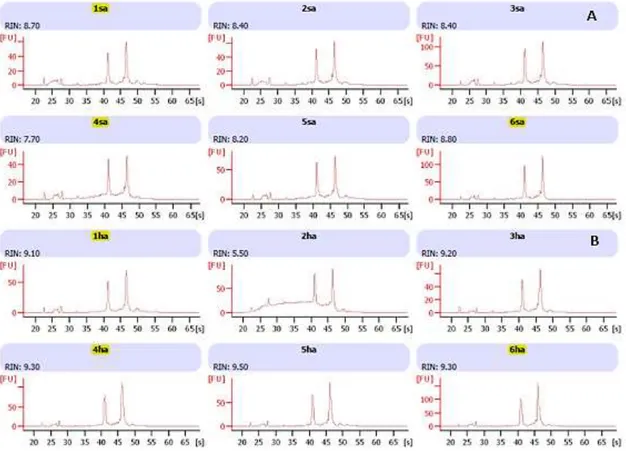
Six individuals were chosen for gene expression analysis (3 per species) considering their best RNA and/or skin section sample qualities. Regarding to RNA quality, samples with the best RIN number (Schroeder et al. 2006) were considered to be included (Figures 4.2 and 4.3). Relatively to skin section samples, the level of skin damage was evaluated and samples with moderated skin damage (removal of epidermis and superior dermis) and with as less artefacts as possible were considered apt for the study. The number of genes with consistent fluorescent signal (> 200 f. u.) in each species was 15,739 in turbot, 12,393 expressed genes in brill. The number of common genes with consistent signal in both species was 10,065 (Table 4.1). As expected, a considerable number of expressed genes in turbot is observable. Nevertheless, a notable number of genes expressed for brill in the turbot microarray is evidenced. These results, together with the notable presence of skin-related genes in the microarray mentioned above, shows a strong feasibility in the evaluation of brill genes in the microarray. Moreover, it demonstrates and confirms the suitability of the turbot immune-enriched microarray for both brill and skin-related genes, once the analysed genetic sample was exclusively RNA from skin of these two species. Another fact can be stated with the appreciable quantity of shared expressed genes in both species which is the corroboration of the genetic proximity between turbot and brill, determined in previous studies (Bouza et al. 2002; Blanquer et al. 1992).
Table 4.1. Expressed genes with consistent fluorescent signal (>200 fluorescent units) in the 4X44k turbot oligo-microarray.
Total expressed genes
Turbot Brill Turbot and Brill
Microarray 15739 12393 10065
Fish skin genes1 218 206 176
Relevant genes2 72 49 43
Candidate genes for scale regeneration3 3 2 1
1 genes from the initial sample of fish skin genes. 2 public known genes with relevant functions in the skin. 3 genes from the
34
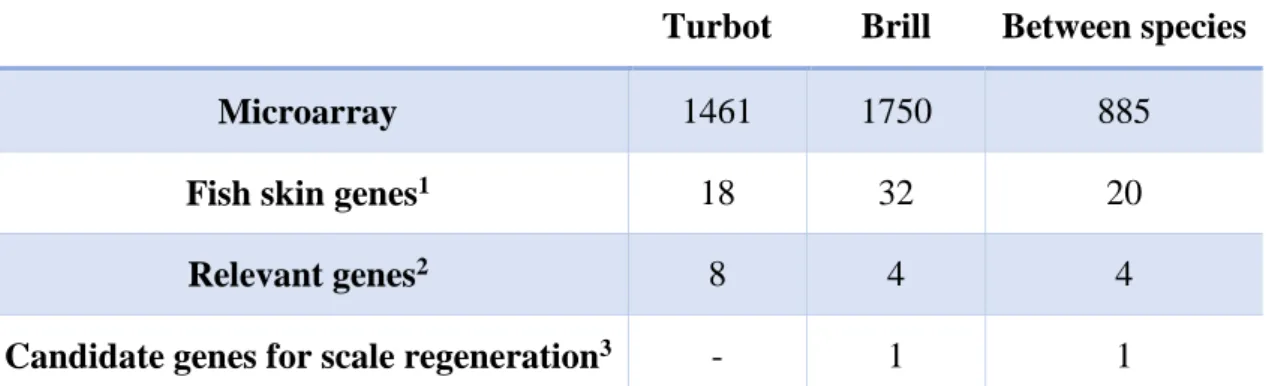
DE genes in each (in response to skin injury) and between species were identified by using two different criteria as described in the subsection 3.4 of Materials and Methods. The number of DE genes was 1750 for brill and 1461 for turbot (annex 3 and 4, respectively), in response to skin injury. A total of 885 genes showed differences in expression between species (Table 4.2; annex 5). Tables with the 10 DE genes with highest absolute log ratio in each species response to skin injury, highest DE difference between species and available putative function in the UniProt and NCBI databases (http://www.uniprot.org/; http://www.ncbi.nlm.nih.gov/) are represented in the Tables 4.3 and 4.4, respectively. Surprisingly, brill shows higher expression than turbot and the number of differently expressed genes indicates observable differences in genes expression response to skin injury. However, genes expression values in turbot have a higher standard deviation between biological replicates (individuals) than in brill. This fact may cause a considerable variability between the gene expression values of the individuals, resulting in a less rigorous analysis and results in turbot. Higher variability in gene expression values between turbot individuals may be associated with the observable difference in the skin structure relatively to brill, since turbot tubercles are, most often, isolated and randomly distributed, comparing to brill scales which are more frequent and less randomly distributed (Zylberberg et al. 2003). Therefore, a different arranjement of the appendices in the fish skin may result in a different skin response to injury.
Table 4.2. Differentially expressed (DE) genes within and between species.
Turbot Brill Between species
Microarray 1461 1750 885
Fish skin genes1 18 32 20
Relevant genes2 8 4 4
Candidate genes for scale regeneration3 - 1 1
1 genes from the initial sample of fish skin genes. 2 public known genes with relevant functions in the skin. 3 genes from the
35
Figure 4.2. Turbot sampled RNA quality analysis. ‘SM’ indicates control samples and ‘HM’ indicates treatment samples. Yellow marked samples represent the chosen individuals for this study.
Figure 4.3. Brill sampled RNA quality analysis. ‘sa’ indicates control samples and ‘ha’ indicates treatment samples. Yellow marked samples represent the chosen individuals for this study.
36 Table 4.3. "Top 10" highest DE genes in each species response to skin injury, identified from the microarray.
Probe
Name Gene description Putative function
Mean Log2 ratio P value Turbot
R4_53611 ribosyltransferase 5 Ecto-ADP- Catalytic activity: Protein ADP-ribosylation (the transfer, from NAD, of ADP-ribose to protein amino acids). 6,120 0,006
R4_58772.1
Tumor necrosis factor receptor superfamily
member 6B
Apoptotic programmed cell death: Protects against
apoptosis. 5,316 0,004
R4_51569.1 Interleukin-8 Chemotactic factor: Attracts neutrophils, basophils, and
T-cells. Neutrophil activation. 4,897 0,034
R4_31059r M17 homologue Immune response. 5,015 0,016
R4_13016r Cell cycle checkpoint
control protein RAD9A Cellular response to DNA damage stimulus. 4,598 0,012
R4_51611.1 L-threonine dehydrogenase Pyridoxine biosynthetic process (macronutrient
metabolism). -3,853 0,012
R4_2851.1 DnaJ homolog subfamily B
member 14
Co-chaperone with HSPA8. Promotes the degradation of
misfolded transmembrane proteins. -3,853 0,045
R4_18066r Proline arginine-rich end
leucine-rich repeat protein
Extracellular matrix structural constituent. May anchor
basement membranes to the underlying connective tissue. -3,832 0,049
R4_13540r ABI family, member 3
(NESH) binding protein
Extracellular matrix organization. Positive regulation of
cell-substrate adhesion. -3,877 0,085
R4_10398 Matrix Gla protein Regulation of bone mineralization. Inhibition of bone
formation. -3,964 0,043
Brill
R4_10711r S100-A6 Calcium sensor and modulator. Reorganization of the actin
cytoskeleton and cell motility. 5,330 0,019
R4_2305 Cell division protein kinase
1
Apoptotic process. Cell division. Epithelial cell
differentiation. Mitotic nuclear division. 3,937 0,002
R4_7618r Topoisomerase (DNA) II
alpha Mitotic cell cycle. 3,768 0,003
R4_9416
Serpin peptidase inhibitor, clade E (nexin, plasminogen activator inhibitor type 1), member 1
Blood coagulation. Circadian rhythm. Extracellular matrix
organization. Fibrinolysis. Gene expression. 3,722 0,013
R4_11656r Cell division cycle
associated 7-like Positive regulation of cell proliferation. 3,596 0,002
R4_44196 Ubiquitin specific peptidase 22 Chromatin organization. -3,690 0,001
R4_13221.1 tracheobronchial-like Mucin 5, subtype B, Cellular protein metabolic process. -3,707 0,049
R4_10572r Collagen, type X, alpha 1
Collagen catabolic process. Extracellular matrix disassembly and organization. Skeletal system
development.
-4,337 0,021
R4_53735 Troponin I, cardiac muscle Muscle filament sliding. -3,651 0,014
R4_44336 Smoothelin, like Regulation of contractile properties of both striated and
37 Table 4.4. "Top 10" most differently expressed genes between species identified from the microarray.
Probe Name Gene description Putative function
Mean Log2 ratio (brill) Mean Log2 ratio (turbot) Mean Log2 ratio dif P value R4_7618r Topoisomerase
(DNA) II alpha Mitotic cell cycle. 3,768 -1,037 4,806 0,001
R4_2305 Cell division
protein kinase 1
Apoptotic process. Cell division. Epithelial cell differentiation. Mitotic
nuclear division.
3,937 -0,772 4,708 0,000
R4_47782 Aurora kinase B Mitotic cell cycle. Protein
autophosphorylation. 3,555 -0,591 4,146 0,001
R4_10496r Stathmin
Regulation of the microtubule (MT) filament system. Control of the learned
and innate fear.
2,639 -1,483 4,122 0,008 R4_485.2 Complement factor D/ adipsin and kallikrein-like serine protease
Blood coagulation. Complement activation. Innate immune response. Platelet activation and degranulation.
Proteolysis. 2,991 -1,005 3,996 0,066 R4_12817.2 Heparin-binding EGF-like growth factor
Innate immune response. Muscle organ
development. -1,575 2,365 -3,939 0,003
R4_4183
DNA-directed RNA polymerase
II subunit H
DNA repair. Gene expression. Innate immune response. Regulation of gene expression, epigenetic. RNA splicing. Somatic stem cell maintenance. Viral
process. -2,956 2,646 -5,601 0,010 R4_13286 6-phosphofructo-2-kinase/ fructose-2,6-biphosphatase 3
Canonical glycolysis. Carbohydrate metabolic process. Energy reserve metabolic process. Gluconeogenesis. Glucose metabolic process. Intracellular
signal transduction.
-0,338 3,681 -4,020 0,050
R4_11425 Calpain-3
Apoptotic process. Muscle cell cellular homeostasis. Muscle organ development.
Signal transduction. -0,611 3,316 -3,926 0,011 R4_65007 Peptidoglycan recognition protein L1
Negative regulation of gene expression. -0,028 4,267 -4,296 0,037
The 326 genes from the initial sample of fish skin genes, which are present in the microarray, were specially considered to check their expression. In turbot, 218 skin genes showed consistent expression and 18 were DE in response to skin injury and in brill, 206 genes expressed and 32 were DE in response to skin injury. In both species, 176 genes were expressed and 20 were DE between them (Tables 4.1 and 4.2). Lists of the 10 highest DE genes within and between species were obtained from these 326 genes (Tables 4.5 and 4.6, respectively).
38 Table 4.5. "Top 10" most DE genes in each species response to skin injury, identified from the fish skin genes sample.
Accession number
Probe
Name Gene description Putative function
Mean Log2 ratio P value Turbot NP_001032454 R4_10715 6-phosphofructo-2-kinase/ fructose-2,6-biphosphatase 4, like
Fructose metabolic process. 1,701 0,076
NP_956047 R4_269r Calponin-2 Cytoskeleton organization. 1,690 0,081
NP_998231 R4_32855 Hexokinase 2
Canonical glycolysis. Carbohydrate metabolic process. Glucose metabolic process. Glucose transport. Transmembrane
transport.
1,639 0,045
NP_001122153 R4_2564 Vinculin
Blood coagulation. Cell adhesion. Cell-matrix adhesion. Movement of cell or subcellular component. Muscle contraction.
Negative regulation of cell migration. Platelet activation and degranulation.
1,066 0,002 NP_956267 R4_20869r PREDICTED: similar to ubiquitin specific protease 14 isoform 1
Cysteine-type endopeptidase activity. tRNA
guanylyltransferase activity. 1,008 0,001
NP_001108199 R4_12123 Ring finger protein
122-like Zinc ion binding. -1,639 0,045
NP_001002667 R4_6475 Solute carrier family
25, member 36a Transmembrane transport. -2,023 0,007
NP_001018337 R4_1116 Glutathione
peroxidase
Oxidation-reduction process. Response to
oxidative stress. -2,098 0,024
NP_001025256 R4_15761r Dermatopontin Cell adhesion. Collagen fibril organization.
Negative regulation of cell proliferation. -3,313 0,036
NP_001139254 R4_10997 Collagen, type V,
alpha 2-like
Axon guidance. Collagen catabolic process. Extracellular matrix disassembly and
organization.
-3,365 0,029 Brill
NP_997729 R4_2305 Cell division protein
kinase 1
Apoptotic process. Cell division. Epithelial
cell differentiation. Mitotic nuclear division. 3,937 0,002
NP_001017574 R4_11656r Cell division cycle
associated 7-like Positive regulation of cell proliferation. 3,596 0,002
NP_997732 R4_2288
Predicted ATPase involved in replication control, Cdc46/ Mcm family
DNA replication. Intein-mediated protein
splicing. 3,480 0,006
NP_001032780 R4_9715 Ubiquitin carrier
protein
Positive regulation of BMP signaling pathway. Protein monoubiquitination. Retrograde transport, endosome to Golgi.
3,284 0,001
NP_944595 R4_10078r
DNA replication licensing factor
mcm4
DNA strand elongation involved in DNA replication. G1/S transition of mitotic cell
cycle. Mitotic cell cycle.
2,694 0,004
NP_001103872 R4_11422r UDP-glucose
dehydrogenase
Cellular glucuronidation. UDP-glucose
metabolic process. 2,502 0,006
NP_001133614 R4_1536 EH
domain-containing protein 3 Blood coagulation. Nucleic acid binding. 2,240 0,000
NP_001187576 R4_3056r RNA polymerase II, polypeptide H-like
DNA repair. Innate immune response. mRNA splicing. Negative regulation of gene expression, epigenetic. Positive regulation of
viral transcription. Somatic stem cell maintenance.
1,998 0,002
NP_001070097 R4_11114 ARMET protein
encoding gene
Dopamine metabolic process. Neuron cellular homeostasis. Neuron projection
development.
1,991 0,000
XP_002667793 R4_25707r NAD(P)
transhydrogenase
Cellular metabolic process. Hydrogen ion transmembrane transport. Oxidation-reduction process. Tricarboxylic acid cycle.
39 Table 4.6. "Top 10" most Differently Expressed genes between species identified from the fish skin genes sample.
Accession
number Probe Name Gene description Putative function
Mean Log2 ratio (brill) Mean Log2 ratio (turbot) Mean Log2 ratio dif P value NP_997729 R4_2305 Cell division protein kinase 1 Apoptotic process. Cell division. Epithelial cell differentiation. Mitotic nuclear division. 3,937 -0,772 4,708 0,000
NP_001017574 R4_11656r Cell division cycle
associated 7-like Positive regulation of cell proliferation. 3,596 -0,270 3,866 0,001 NP_001032780 R4_9715 Ubiquitin carrier protein Positive regulation of BMP signaling pathway. Protein monoubiquitination. Retrograde transport, endosome to Golgi. 3,284 -0,454 3,738 0,000 NP_997732 R4_2288 Predicted ATPase involved in replication control DNA replication. Intein-mediated protein splicing. 3,480 -0,096 3,576 0,003 NP_001025256 R4_15761r Dermatopontin Cell adhesion. Collagen fibril organization. Negative regulation of cell proliferation. -0,019 -3,313 3,293 0,041 NP_001139254 R4_10997 Collagen, type V, alpha 2-like Axon guidance. Collagen catabolic process. Extracellular matrix disassembly and organization. -0,116 -3,365 3,249 0,031 NP_944595 R4_10078r DNA replication licensing factor mcm4 DNA strand elongation involved in DNA replication. G1/S transition of mitotic cell cycle. Mitotic cell cycle.
2,694 -0,216 2,911 0,002
NP_878286 R4_1127.1 Glutamine
synthetase
Cellular amino acid biosynthetic process. Glutamate catabolic process. Neurotransmitter uptake. 1,179 -1,628 2,808 0,032 NP_999924 R4_307 Asparaginyl endopeptidase Innate immune response. Innate immune response. Vitamin D metabolic process 1,861 -0,143 2,003 0,001 NP_001032454 R4_10715 6-phosphofructo-2-kinase/ fructose-2,6-biphosphatase 4, like Fructose metabolic process. -0,708 1,701 -2,410 0,045
Relevant genes regarding to: i) cellular cycle, division, proliferation and differentiation; ii) dermal skeleton development; iii) regeneration, growing and development of a tissue; iv), energy production metabolism; v) osmotic stress; and vi) immune response, were identified and their expression profiles specifically analysed considering their role in skin regeneration (Table 4.7). Beside these relevant genes, genes from two pathways regarding to scales formation, reported in a recent study (Casas et al.