ISSN 0100-879X
BIOMEDICAL SCIENCES
AND
CLINICAL INVESTIGATION
www.bjournal.com.br
www.bjournal.com.br
Volume 43 (10) 914-1009 October 2010
Institutional Sponsors
The Brazilian Journal of Medical and Biological Research is partially financed by
Hotsite of proteomics metabolomics developped by:
Braz J Med Biol Res, October 2010, Volume 43(10) 976-981
doi: 10.1590/S0100-879X2010007500089
Comparison of bone quantity by ultrasound measurements of phalanges
between white and black children living in Paraná, Brazil, with
Europeans
Comparison of bone quantity by ultrasound
measurements of phalanges between
white
and black children living in Paraná,
Brazil, with Europeans
R.R. Ribeiro
1, K.D. Santos-Ribeiro
2, G. Guerra-Junior
1and A. de A. Barros-Filho
11Centro de Investigação em Pediatria, Departamento de Pediatria, Faculdade de Ciências Médicas,
Universidade Estadual de Campinas, Campinas, SP, Brasil
2Centro de Pesquisa de Educação Física em Cineantropometria e Desempenho Humano,
Universidade Federal de Santa Catarina, Florianópolis, SC, Brasil
Abstract
The objective of this study was to determine bone quantity by ultrasound measurements of the proximal finger phalanges (AD-SoS = amplitude-dependent speed of sound) of healthy Brazilian schoolchildren living in Paraná, Brazil, and to compare these values with European populations. The sample was composed of 1356 Brazilian schoolchildren of both genders (660 males, 696 females), aged 6 to 11 years, divided into white (840) and black (516) groups and compared to age- and gender-matched Europeans. AD-SoS of the schoolchildren increased significantly with age for both genders. Significantly higher AD-SoS values were observed for the white children (1916 ± 58) compared to their black counterparts (1898 ± 72) and for the female gender (1920 ± 61) compared to the male gender (1898 ± 66). Overall, the AD-SoS outcomes for females were similar to those of European studies. However, the AD-SoS of the Brazilian schoolchildren of both genders and skin colors was lower than that reported for children in Poland. AD-SoS outcomes for Brazilian schoolboys were similar to those obtained in Italian studies and were lower than those of the Spanish children. In conclusion, Brazilian schoolchildren of both genders and skin colors showed lower bone quantities than Polish children and Spanish males, and levels similar to Italian children and Spanish females.
Key words: Bone; Ultrasound; Phalanges; Schoolchildren; Skin color
Introduction
Correspondence: G. Guerra-Junior, Departamento de Pediatria, Faculdade de Ciências Médicas, UNICAMP, 13083-887 Campinas, SP, Brasil. E-mail: gilguer@fcm.unicamp.br
Received November 20, 2009. Accepted August 11, 2010. Available online August 27, 2010. Published October 18, 2010. Studies have shown that the acquisition of bone mass
is gradual in childhood, increases during adolescence and peaks at the point of sexual maturity (1,2). Consequently, close observation of bone mass in adolescents is necessary in order to evaluate the risk of senior osteoporosis.
Several researchers have adopted the premise that
the group of curves within a specific population can be
satisfactorily applied to any other study population, inde-pendently of its genetic constitution (3,4). According to these investigators, well-nourished children and adolescents of different population groups seem to develop in a similar
way, suggesting that genetic factors have less influence
on development than environmental factors.
Comparison of bone mineral content among subjects of different skin colors has shown that blacks have higher
values than whites and Asians, when compared either in terms of age or body weight (5-10). However, the origin of this difference is unknown.
In view of the differences in bone mineral content as a function of race or skin color and the high racial miscege-nation of the Brazilian population, the aim of the present study was to evaluate differences in bone quantity between healthy white and black Brazilian schoolchildren of both genders aged 6 to 11 years, and to compare these values to European references according to age and gender.
Children and Methods
Bone quantity of Brazilian and European schoolchildren 977
Ceu Azul and Vera Cruz do Oeste, cities of Paraná State, Brazil. The study was approved by the Research Ethics Committee of the Faculty of Medical Sciences, UNICAMP, (protocol #557/2003). Of the 1576 schoolchildren who returned a signed term of informed consent, 220 were excluded: 98 because their skin color was different from those of interest for the study (yellow or indigenous); 35 for
having known chronic diseases, being physically deficient,
presenting a medical history with restrictions, or being under medication that affects bone metabolism, and 87 with a body mass index (BMI) over +2 standard deviations (SD) or under
-2 SD for their age and gender. Thus, the final sample for
the study consisted of 1356 schoolchildren.
Parents or guardians were required to declare the skin color of their children. All school age children who were de-clared white, black or mulatto were eligible to participate in this study, where black and mulatto children were combined into one group denoted “black”. This combining procedure is also used by the Brazilian government in demographic studies (11). Therefore, in the present study, the participants were divided into four groups for each age of interest: black females, white females, black males, and white males.
The bone quantity (amplitude-dependent speed of sound, AD-SoS) was measured using the 3rd-generation DBM Sonic® BP IGEA ultrasound (Italy). This device has a
compass that connects two 12-mm diameter transducers, an emitter and a receptor, with a high precision of ±0.02 mm (12).
The compass is placed on the anatomical point of the
distal metaphases of each of the last four proximal pha-langes, II to V, of the non-dominant hand. One transducer emits a sound wave of 1.25 MHz that passes transversely through constitutive elements of bone tissue (cortical layer, micro-structures, trabeculae, and collagen), while the other receives the signal and evaluates the speed of propagation of sound through the phalanx (12).
AD-SoS (bone quantity) is obtained automatically and represents 96 acquisitions of speed measurements of ultrasound (m/s) that track the bone tissue trabeculae on the four proximal phalanges by transmission. The values of these measures range from 1650 to 2250 m/s. The measured parameter depends on the amplitude of the elec-trical signal obtained after the ultrasound passes through the three types of bone within the phalanges (endosteal, trabecular and cortical). In the evaluation of the electrical recording, the amplitude of the signal is only considered when a minimum value is reached, called the threshold level or the trigger level (12).
The mean AD-SoS values of the present study were
compared to five European references that provide norma -tive values for children and adolescents using the same method (13-17) (Table 1).
Descriptive statistical analysis was used for the AD-SoS outcome measurement, with values of absolute frequency, mean and SD being used for the construction of tables and graphs. The unpaired one-tailed Student t-test was used
to determine the statistical significance of differences in
mean AD-SoS values of the schoolchildren of both genders
Table 1. Bone quantity (AD-SoS) as reported in European references.
Bone quantity (m/s)
6 years 7 years 8 years 9 years 10 years 11 years
Longitudinal studies
Halaba et al., 2008 (7-12 years) Poland
Male (130) - 1915 ± 32 1939 ± 31 1949 ± 26 1967 ± 33 1965 ± 32
Female (139) - 1924 ± 27 1935 ± 33 1961 ± 31 1954 ± 42 1988 ± 34 Vignolo et al., 2006 (3-16 years) Italy
Male (290) 1898 ± 62 1901 ± 68 1914 ± 33 1903 ± 39 1921 ± 49 1923 ± 50 Female (299) 1882 ± 24 1902 ± 35 1902 ± 37 1919 ± 51 1913 ± 41 1956 ± 45 Cross-sectional studies
Vignolo et al., 2003 (3-16 years) Italy
Male (641) 1876 ± 48 1889 ± 50 1898 ± 47 1906 ± 42 1913 ± 44 1914 ± 45 Female (586) 1874 ± 43 1898 ± 49 1886 ± 44 1927 ± 45 1932 ± 47 1961 ± 51 Gimeno Ballester et al., 2003 (6-18 years) Spain
Male (469) 1914 ± 35 1915 ± 41 1920 ± 40 1935 ± 38 1932 ± 47 1926 ± 42 Female (360) 1914 ± 26 1923 ± 33 1924 ± 39 1936 ± 32 1955 ± 40 1968 ± 48 Baroncelli et al., 2001 (3-21 years) Italy
Male (587) 1883 ± 35 1891 ± 37 1924 ± 29 1926 ± 39 1928 ± 42 1950 ± 41 Female (496) 1884 ± 27 1887 ± 35 1907 ± 39 1936 ± 38 1945 ± 32 1957 ± 50
and skin colors in relation to the references, as noted in Table 1. The alpha value was reduced from 0.05 to 0.01 to diminish type I errors caused by the large number of tests run for each age, gender and skin color. To compare age between genders and skin colors with variable AD-SoS, one-way ANOVA (SPSS for Windows 13.0) was used to test the hypothesis that Brazilian bone quantity, indepen-dent of skin color, is similar to European data according to gender and age.
Results
The Brazilian sample population consisted of 1356 schoolchildren of both genders aged 6 to 11 years with white and black skin colors. Table 2 shows the AD-SoS means and SD of the Brazilian subjects.
AD-SoS increased with age for schoolchildren of both genders and skin colors (white: male, P = 0.0001; female, P = 0.027 and black: male, P = 0.035; female, P = 0.0001). The percent values of the variations from 6 to 11 years were 1.7 and 3.9% for boys and 3.5 and 2.8% for girls of white and black skin colors, respectively. The white females showed higher AD-SoS values when compared to other groups within the sample popu-lation of Brazilian schoolchildren (black females, P = 0.04; white males, P = 0.03; black males, P = 0.04; Table 2).
Comparison of the mean AD-SoS values of females of both skin colors to the European data indicated values
simi-lar to those obtained in the studies of Italian children and adolescents by Baroncelli et al. (13) and in the studies of Spanish children and adolescents by Gimeno Ballester et al. (14). In this study, only black 7- and 9-year-olds showed
significantly lower AD-SoS values than whites (P = 0.001). In the other age groups, these values were not significantly
different between black and white females. Overall, blacks had lower AD-SoS values compared with those described in Refs. 13 and 14. The Brazilian 11-year-old schoolchildren had lower AD-SoS values compared with the study by Gimeno Ballester et al. (14) (P = 0.0001; Figure 1).
Compared to the two studies of Italian children and adolescents by Vignolo et al. (15,16), the mean AD-SoS values of the present study were higher for white 8- (P = 0.0001) and 10-year-old (P = 0.001) females and for
8-year-Figure 1. Mean values of bone quantity (AD-SoS) for female schoolchildren aged 6 to 11 years. The means of the white and black subgroups of this study are compared to the cumulative means for the 5 European references. AD-SoS = amplitude-dependent speed of sound.
Table 2. Bone quantity (AD-SoS) measurements in 1-year ranges for gender and skin color of the schoolchildren evaluated in the present study.
Bone quantity (m/s)
Age (years)
Female Male
White Black White Black
N Mean ± SD N Mean ± SD N Mean ± SD N Mean ± SD
6 ├ 7 51 1894 ± 57 29 1886 ± 82 57 1893 ± 46 24 1850 ± 101 7 ├ 8 87 1910 ± 61 43 1870 ± 67 76 1888 ± 59 46 1875 ± 65 8 ├ 9 88 1915 ± 44 47 1917 ± 65 79 1895 ± 63 57 1868 ± 78 9 ├ 10 101 1932 ± 53 34 1893 ± 66 71 1914 ± 60 36 1904 ± 53 10 ├ 11 85 1947 ± 49 65 1932 ± 64 87 1925 ± 45 63 1895 ± 64 11 ├ 12 33 1960 ± 42 33 1941 ± 31 25 1907 ± 85 39 1922 ± 63
Bone quantity of Brazilian and European schoolchildren 979
old blacks (P = 0.005) (15). Lower values were observed only in black females from the 7- (P = 0.004) and 9-year-old (P = 0.005) groups compared to the 2003 study (15), and for the 11-year-old group (P = 0.0001) compared to both studies (15,16). Compared to the study of Polish children and adolescents by Halaba (17), the AD-SoS mean values
of the present study were significantly lower across age
groups, except for 7- (P = 0.032) and 10-year-old (P = 0.204) white females and for 8-year-old (P = 0.065) black females (similar values; Figure 1).
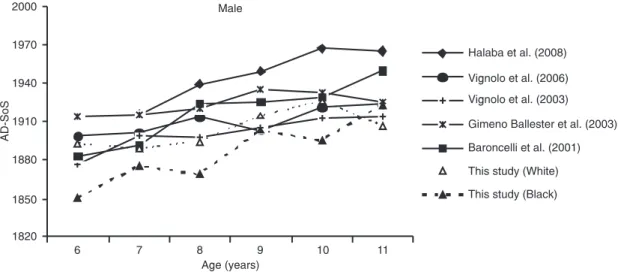
Many of the AD-SoS values obtained here for male schoolchildren of both skin colors were similar to those reported by Baroncelli et al. (13) and to the two studies by Vignolo et al. (15,16). However, in the present study, the AD-SoS values were lower for both the 8-year-old (Baron-celli: whites, P = 0.001 and blacks, P = 0.001, and Vignolo: blacks, P = 0.001) and 10-year-old (Baroncelli: blacks, P = 0.0001) groups (Figure 2).
Compared to the study of Gimeno Ballester et al. (14), lower values were obtained in the present study for both skin colors in most age groups [whites: 6 year olds (P = 0.001), 7 year olds (P = 0.0001), 8 year olds (P = 0.001), and 9 year olds (P = 0.005); blacks: 6 year olds (P = 0.005), 7 year olds (P = 0.0001), 8 year olds (P = 0.0001), 9 year olds (P = 0.0001), and 10 year olds (P = 0.0001)], and in all age groups when compared to the Halaba (17) study (P = 0.0001; Figure 2).
Discussion
Racial miscegenation is highly prominent in Brazil be-cause Europeans of white skin color, Africans of black skin color, Asians of yellow skin color, and indigenous peoples
of Brazil participated in the process of the formation of this country. The mixing has been intense since the beginning of colonization. The small number of white women among the Portuguese colonizers led the latter to have relation-ships with Indians and black slaves. This mixing gave rise to other groups such as mulattos (the mix of white and black), “caboclo” or “mameluco” (the mix of white and Asian), and the “cafuzo” (the mix of black and Asian) (18). Pena et al. (19) showed recently that in Brazil one cannot predict the color of persons from their genomic ancestry.
As a result, miscegenation in Brazil is an aspect that must always be considered in any study using racial analy-sis (20,21). The analyanaly-sis adopted by Instituto Brasileiro de
Geografia e Estatistica (IBGE) has been considered as official since 1991 for racial classification in demographic studies. This classification uses self-declaration in the col
-lection of data, i.e., the person chooses from a list of five
racial categories (white, black, mulatto, yellow, and indig-enous peoples) (11). Telles (20) evaluated the proportion of people of African ancestry in a rural community in Brazil,
where the group of individuals classified as black presented
a proportion of African ancestry of 51%, while those who were self-declared as mulatto presented a proportion of
44% African ancestry. Furthermore, Telles” study scientifi -cally supports the strategy of political mobilization used by the black movement of Brazil, which consists of grouping black and mulatto individuals into the black category (20).
The IBGE defines individuals who declare themselves as
mulatto or black as “black” (11).
Several studies have been conducted using dual energy X-ray absorptiometry (DXA) for the determination of bone mineral density. In general, these studies showed that black children and adolescents had 5 to 23% higher bone
mineral density in relation to other skin colors (22,23) and that the loss of bone tissue in adults of this racial group is 1/2 of that of their white counterparts (5,23).
In children, the results regarding these differences are controversial. Indeed, some researchers (23,24)observed more bone mass in blacks, and others have not (25). How-ever, no study observed higher values for whites. The results of the present study with a Brazilian sample population (12) diverged from other studies regarding differentiation between skin colors (blacks and whites), with higher values being observed in white schoolchildren.
Bone content is known to be correlated to many factors such as heredity, skin color, geographic region, life style, and nutrition (26,27). Our study did not evaluate food ingestion or some chemical markers, which are important variables for a comprehensive evaluation of bone metabolism (26-28). When analyzing this group of Brazilian schoolchil-dren, Ribeiro et al. (12) showed that black schoolchildren predominated in the lower socioeconomic levels, but the socioeconomic difference did not interfere with body com-position analyses when comparing black and white children. However, it is known that calcium intake, life style, physical activity, and other aspects linked to socioeconomic status
might significantly influence bone mass. As a result, these factors may have influenced AD-SoS values in the group
evaluated in our study.
Certainly, an additional differentiating factor may be related to the levels of vitamin D.In European countries such as Italy, Spain and Poland, which have North latitudes farther from the equator,the cutaneous production of vitamin
D drops significantly (29).
Even though Brazil shows incidences of ultraviolet rays that are more adequate for bone health when compared with Spain, Italy or Poland, the outcome of AD-SoS measure-ment in the present study did not support this phenomenon conclusively. For both genders and skin colors we obtained AD-SoS values similar to those of the Italian studies, and lower values than those of the Polish and Spanish studies. In general, the mean AD-SoS values for males were lower than those of their European counterparts, whereas the values for females were similar to those of the Europeans.
Ultrasound does not measure the bone density in mass per unit of area as in DXA (g/cm²), nor in mass per unit of volume as does computed tomography (g/cm³). In reality, what is measured is the speed of ultrasound propagation through bone, such as the calcaneous, tibia or phalanges.
A wide band ultrasonic pulse is transmitted through the bone sample and the signal attenuation is measured as a percentage of sound waves absorbed by the body. These ultrasonic standards vary according to the variation of den-sity, structure, elasticity, and other biomechanical alterations of the bone (30).
Given that multiple biomechanical bone parameters dictate the transfer of ultrasonic pulses through a bone sample, the increment in AD-SoS values observed during
childhood and adolescence can be a reflection of greater
density or changes in the structural architecture of bone tissue. For instance, Baroncelli et al. (13) observed in-creasing variations in AD-SoS from 3 to 21 years of age in both genders. The percent values of these variations were 14.8% for boys and 13.9% for girls. From the ages of 6 to 11 years, the variations in AD-SoS, according to the European references used for comparison purposes, were 1 to 3.4% for boys and 2.8 to 4.6% for girls (13-17).
In the present study, we observed similar results for both genders and skin colors, with AD-SoS increasing with age, and with variations of 1.7 to 3.9% for boys and 3.5 to 2.8% for girls of white and black skin colors, respectively.
Studies comparing AD-SoS between genders showed
similar values in the first years of life until the ages of 9 and
10; higher values were observed for girls during puberty from 10 to 14 years of age, with no differences being observed after 15 and 16 years of age (13,14).
Our study had some limitations such as a cross-sectional rather than a longitudinal design, lack of information about food habits and level of physical activity, and no determina-tion of sexual maturity in the European studies. Nonetheless, our study is important for understanding the long process of bone maturation that occurs in childhood and adolescence. Ourresults can be used to build a database to be applied to the study of bone mass development in children.
In conclusion, Brazilian schoolchildren of both genders and skin colors showed lower bone quantities than Polish and Spanish males, and levels similar to Italian children and Spanish females.
Acknowledgments
The authors thank the headmasters, schoolteachers and parents who consented to participate in the study and to the staff that assisted with data collection. Research supported by CAPES.
References
1. Mora S, Gilsanz V. Establishment of peak bone mass. En-docrinol Metab Clin North Am 2003; 32: 39-63.
2. Silva CC, Goldberg TB, Teixeira AS, Dalmas JC. [Bone min-eralization among male adolescents: critical years for bone mass gain]. J Pediatr 2004; 80: 461-467.
3. Habicht JP, Martorell R, Yarbrough C, Malina RM, Klein RE. Height and weight standards for preschool children. How relevant are ethnic differences in growth potential? Lancet
1974; 1: 611-614.
nutri-Bone quantity of Brazilian and European schoolchildren 981
tional status. WHO Working Group. Bull World Health Organ
1986; 64: 929-941.
5. Cauley JA, Lui LY, Stone KL, Hillier TA, Zmuda JM, Hochberg M, et al. Longitudinal study of changes in hip bone mineral density in Caucasian and African-American women. J Am Geriatr Soc 2005; 53: 183-189.
6. Neuner JM, Zhang X, Sparapani R, Laud PW, Nattinger AB. Racial and socioeconomic disparities in bone density testing before and after hip fracture. J Gen Intern Med 2007; 22: 1239-1245.
7. Leder BZ, Araujo AB, Travison TG, McKinlay JB. Racial and ethnic differences in bone turnover markers in men. J Clin Endocrinol Metab 2007; 92: 3453-3457.
8. Travison TG, Araujo AB, Esche GR, McKinlay JB. The relationship between body composition and bone mineral content: threshold effects in a racially and ethnically diverse group of men. Osteoporos Int 2008; 19: 29-38.
9. Travison TG, Beck TJ, Esche GR, Araujo AB, McKinlay JB. Age trends in proximal femur geometry in men: variation by race and ethnicity. Osteoporos Int 2008; 19: 277-287. 10. Hill DD, Cauley JA, Sheu Y, Bunker CH, Patrick AL, Baker
CE, et al. Correlates of bone mineral density in men of Afri-can ancestry: the Tobago bone health study. Osteoporos Int
2008; 19: 227-234.
11. INEP (Instituto Nacional de Estudos e Pesquisas Edu-cacionais Anísio Teixeira). Mostre sua raça, declare sua cor. http://inep.gov.br/imprensa/noticias/censo/escolar/ news05_05.htm. Accessed July 26, 2010.
12. Ribeiro RR, Guerra-Junior G, de Azevedo Barros-Filho. Bone mass in schoolchildren in Brazil: the effect of racial miscegenation, pubertal stage, and socioeconomic differ-ences. J Bone Miner Metab 2009; 27: 494-501.
13. Baroncelli GI, Federico G, Bertelloni S, de Terlizzi F, Cadossi R, Saggese G. Bone quality assessment by quantitative ultrasound of proximal phalanxes of the hand in healthy subjects aged 3-21 years. Pediatr Res 2001; 49: 713-718. 14. Gimeno Ballester J, Azcona San Julián C, Sierrasesúmaga
Ariznabarreta L. [Bone mineral density determination by os-teosonography in healthy children and adolescents: normal values]. An Esp Pediatr 2001; 54: 540-546.
15. Vignolo M, Brignone A, Mascagni A, Ravera G, Biasotti B, Aicardi G. Influence of age, sex, and growth variables on phalangeal quantitative ultrasound measures: a study in healthy children and adolescents. Calcif Tissue Int 2003; 72: 681-688.
16. Vignolo M, Parodi A, Mascagni A, Torrisi C, de Terlizzi F, Aicardi G. Longitudinal assessment of bone quality by quantitative ultrasonography in children and adolescents.
Ultrasound Med Biol 2006; 32: 1003-1010.
17. Halaba ZP. Quantitative ultrasound measurements at hand
phalanges in children and adolescents: a longitudinal study.
Ultrasound Med Biol 2008; 34: 1547-1553.
18. Pena SDJ, Bortolini MC. Pode a genética definir quem deve se beneficiar das cotas universitárias e demais ações afir -mativas? Estud Av 2004; 18: 31-50.
19. Pena SDJ, Bastos-Rodrigues L, Pimenta JR, Bydlowski SP. DNA tests probe the genomic ancestry of Brazilians. Braz J Med Biol Res 2009; 42: 870-876.
20. Telles E. Racismo à brasileira: uma nova perspectiva soci-ológica. Rio de Janeiro: Relume Dumará, Fundação Ford; 2003.
21. Oliveira F. Ser negro no Brasil: alcances e limites. Estud Av
2004; 18: 57-60.
22. Gilsanz V, Skaggs DL, Kovanlikaya A, Sayre J, Loro ML, Kaufman F, et al. Differential effect of race on the axial and appendicular skeletons of children. J Clin Endocrinol Metab
1998; 83: 1420-1427.
23. Nelson DA, Simpson PM, Johnson CC, Barondess DA, Kleerekoper M. The accumulation of whole body skeletal mass in third- and fourth-grade children: effects of age, gender, ethnicity, and body composition. Bone 1997; 20: 73-78.
24. Bell NH, Shary J, Stevens J, Garza M, Gordon L, Edwards J. Demonstration that bone mass is greater in black than in white children. J Bone Miner Res 1991; 6: 719-723. 25. Rupich RC, Specker BL, Lieuw AF, Ho M. Gender and race
differences in bone mass during infancy. Calcif Tissue Int
1996; 58: 395-397.
26. Abrams SA, O’Brien KO, Liang LK, Stuff JE. Differences in calcium absorption and kinetics between black and white girls aged 5-16 years. J Bone Miner Res 1995; 10: 829-833.
27. Bryant RJ, Wastney ME, Martin BR, Wood O, McCabe GP, Morshidi M, et al. Racial differences in bone turnover and calcium metabolism in adolescent females. J Clin Endocrinol Metab 2003; 88: 1043-1047.
28. Jaime PC, Latorre MR, Florindo AA, Tanaka T, Zerbini CA. Dietary intake of Brazilian black and white men and its re-lationship to the bone mineral density of the femoral neck.
São Paulo Med J 2006; 124: 267-270.
29. Bhattoa HP, Bettembuk P, Ganacharya S, Balogh A. Preva-lence and seasonal variation of hypovitaminosis D and its relationship to bone metabolism in community dwelling postmenopausal Hungarian women. Osteoporos Int 2004; 15: 447-451.