i
Biological characterization and vectorization of new
compounds with antiproliferative effects
Dissertação de mestrado orientada por:
Prof.ª Doutora Alexandra Fernandes, FCT-UNL
Prof. Doutor Rui Gomes, FCUL
Joana Sanches Coimbra
Dissertação de mestrado
Mestrado em Biologia Molecular e Genética
2015
Universidade de Lisboa
Faculdade de Ciências
ii
Biological characterization and vectorization of new
compounds with antiproliferative effects
Dissertação de mestrado orientada por:
Prof.ª Doutora Alexandra Fernandes, FCT-UNL
Prof. Doutor Rui Gomes, FCUL
Joana Sanches Coimbra
Dissertação de mestrado
Mestrado em Biologia Molecular e Genética
2015
Universidade de Lisboa
Faculdade de Ciências
i
Index
Acknowledgement ... iv
Resumo em Língua Portuguesa da Dissertação intitulada: “Biological characterization and vectorization of new compounds with antiproliferative effects” ... v
Resumo ... ix
Abstract ... x
Figure Index ... xi
Table Index ... xiv
1. Introduction ... 1
1.1. Cancer distribution and incidence worldwide ... 1
1.2. Cancer Hallmarks ... 1 1.3. Cell Cycle ... 2 1.4. Apoptosis ... 3 1.5. Copper complex ... 5 1.6. Nanovectorization ... 6 1.7. Aim ... 6
2. Materials and methods ... 7
2.1. Compound under study ... 7
2.2. Cellular lines under study ... 7
2.3. Cytotoxic potential evaluation - Cellular Viability Assay ... 8
2.4. Evaluation of apoptotic potential ... 8
2.4.1. Hoechst 33258 staining ... 8
2.4.2. Annexin V-FITC and Propidium Iodide Staining... 9
2.5. Western Blot ... 9
2.5.1. Sample Preparation ... 9
2.5.2. SDS-PAGE ... 10
2.5.3. Transfer to nitrocellulose membrane ... 10
2.5.4. Primary and secondary antibody incubation ... 10
ii
2.6. DNA-compound interaction studies ... 11
2.6.1. UV titrations ... 11
2.6.2. DNA cleavage assay and electrophoretic mobility shift assay (EMSA)... 12
2.7. Cell cycle Progression Assay ... 12
2.8. BSA-compound interaction studies ... 13
2.9. Synthesis, Functionalization, Characterization of Nanoconjugates ... 13
2.9.1. Nanoparticle synthesis and characterization ... 13
2.9.2. Functionalization with PEG and characterization ... 14
2.9.3. Functionalization with compound and characterization ... 15
2.9.4. Viability assays with nanoparticles ... 15
2.10. Proteomics ... 15
2.10.1. Sample Preparation ... 15
2.10.2. Whole Protein Precipitation and Purification: 2-D Clean-Up Kit ... 16
2.10.3. Whole Protein Quantification: Pierce Reagent 660 nm ... 16
2.10.4. 2-D Gel Electrophoresis: Isoelectric Focusing ... 16
2.10.5. 2-D Gel Electrophoresis: SDS-PAGE ... 17
2.10.6. Detection and Digital Imaging... 17
2.11. Complementary Assays ... 17
2.11.1. Compound stability in different pH and time-points ... 17
3. Results and Discussion ... 18
3.1. Cytotoxic potential evaluation ... 18
3.1.1. Cellular Viability assays ... 18
3.2. Apoptotic potential evaluation ... 19
3.2.1. Hoechst 33258 staining ... 19
3.2.2. Annexin V-FITC and Propidium Iodide Staining ... 20
3.3. Western Blot ... 21
3.4. DNA-compound interaction studies ... 21
3.4.1. UV titrations ... 21
iii
3.5. Cell cycle Progression Assay ... 24
3.6. Bovine Serum Albumin (BSA)-compound interaction studies ... 24
3.6.1. UV-vis absorbance spectra ... 24
3.6.2. Florescence quenching studies ... 25
3.7. Viability assays with nanoparticles ... 26
3.8. Proteomics ... 27
3.9. Complementary Assays ... 29
4. Conclusions and Future Perspectives ... 29
5. Bibliography ... 30 Supplements ... a Appendix A ... a Appendix B ... a Appendix C ... b Appendix D ... b Appendix E ... c Appendix F ... d
iv
Acknowledgement
First and foremost I would like to thank my supervisor Prof. Alexandra
Fernandes for accepting me in her laboratory and for the excellent guidance
throughout all of this work.
To Prof. Pedro Viana Baptista, for his constant advises and hints, a most
valuable input to the development of this thesis.
To my co-supervisor Prof. Rui Gomes for full availability to answer all of my
questions and doubts.
To Dr. Guadalupe Cabral and to all CEDOC personnel for the collaboration and
availability, allowing me to accomplishment the flow cytometry assays.
To my Lab colleagues (from both research groups), for not only academic help,
but for the constant advises and good laughs. Some of them will remain forever
friends. In particular, to Pedro Martins for all the knowledge you conveyed to me
throughout, always accompanied with a smile.
To my family, in particular my parents, for all the unconditional love and
continuous support. You were my rock.
To my boyfriend, for always showing nothing but the most calm and
comprehension towards me, even in the worst moments. For all your love and
affection.
To all my friends, for the support and encouragement that brought me here and
for the courage to help on the worst days. For always reminding me that I have
true friend for life.
I would like to give an overall thanks to all of those without whom I would not
have been able to complete this dissertation.
Lastly, I would like to dedicate this thesis to both my grandfathers that, although
they not among us anymore, surely are looking for me and wishing me the best
of luck in the future.
v
Resumo em Língua Portuguesa da Dissertação intitulada: “Biological characterization and vectorization of new compounds with antiproliferative effects”
O cancro pode ser visto como uma doença multifactorial, causada por um misto de factores ambientais e genéticos, dando origem a mutações em oncogenes ou em genes supressores de tumores, responsáveis pela transição de células saudáveis em células neoplásicas. Esta doença tem vindo a crescer em todo o mundo, sendo a maior causa de morte tanto em países desenvolvidos como nos países em desenvolvimento. Neste contexto, os tipos de cancro mais comuns e igualmente mais mortíferos são o cancro do pulmão e o cancro da mama, em homens e em mulheres, respectivamente. Em Portugal, o tipo de cancro mais comum é o cancro colo-rectal, com igual relevância no mundo, uma vez que se apresenta como o terceiro tipo de cancro com maior número de casos diagnosticados. O aumento significativo do número de novos casos de cancro por ano em conjunto com a sua elevada taxa de mortalidade criaram uma necessidade urgente de encontrar novos tratamentos, mais eficazes e com menos efeitos secundários, para que seja possível a detenção da disseminação desta doença no futuro.
As células cancerígenas apresentam diversas características, distintas mas complementares, que as distinguem das células normais. Estas incluem a manutenção do sinal proliferativo, a possibilidade de escaparem a supressores de tumores, a capacidade de resistirem à morte celular, a capacidade quase imortal de replicação, a indução da angiogénese e a capacidade de invasão de outros tecidos e de formação de metástases. Subjacente a todas estas características está a instabilidade genómica.
A quimioterapia mantem-se, nos dias de hoje, o tratamento mais utilizado contra o cancro. No entanto, os efeitos secundários graves, que surgem da difusão da droga para células normais, e a resistência por parte das células cancerígenas à terapêutica permanecem obstáculos consideráveis, pelo que a descoberta de novos fármacos revela-se uma prioridade.
A utilização de nanopartículas com a finalidade de optimizar a biodistribuição de drogas quimioterapeuticas tem-se verificado ser uma poderosa ferramenta para reduzir os efeitos do composto noutros locais que não o tumor e, assim, os efeitos secundários tóxicos. De facto, a utilização de nanopartículas aumenta o tempo de semi-vida dos composto e diminui a a concentração de droga em circulação no organismo e, por consequente, permite a utilização de menores dosagens
vi
terapêuticas. De entre todas as possíveis nanopartículas, as nanopartículas de ouro apresentam-se como as mais sintetizadas e exploradas, uma vez que oferecem inúmeras vantagens e propriedades únicas, tais como a estabilidade química, a facilidade em funcionalizar com biomoléculas e a biocompatibilidade.
Neste contexto, o trabalho desenvolvido nesta dissertação tem como objectivo a caracterização completa do efeito antitumoural de um composto de cobre ([Cu3(μ3 -OH)-(NO3)(CH3OH)(μ2-X)3(μ2-HL3)]), elucidando os seus alvos biológicos e o seu mecanismo de acção. Uma vez atingido este objectivo, prosseguir-se-á com a vectorização do composto em nanopartículas de ouro, na tentativa de desenvolver um nanosistema que permita o transporte selectivo da droga.
Os ensaios in vitro em linhas tumorais HCT116 (carcinoma colorectal humano) revelaram que o complexo apresenta valores de IC50 de 5,4 µM. Foi igualmente testado na linha celular A549 (adenocarcinoma de pulmão humano), que apresentava um valor de IC50 demasiado elevado para se prosseguir com estudos mais detalhados. A citoselectividade do composto para células tumorais foi igualmente avaliada, pela determinação da diminuição de viabilidade do composto na linha celular de Fibroblastos (uma linha primária neonatal). Deste ensaio resultou um aumento do valor de IC50 da linha normal em relação à linha tumoral HCT116 em cerca de cinco vezes. Para avaliar a capacidade do composto de induzir a apoptose, foi efectuado o ensaio de marcação com Hoechst 33258 em células HCT116 incubadas com 5,4 (o valor de IC50) e 8,1 µM (uma vez e meia o valor de IC50) de composto. No entanto, não foi possível observar um número considerável de células com morfologia aberrante do núcleo nem condensação nuclear, características do mecanismo de apoptose. De facto, a maioria das células apresentava uma marcação uniforme, próprio de uma distribuição homogénea da cromatina pelo núcleo. Estes resultados foram confirmados pela análise por citometria de fluxo com dupla marcação com anexina V-FITC e iodeto de propídio, em que cerca de 80% das células HCT116 eram viáveis.
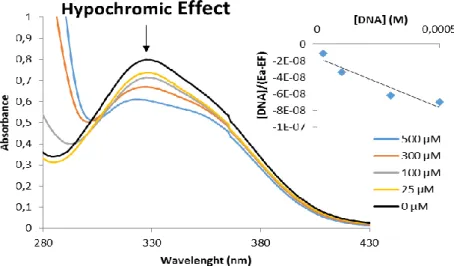
Para determinar uma possível interacção do composto com macromoléculas, nomeadamente com o DNA, foram realizados, ainda, estudos de espectroscopia e de retardamento da mobilidade electroforética, de forma a determinar a afinidade do composto para esta molécula. Foi possível observar um efeito hipocrómico aquando da adição de concentrações crescentes de DNA. A constante de afinidade foi calculada, apresentando um valor de 4.17x10³ M-1, diversas ordens de magnitude inferior ao valor para a Doxorrubicina. Dado que não se observou retardamento da mobilidade electroforética da forma superenrolada do DNA plasmídico, com o aumento
vii da concentração de composto, a sua interacção com o DNA ocorre, possivelmente, pela fraca ligação ao sulco menor do DNA. No entanto, este resultado não permite a extrapolação para a situação in vivo, uma vez que a complexidade inerente à célula poderá albergar alvos moleculares mais plausíveis.
Uma vez que o composto não apresentou indução da apoptose, ponderou-se se o seu efeito anti-tumoral seria devido à influência (paragem total ou retardamento) no ciclo celular. No entanto, o ensaio de progressão do ciclo celular revelou que o composto não tem qualquer influência neste processo.
Ainda na perspectiva de interacção do composto com macromoléculas, foram realizados dois ensaios de interacção com a Albumina do Soro Bovino (BSA), um de espectroscopia de absorção UV-visível e outro por espectroscopia de fluorescência. Ambos os ensaios revelaram que o composto tem elevada afinidade para proteínas, uma vez que foi possível observar um efeito hipercrómico na absorvância e um
quenching da fluorescência. A constante de ligação e o número de ligações do
composto à macromolécula foram calculados, apresentando o valor de 4,94 x 10³ M-1 e 0,63, respectivamente, valor este que está na mesma ordem de grandeza do valor para a Doxorrubicina.
A vectorização do composto em nanopartículas de ouro, funcionalizadas numa primeira fase com PEG, revelou uma diminuição da viabilidade celular em cerca de 20% em relação à concentração de IC50 do composto no estado livre, possivelmente devido a diferentes mecanismos de intercalação. Este nanoconjugado foi caracterizado por espectroscopia UV-visível, DLS e TEM, em cada uma das fases de funcionalização.
Pelo ensaio de proteómica comparativa foi possível observar, entre outros, que a exposição ao composto resulta numa sub-expressão de proteínas associadas ao citoesqueleto, como a ezrina e a actina. Foi observado igualmente, uma sub-expressão de proteínas antioxidantes, como a Superóxido Dismutase e a Peroxiredoxina-2, que poderá levar à acumulação de ROS na célula. Por outro lado, a sobre-expressão da proteína de resposta ao stress Heat shock protein beta-1, poderá indicar que a célula iniciou uma resposta contra a indução da apoptose, o que está em concordância com os resultados de Hoechst e de marcação com Anexina V - FITC e Iodeto de propídio.
viii
Em conclusão, com base em todos os resultados obtidos, não foi possível extrapolar o principal mecanismo de acção do composto. No entanto, alguns resultados são de realçar, como a diferença entre os IC50 de células tumorais e não tumorais e a melhoria do efeito citotóxico do composto quando vectorizado em nanopartículas. Estes resultados poderão apontar para o facto de, com estudos in vitro e in vivo futuros, o composto poderá ser um trunfo no tratamento contra o cancro.
ix
Resumo
A quimioterapia mantem-se, ainda nos dias de hoje, o tratamento maioritário aplicado contra o cancro. No entanto, os efeitos secundários graves e a resistência por parte das células cancerígenas à terapêutica permanecem obstáculos consideráveis, pelo que a descoberta de novos fármacos revela-se uma prioridade. Neste contexto, o trabalho desenvolvido nesta dissertação teve como objectivo a caracterização completa do efeito antitumoural de um composto de cobre e a respectiva nanovectorização. Os ensaios in vitro em linhas tumorais HCT116 revelaram que o complexo apresenta valores de IC50 de 5,4 µM. A citoselectividade para células tumorais foi avaliada na linha celular de Fibroblastos, que apresentou um aumento do valor de IC50 em cerca de cinco vezes. A marcação com Hoechst 33258 de células HCT116 incubadas com 5,4 e 8,1 µM de composto não revelou fragmentação e condensação nuclear, características do mecanismo de apoptose. Estes resultados foram confirmados pela análise por citometria de fluxo com marcação dupla com anexina V-FITC e iodeto de propídio, em que cerca de 80% das células HCT116 estão viáveis. Realizaram-se, ainda, estudos de interacção com o DNA, para determinar a afinidade do complexo para esta molécula. A constante de afinidade, determinada por titulações UV, apresentou um valor de 4.17x10³ M-1, diversas ordens de magnitude inferior ao valor para a Doxorrubicina. Dado que não foi observado retardamento da mobilidade electroforética da forma superenrolada do DNA plasmídico, com o aumento da concentração de composto, a interacção deste com o DNA ocorre, possivelmente, pela ligação ao sulco menor do DNA. O ensaio de progressão do ciclo celular mostrou que o composto não influencia este processo. Ambos os ensaios de interacção com a proteína BSA, revelaram que o composto tem grande afinidade para proteínas, cuja contante de afinidade e número de ligações apresentaram o valor de 4,94x10³ M-1 e 0,63, respectivamente. A vectorização do composto em nanopartículas de ouro revelou uma diminuição mais acentuada da viabilidade celular (em cerca de 20%), possivelmente devido a diferentes mecanismos de intercalação. Pelo ensaio de proteómica comparativa foi possível observar, entre outros, que a exposição ao composto resulta numa sub-expressão de proteínas associadas ao citoesqueleto, uma sub-expressão de proteínas antioxidantes e uma sobre-expressão da proteína de resposta ao stress.
Palavras-chave: Cancro, Complexo de cobre, Apoptose, Ciclo celular, Nanovectorização
x
Abstract
Nowadays, chemotherapy is still the majority of the cancer treatments. However, the severe side effects and the drug resistance by cancer cells remain giant obstacles, so much that the discovery of new drugs is still a major priority. In this context, the work developed on this thesis aimed the full characterization of the antitumor effect of a copper compound and the respective vectorization. In vitro assay on HCT116 cell line showed that the compound had an IC50 of 5.4 µM. Compound’s cytoselectivity to tumoral cells was evaluated on primary cell line Fibroblasts, which presented an IC50 value 5-fold higher than the one observed for HCT116. Hoechst 33258 staining in HCT116, incubated with 5.4 and 8.1 µM of compound, didn’t reveal nuclear fragmentation or condensation, hallmarks of the apoptosis mechanism. These results were confirmed by flow cytometry with an Annexin V-FITC and PI double staining of HCT116 cells, in which around 80% of cells were viable. Were also performed DNA interaction studies in order to calculate an affinity constant, which was 4.17x10³ M-1, several orders of magnitude lower than that for Doxorubicin. The electrophoretic mobility shift assay showed no shifting of the supercoiled pDNA form with increased compound concentration, and together, these results point to an interaction with DNA through weak minor groove binding. Cell cycle progression assay revealed that the compound has no interference in this process. Both BSA interaction assays showed a strong affinity of the compound to proteins, which binding constant and the number of binding sites presented a value of 4.94x10³ M-1 e 0.63, respectively. Nanoparticle vectorization presented a greater reduction in cell viability (at around 20%), possibly due to different internalization mechanisms. Proteomics assay revealed that the exposure to compound results in under expression of cytoskeleton associated proteins, under expression of antioxidant proteins and over expression of stress related proteins.
xi
Figure Index
Figure 1 Schematic representation of the main apoptosis molecular pathways.
Adapted from Favaloro et al. 2012 22. ... 4
Figure 2 Processes that lead to a defective apoptosis by cancer cells18. ... 4
Figure 3 Induction of apoptosis by the tumor suppressor p5318. ... 5
Figure 4 Chemical structure of compound C9. Adapted from Mahmudov, K et al. 2014.
30 ... 6
Figure 5 Dose dependent cytotoxicity of compound C9 on HCT116 (left) and
Fibroblasts (right). The data are represented as means ± SEM of at least three independent experiments; *p < 0.05, as compared with the control group. Cell viability values were normalized in relation to the control group without compounds (only DMSO)... 18
Figure 6 HCT116 cell line nuclear staining with Hoechst 33258 exposed to: A) 0.1%
(v/v) DMSO, B) 5.4 µM of compound C9 (IC50), and C) 8.1 µM of compound C9 (1.5 times the IC50). White circles point out evidences of initial apoptosis, such as aberrant nuclear morphology, chromatin condensation and apoptotic body formation. Images are representative of at least two replicates. D) Percentage of apoptotic cells in relation to total cell number calculated considering all replicates. Cell number calculation was performed with Image J software. ... 19
Figure 7 Percentage of viable, apoptotic and necrotic HCT116 cells when exposed to
5.4 µM of compound C9 (IC50)and 8.1 µM (1.5x IC50) or 0.1% (v/v) DMSO (control). Data was analyzed by flow cytometry after Annexin-V/ FITC and PI double staining. The data is represented as means ± SEM of at least three independent experiments. 20
Figure 8 UV//visible Spectroscopy of C9 compound at 25 µM in the absence (black
line) or presence of increased concentrations of CT-DNA (25 to 500 µM), in 5 mM Tis-HCl, 50 nM NaCl (pH 7). Inset: plot of the linear fitting to determine the value of binding constant (Kb) between complex and DNA. ... 22
Figure 9 Electrophoresis in 0.7 % (w/v) agarose gel after exposure of 200 ng of
pUC19 plasmid DNA to either 2.5 % (v/v) DMSO (control, C) or to increasing concentrations of compound C9 (10, 50, 100, 150, 200, 250 and 300 μM). M - λ/HindIII molecular weight marker; C – control with plasmidic DNA pUC19; Cl – Linearized pUC19 with EcoRI; CD – control with DMSO at 2.5 % (v/v). ... 23
xii
Figure 10 Electrophoresis in agarose gel 0.7 % (w/v) after exposure of 200 ng of
pUC19 plasmid DNA to two concentrations of compound C9 (10 and 200 μM) after 1, 6, 12, 24 or 48h exposure. M - λ/HindIII molecular weight marker; C – control with plasmidic DNA pUC19; Lin – Linearized pUC19 with EcoRI; CDMSO – control with DMSO at 2.5 % (v/v) without compound. ... 23
Figure 11 UV/visible Absorbance Spectroscopy with fixed BSA concentration (15 µM)
in the absence (black line) or presence of increased concentrations of C9 (5 to 30 µM), in 10 mM pH 7.0 phosphate buffer with 0.15 M NaCl. ... 25
Figure 12 Steady-state fluorescence quenching spectra of BSA (fixed concentration at
2.0 µM) obtained through the binding of increasing concentrations of compound C9 (0 – 30 µM), excited at 295 nm and red from 300 nm to 500 nm. ... 25
Figure 13 A) Characterization of the AuNPs by UV-Vis spectroscopy in the wavelength
range of 400 - 800 nm (pH 7.0) B) TEM (scale bar: 50 nm) C) Cell viability of AuNP@PEG, AuNP@PEG@C9 and free C9 (IC50) on HCT116 cells. AuNP@PEG@C9 concentration corresponds to IC50 concentration value of C9 on top of the AuNP. The data are represented as means ± SEM of at least three independent experiments; *p < 0.05, as compared with the control group. Cell viability values were normalized in relation to the control group without compounds (only DMSO). D) Hydrodynamic size distribution of AuNP, AuNP@PEG and AuNP@PEG@C9, obtain by DLS. ... 26
Figure 14 Comparative proteome profiling of HCT-116 incubated for 48h with 0.1%
(v/v) DMSO (left) or IC50 (5.4 µM) C9 (right). 2-DE gels were obtained from at least 200 μg of whole protein extract and resulting spots were stained with Comassie Blue. Spots whose abundance variance levels were considered significantly altered were marked and number tagged. Both gels were analyzed with Melanie 7.0 software. The reference gel proteins were quantified by mass spectroscopy (MALDI-TOF). ... 27
Figure 15 Absorbance spectrum of 25 µM of compound C9 at different pH values, at
the moment of solution preparation (0h) or after 24h incubation at 37ºC (24h). ... 29
Figure 16 Dose dependent cytotoxicity of compound C9 on A549. The data are
represented as means ± SEM of at least three independent experiments; Cell viability values were normalized in relation to the control group without compounds (only DMSO)... a
xiii
Figure 17 Western Blot films for antibodies anti-p53 1:5000 (left) and actin 1:5000
(right). Actin film was obtain after stripping of the left membrane. ... b
Figure 18 Electrophoresis in agarose gel 0.7 % (w/v) after exposure of 200 ng of
pUC19 plasmid DNA to different percentages of DMSO (0.01 to 10%). M - λ/HindIII molecular weight marker; C – control with plasmidic DNA pUC19; Lin – Linearized pUC19 with EcoRI. ... b
Figure 19 Difference between the cleavage effect of DMSO (corresponding
Electrophoretic gel in Figure 17) and compound C9 corresponding Electrophoretic gel in Figure 9), calculated through the ratio between linear and supercoiled isoforms, performed with Image J software. ... c
Figure 20 Effect of C9 compound (IC50), or 0.1% DMSO (control) in the cell cycle
progression of HCT116, during different exposure periods (3, 6, 9 h). DNA was stained with propidium iodide, and overall content was analyzed by flow cytometry. The data are represented as means ± SEM of two independent experiments. ... c
Figure 21 Size distribution of AuNP, obtain by TEM, and two representative images. .. d Figure 22 Hydrodynamic size distribution of AuNP, AuNP@PEG and AuNP@PEG@C9, obtain by DLS. ... d
xiv
Table Index
Table 1 Information concerning the compound at study. ... 7 Table 2 Ultrasonication protein extraction protocol. ... 15 Table 3 2-D gel electrophoresis IEF five step program. ... 16 Table 4 Percentage of viable, early apoptotic, late apoptotic and necrotic cells, in
HCT116 cell line, when exposed to compound C9 IC50 concentration value, 1.5x IC50 or 0.1% DMSO (control). Data was analyzed by flow cytometry after Annexin-V/FITC and PI double staining. Data values are represented as means ± SEM of at least three independent experiments. ... 21
Table 5 Proteins in 2-D gel electrophoresis whose abundance variance levels differ
from the control, with a fold change above 1.5 (green) and below 0.7 (red). UniProt ID, protein identification, isoelectric point (pI), molecular weight (MW), and function are represented. Spot ID is correlated with the spot number in image above. ... 28
Table 6 Western Blot acrylamide gel composition. ... a Table 7 2-D Gel Electrophoresis: SDS-PAGE acrylamide gel composition. ... a Table 8 Percentage of HCT116 cells in G1/G0, S and G2/M phases, when exposed to
compound C9 IC50 concentration value or 0.1% DMSO (control). Data was analysed by flow cytometry after PI staining. Data values are represented as means ± SEM of two independent experiments. ... c
1
1. Introduction
1.1. Cancer distribution and incidence worldwide
Cancer can be viewed as a multifactorial disease caused by a complex mixture of genetic and environmental factors 1, resulting in mutation of oncogenes or tumor suppressor genes that are responsible for the transition of normal cells to a neoplastic state 2.
Cancer is the major cause of death in both developed and developing countries, with an estimated 14.1 million new cases, 8.2 million deaths in 2012 worldwide 3. The most predominant cancer types as well as the most deadly forms, comprehend lung and breast cancer in men and women, respectively. In Portugal, one of the most common cancer type is colorectal cancer, accounting for 14.5% of all diagnosed cancer types in adults. From a global point of view, colorectal cancer as an equal relevance, as it is the third most incident 4.
The rising incidence of cancer, with 49,174 new cases each year 5, along with its high mortality rates, creates an urgent need to find new effective treatments that will overcame the pitfalls of today’s chemotherapy, detaining the disease dissemination in the future.
1.2. Cancer Hallmarks
The six hallmarks of cancer represent the distinctive and complementary capabilities that enable tumor growth and metastatic dissemination. They include sustaining proliferative signaling, evading growth suppressors, resisting cell death, enabling replicative immortality, inducing angiogenesis, and activating invasion and metastasis, underlined by genome instability 6.
Contrary to normal tissue, cancer cells must sustain a positively acting growth-stimulatory signal in order to outgrow normal cells. This can be acquired in different ways, by autocrine proliferative stimulation or by disruption of the negative feedbacks that attenuate proliferative signaling. Additionally, cancer cells must escape growth suppressors. RB and p53 (which will be described below) are central control points, and defect on these allow persistent cell proliferation 6. In fact, in order to resist cell death, tumor cells present several strategies to limit or circumvent apoptotic machinery. Yet again, p53 plays a role, whose loss of function eliminates the critical damage sensor from the apoptosis-inducing circuitry.
2
In the next sections, a brief description of the cell cycle and apoptosis mechanism will be presented, to clarify the differences between normal and cancer cells.
1.3. Cell Cycle
Cell cycle comprehends the fundamental physiological and molecularly regulated mechanisms by which a cell grows, replicates, and divides into two identical daughter cells, with all information and biosynthetic machinery 7. This highly regulated process comprises four sequential phases, G1, replication (S), G2 and Mitosis (M). The principal phases are S and M, when DNA replication occurs and the cells divide into two, respectively. The remaining phases, G1 and G2, are intermediate phases, dedicated to duplication of cell’s components and other regulators. Additionally, another phase can be included, G0, which represent a state when cells have reversible withdrawn from cell division in response to high cell density or mitogen deprivation 8. To ensure the correct order of events, the eukaryotic cell contain a complex regulatory network that controls their timing and coordination, thereby preventing the formation of genetically abnormal cells 8. During cell cycle, cells have to pass by several checkpoints that sense DNA damages and incomplete replication 9. Cell cycle arrest allows cells to properly repair these defects, thus preventing their transmission to the resulting daughter cells and perpetuation of errors 9. Each phase and checkpoint is controlled by specific cyclin-dependent kinase (CDK) family members of serine/threonine kinases and their regulatory partners, cyclins. The abundance of each specific cyclin increases during the respective cycle phase and then decreases 9. For instance, Cyclin D-CDK4, drive G1 progression through the restriction point, which commits the cell to complete the cycle 8,10. Mutations in CDKs–cyclin complex, as well as their regulators or upstream mitogenic pathways, deregulate the cell cycle contributing to the uncontrolled cell proliferation, characteristic of cancer 8.
A variety of proteins control both apoptosis and cell cycle. Two of them are p53 and retinoblastoma. Tumor suppressor p53 is a transcription factor that regulates several genes with a broad range of functions, including cell cycle arrest and apoptosis 11. The mechanism by which p53 activation controls cell outcome is related to its levels, with high levels being associated with apoptosis, whereas lower levels result in cell cycle G1 arrest, without concomitant apoptosis 11,12. Another regulation mechanism is the differential transcription of downstream genes, due to the binding of cofactors. For example, binding of ASPP1 (apoptosis-stimulating of p53 protein 1), can promote the binding of p53 to the promoter of pro-apoptotic BAX, but not to CDK1NA ( or p21) 13 promoter, thus enhancing p53-induces apoptosis 11. Furthermore, p21 is a
cyclin-3 dependent kinase inhibitor that binds to and inhibits the activity of cyclin-CDK2, -CDK1, and -CDK4/6 complexes, and thus functions as a regulator of cell cycle progression at G1 and S phase 13,14, leading to the p53-dependent cell cycle G1 phase arrest in response to a variety of stress stimuli 14.
Another cell cycle regulator protein that also plays a role in apoptosis induction is retinoblastoma (pRb). In G1, Cdk4-cyclin D complex phosphorylates pRB, unbounding them from E2F transcription factors and activating the expression of the necessary genes for G1-S phase transition 15. pRb also functions as a transcriptional coregulator of apoptotic genes 16. In this context, pRB promotes expression of pro apoptotic genes by functioning in a transcriptionally active complex that leads to the expression of pro apoptotic genes, such as caspase 7. pRB is also associated with mitochondria and trigger the intrinsic apoptotic pathway by directly binding and activating BAX 16.
1.4. Apoptosis
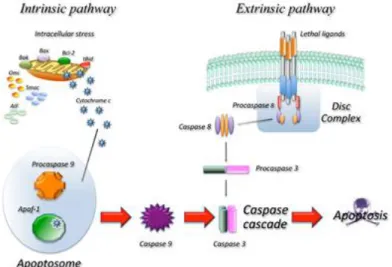
Apoptosis describes a genetically programmed mechanism for promoting the death of cells by a death stimulus or failure to receive survival signals 17. Morphological hallmarks of this programmed cell death mechanism are chromatin condensation and nuclear fragmentation, accompanied by the rounding up of the cell with an overall reduction in cellular volume 2,18. On a biochemical level, the apoptotic signaling cascade of healthy cells (Figure 1) is composed by two major pathways, extrinsic and intrinsic, that gets triggered by either soluble molecules that bind to plasma-membrane receptors or by a plenitude of mitochondrial stimuli, respectively 19.
The extrinsic apoptotic pathway is activated by death receptors (DR), cell-surface receptors that bind to specific ligands like, for example, soluble molecules of the tumor necrosis factor (TNF) family. TNF binds with members of the TNF-receptor (TNF-R) family, such as TNFR-1, Fas/CD95 or TRAIL receptors, and causes receptor trimerization and consequent activation. TNF-Rs possess a death domain (DD) that recruits other DD-containing protein, such as TNF-R type 1-associated death domain protein (TRADD) or Fas-associated protein with a death domain (FADD). This coupling promotes the binding of an adaptor protein and the whole complex is known as death-inducing signaling complex (DISC), which leads to the assembly and activation of pro-caspase 8 20. The activated form of this caspase initiates apoptosis by cleavage of other downstream caspases, such as caspase-3, -6 and -7 19,18.
Conversely, the intrinsic apoptotic pathway is induced by intracellular stimuli, including oxidative stress, irreparable DNA damage, hypoxia, and growth factor deprivation that
4
leads to the permeabilization of the outer mitochondrial membrane 19,18. This process is controlled by the balance between pro and anti- apoptotic Bcl-2 superfamily proteins 19. At the beginning of apoptosis, pro-apoptotic Bax and Bak dimerize creating a protein complex with affinity to the mitochondria where it fuses into the outer membrane creating transmembrane BAX-BAK channels, consequently leading to membrane permeabilization and cytochrome c release to cytosol21. Here, cytochrome c binds to apoptotic protein activating factor-1 (Apaf-1) and promotes the formation of the apoptosome, a multi-protein platform, essential for the recruitment and activation of caspases-9, that will activate caspase-3, promoting the execution of apoptosis 19.
Figure 1 Schematic representation of the main apoptosis molecular pathways. Adapted from Favaloro et
al. 2012 22.
Unlike normal cells, cancer cells are under constant stress, from oncogenic stress to genomic instability and cellular hypoxia 23. However, cancer cells can evade apoptosis by disabling the apoptotic pathways, by a plenitude of processes (Figure 2).
Figure 2 Processes that lead to a defective apoptosis by cancer cells18.
For instance, some studies have shown that genetic inactivation of Bcl-2 proteins or caspases can lead to resistance of pro-apoptotic stimuli and acceleration of tumor formation23. Modulation of apoptosis pathways by cancer cells can be performed by
5 increasing the expression of anti-apoptotic genes or decreasing expression of pro-apoptotic genes, stabilizing or destabilizing anti- or pro-pro-apoptotic proteins, respectively, or even change the function of these protein through phosphorylation 20,23.
Apoptosis signaling can also be induced by p53, which can be transduced along both extrinsic and intrinsic pathways (Figure 3). p53 is highly regulated: under basal conditions, mouse double minute 2 homolog proteins (MDM2) and structurally related MDM4 interact with p53, promoting proteosomal degradation and attenuating its apoptotic functions. Hence, in order to activate apoptosis, p53 must be released from the MDM2-4/p53 complex. This is accomplished by upregulation of upstream kinases, like ATM (ataxia telangiectasia mutated) or ATR (ataxia telangiectasia and Rad3-related), which phosphorylate p53 at Ser15, Thr18, and Ser20 inducing p53 release from the complex and its stabilization and activating its apoptotic functions 18.
Figure 3 Induction of apoptosis by the tumor suppressor p5318.
Full knowledge and understanding of these mechanisms is crucial, since it represents another possible strategy for cancer therapy and treatment.
1.5. Copper complex
Copper based compounds provide a potential alternative to the standard chemotherapy, as they are known to induce the production reactive oxygen species (ROS), and have nuclease activity 24. Indeed, several studies have shown that copper compounds interact with DNA (mainly by double-strand cleavage) and with proteins (namely, Human Serum Albumin) 24,25,26,27. Copper, like other trace metals, is essential to proteins involved in several biological processes, including respiration, metabolism, DNA synthesis and oxidation-reduction reactions 25,26.
On this thesis it will be investigated the biological characterization of the antitumor potential of the tri-copper compound, referred to as compound C9 from herein, (Figure
6
4). Other tri-copper compound have shown promising results in this field, both in in vitro
and in vivo studies with significant antitumor activity 27,28,29.
Figure 4 Chemical structure of compound C9. Adapted from Mahmudov, K et al. 2014. 30
1.6. Nanovectorization
The vast majority of chemotherapeutic drugs diffuse rapidly to healthy cells, exhibit a short half-life in the blood stream and a high overall clearance rate 1, which can impose a serious problem when treating cancer. To overcome this problem, the utilization of nanoparticles (NP) as non-toxic vectors to delivery drugs on specific cancer cells or tissues has been increasingly reported 31, thus optimizing the biodistribution of drugs, reducing the off-target effects and hence the commonly related toxic side effects 1,32. In fact, NPs improve conventional cancer drugs, by increasing solubility, decreasing systemic toxicity and slowing compound degradation, resulting in larger half-lives and consequently lower dosage 32.
Among noble metal nanoparticles, gold NP (AuNP) are the most synthetized and explored nanocarriers that offer a plethora of advantageous features, such as, optical properties, chemical stability and high surface-to-volume ratio 33,34,35. AuNPs have unique properties, such as surface plasma resonance absorbance and resonance light scattering (LSPR), biocompatibility, are easily synthesized with a controlled size and shape, and can be multifunctionalized with a myriad of biomolecules, suitable for targeting purposes 32.
1.7. Aim
The main aim of the present thesis is the full characterization of the antitumour effect of the C9 copper compound, its biological targets and molecular mechanisms. For that, the cytotoxic and cytostatic potential, DNA and protein interaction studies, mechanisms of cell death and comparative proteomics will be analyzed. Once this is achieved, loading of the compound onto AuNPs will be attempted towards development of a nanovector for selective delivery of the drug.
7
2. Materials and methods
2.1. Compound under study
The compound studied in this work was synthetized in Instituto Superior Técnico (IST), by Kamran T. Mahmudov 30 and was transported in powder form. The chemical formula, molar mass, stock concentration and solvent are shown in Table 1Erro! A origem da referência não foi encontrada..
Table 1 Information concerning the compound at study.
Compound Code Chemical Formula Molar Mass
(gmol-1)
Stock concentration
(mg ml-1) Solvent
C9 [Cu3(μ3-OH)-(NO3)(CH3OH)(μ2-X)3(μ2-HL3)] 947.29 10 DMSO
2.2. Cellular lines under study
Viability assays were performed using HCT-116 36 (Human Colorectal Carcinoma) and A549 37 (Non-small cell lung adenocarcinoma) cell lines and Fibroblasts 38, a primary dermal neonatal cell line.
HCT-116 was cultivated in Dulbecco’s Modified Eagle Medium (DMEM; Invitrogen, USA) supplemented with 10% (v/v) fetal bovine serum (FBS; Invitrogen, USA) and 1% (v/v) of antibiotic Penicillin and antimicotic Streptomicin (Invitrogen, USA). Moreover, Fibroblasts cell culture medium was further supplemented with 1% (v/v) of Non Essencial Aminoacids (NEA) 100x (Sigma, USA).
All cell lines were incubated in 25 or 75 cm2 culture flasks with ventilated cap (VWR, USA), on a CO2 incubator (SANYO CO2 Incubator, Electric Biomedical Co., Japan) at 37ºC and in an atmosphere of 99 % (v/v) humidity and 5% (v/v) CO2.
Cell culture renewal was performed whenever the culture presented a confluence between 80 and 90% in the culture flask, as at this point the growth medium is often exhausted and cells evidence signs of contact inhibition and processes of cell death and degeneration. The depleted culture medium was removed, 2 ml of trypsin TrypLETM Express Gibco by Life TechnologiesTM were added, and incubated for 5 min in the incubator mentioned above, in order to promote cell detachment. Following the incubation period, cell culture medium was added in an equivalent proportion, in order to block trypsin activity. All volume was transferred to a falcon tube and, centrifuged (Sigma 3-16K 10280, Germany) for 5 min, at 1500 rpm, at 15-20 °C. After centrifugation, the supernatant was removed and the pellet resuspended in 2 ml of fresh medium.
8
Cell density was determined using the Trypan Blue staining method and through a Neubauer chamber (Hirschmann, Germany), observed on a low resolution microscope (Olympus CXX41 inverted microscope, Tokyo, Japan). This specific dye doesn’t penetrate the cell membrane of living cells, staining the apoptotic or damaged ones. For this procedure, 350 µL of DMEM, 50 µL of cellular suspension and 100 µL of Trypan Blue (Sigma, Germany) were mixed together and loaded onto the chamber. Cell viability was calculated by the following equation:
Cells ml
=
total number of cells in the 4 squares
4
×10
5
(Eq.1)
where 105 consists on the multiplication of the Neubauer chamber dilution (104) with the dilution of the Trypan blue solution (101).
2.3. Cytotoxic potential evaluation - Cellular Viability Assay
To evaluate the in vitro cytotoxicity of all compounds, CellTiter 96® Aqueous Non-Radioactive Cell Proliferation Assay (Promega, USA), a colorimetric method for determining the number of viable cells in proliferation, was performed as described previously by Silva and colleagues39. Cells were incubated with fresh medium with compound C9 (concentrations between 0.1 and 100 µM) or by 0.1 % (v/v) DMSO (as vehicle control).
2.4. Evaluation of apoptotic potential 2.4.1. Hoechst 33258 staining
HCT-116 cells were collected as described previously in section 2.2. Cells were seeded in 35 mm2 dish plates (VWR, USA) at a density of 1x10⁵ cell/mL and incubated in the condition described in section 2.2. A lamellae previously sterilized with 70% (v/v) ethanol, and washed with PBS 1X, was set at the bottom of each dish. After 24h, depleted medium was replaced with fresh medium with IC50 corresponding concentration (5.4 µM), 1.5x IC50 (8.1 µM) or with 0.1% (v/v) DMSO (vehicle control). After a 48 h incubation period, cell culture medium was discarded, cells were rinsed trice with PBS 1X, were readily fixed with 400 μL solution of 4% (v/v) paraformaldehyde diluted in PBS 1X and incubated in the absence of light for 10 min. For staining, 400 μL solution of Hoechst 33258 (Sigma) was added, containing 0.8 μL Hoechst 33258 (5 mg/mL) in 400 μL of PBS 1X, followed by a 15 min in the absence of light and at room temperature, and was once again rinsed with 400 μL PBS 1X. Separately slides were prepared with 5 μL droplets of a glycerol solution diluted in PBS 1X (1:3 ratio). Inverted
9 lamellae, containing fixed cell samples were carefully placed on top of each droplet, and visualized and photographed in a Olympus BX51 fluorescent microscope with an attached Olympus DP50 (Olympus) camera. Photographs were acquired with Infarview software.
2.4.2. Annexin V-FITC and Propidium Iodide Staining
HCT-116 cells were collected as described previously in section 2.2. Cells were seeded in 35 mm2 dish plates (VWR, USA) at a density of 1x10⁵ cell/mL and incubated in the conditions described in section 2.2. After 24h, the old medium was replaced with fresh medium with IC50 corresponding concentration (5.4 µM), 1.5x IC50 (8.1 µM) or with 0.1% (v/v) DMSO (vehicle control).
After a 48h incubation period, the medium was discarded and cells were collected by trypsinization and centrifuged at 2000 rpm for 5 min. Supernatants were discarded and the cell pellets were washed trice with 1 mL PBS 1X intercalated with 5 min centrifugations at 2000 rpm. Following centrifugations, 100 μL of Annexin Binding Buffer 1X, 5 μL of Annexin V and 2 μL of Propidium Iodide was added to all cell samples, and incubated for 15 min at room temperature in the absence of light. Sequentially, further 400 μL of Annexin Binding Buffer 1X and 500 μL of PBS 1X were added (final volume up to 1 mL). Cell samples were analyzed by flow cytometry on an Attune® Acoustic Focusing Flow Cytometer (Life Technologies, California), through the acquisition of at least 10000 events for each experimental condition.
2.5. Western Blot
2.5.1. Sample Preparation
For whole protein extraction, 5.33x10⁵ cells/mL HCT-116 cells were seeded in 35 mm2 dishes and after 24h incubation in the conditions mentioned in section 2.2, the medium was removed and fresh medium was added with 0.1% (v/v) DMSO or compound (IC50). Afterward for each time point, the medium was again removed, and cells were washed three times with PBS 1X. All cells were scrapped out of the dish with the help of a scrapper and collected to an Eppendorf tube on ice. All samples were centrifuged at 500 g, for 5 min at 4ºC, and the supernatant discarded. Additionally, 20 µL of lysis buffer were added to the pellet and samples were stored at -80ºC, until further processing. After thawing, all samples were sonicated and centrifuged at 500 g during 5 min.
10
For protein quantification, Pierce method was used. On a 96-well plate, 1 µL of sample was added to 9 µL of distillate water and 150 µL of Pierce reagent. Samples were incubated for 5 min and the absorbance was read at 660 nm on a microplate photometer (Infinite M200, Tecan, Switzerland). In parallel, a calibration curve was performed, using 10 µL of different BSA concentrations (125-2000 µg/mL) and 150 µL of Pierce reagent. Protein concentration was determined after interpolation from the calibration curve.
After quantification, exactly 50 µg were transferred to another Eppendorf tube together with SDS Loading Buffer 4X and DTT, boiled for 5 min, and immediately put on ice until loaded to the gel.
2.5.2. SDS-PAGE
A 12% acrylamide resolving gel and a 5% acrylamide stacking gel were prepared (the complete composition in Table 6, Appendix A). After polymerization, the gel was transferred to the electrophoresis apparatus where running buffer (0.25 M de Tris-HCl, 1.92 M glycine and 1% SDS) was added until covering the gel completely. The SDS-PAGE ran at 15 mA (per gel) for around 90 min, making sure that the loading buffer front did not run off the bottom of the gel.
2.5.3. Transfer to nitrocellulose membrane
After the SDS-PAGE was complete, electrotransfer to a nitrocellulose membrane was performed. For that, a sandwich was prepared with the gel in contact with the membrane, between a pair of filter paper sheets and sponges. The wet transfer was set up, and the tin was filled with cold transfer buffer (1X Formulation: 25 mM Tris, 192 mM Glycine, 20% (v/v) methanol, pH ~8.3) until the sandwich was fully covered. The transfer process ran over-night, at 20 V, at 4ºC.
2.5.4. Primary and secondary antibody incubation
In order to block non-specific protein bidding, it was necessary to incubate the membrane with a blocking agent. The membrane was incubated for 45 min with fresh 5% non-fat milk in TBST buffer (composition of TBST 10X: 50 mM Tris, 150 mM NaCl and 0,5% Tween 20).
Next, the membrane was exposed to primary antibody in 5% non-fat milk in TBST and was left to incubate for 1 h on a shaker, at room temperature. Concluded this time, the membrane was washed trice with TBST buffer again on a shaker, at room temperature for 5 min each washing step. Exactly the same procedure above was employed to the
11 membrane for the secondary antibody (1:3000, Anti-mouse IgG, HRP-linked Antibody, Cell Signaling Technology, USA).
Each membrane was incubated with a different primary antibody such as anti-Bax, anti Bcl2 (1:1000) or anti-p53 (1:5000) (Sigma, USA). All membrane were stripped with stripping buffer (0.1M Glycine, 20 mM Magnesium Acetate and 50 mM Potassium Chloride) and then re-incubated with anti-actin (1:5000) (Sigma, USA) as endogenous control.
2.5.5. Film exposure
In order to detect the protein band on the membrane, a WesternBright ECL subtract (Advansta, USA) was prepared. ECL is an enhanced chemiluminescent substrate for detection of horseradish peroxidase (HRP) activity from secondary antibodies. The membrane was then totally covered in substrate and incubated for 2 min. Sequentially, the film was exposed to the membrane, on a dark room.
2.6. DNA-compound interaction studies 2.6.1. UV titrations
The interaction assay was performed using Calf Thymus DNA (CT-DNA; Life Technologies, USA) which concentrations were determined using NanoDrop (Thermo Scientific, USA), through the Lambert-Beer equation.
The UV-Vis spectra for the interaction between DNA and compound C9 were obtained using an UVmini-1240 (Shimadzu, Germany). The compound concentration was kept constant (25 μM) while varying the DNA concentration from 0 to 500 μM. Samples were prepared in 5 mM Tris-HCl (Merck), 50 mM NaCl (Panreac), pH 7 buffer, and were incubated at 37 °C for 24 h.
Maximum absorbance values were fitted in the following equation in order to obtain intrinsic binding constant, Kb, of the respective compounds:
DNA (εa-εf)= DNA (εa-εf)+ 1 Kb(εb-εf) (Eq.2)
where εa, εf , and εb are the apparent, free and bound complex extinction coefficients, respectively. In particular, εf was determined by a calibration curve of the isolated metal complex in aqueous solution.
12
2.6.2. DNA cleavage assay and electrophoretic mobility shift assay (EMSA) Plasmid DNA pUC19 was obtain by bacterial transformation, using NZY-A PCR cloning kit NZY-A PCR cloning kit (NZYtech, Portugal) according to the manufacturer’s instructions. pDNA was quantified with NanoDrop and stored at -20ºC until used. DNA cleavage assays were performed maintaining the pDNA (pUC19) concentration at 10 ng/μL, while the C9 concentration varied from 10 to 200 µM, diluted in Tris NaCl buffer considering a final volume of 20 µL. pDNA without compound, linearized and with DMSO were prepared as control samples. All samples were incubated for 24h at 37ºC and quenched by adding LB-EDTA (0,25mM EDTA plus 5x loading buffer) followed by storage at -20ºC.
The EMSA assay was accomplished by maintaining the pDNA (pUC19) concentration at 10 ng/μL, with two different C9 concentrations (10 and 200 µM). This samples were incubated at 37ºC for different times (1h, 6h, 12h, 24h and 48h) and then were quenched as described above.
For both electrophoresis, samples were loaded into a 0.8% (w/v) agarose gel in 1X TAE (composition to 1L TAE 10X: 1.7 M NaCl, 0.03 M KCl, 0.1 M Na2HPO4 and 0.01 M K2HPO4) buffer and the electrophoresis ran for 2h at 70 V, with λ DNA/HindIII as a molecular weight marker. Sequentially, the results were visualized using Molecular Imager® Gel Doc™ XR+ System with Image Lab™ Software (BioRad, California) and the image was obtained with GelDoc software.
2.7. Cell cycle Progression Assay
HCT-116 cells were seeded in 25 cm2 culture flasks, at a cell density of 1x10⁵ cells/mL and incubated in the above conditions. After 8h of seeding, the first thymidine block was performed by the addition of 2 mM thymidine (Sigma) in culture medium. Cell incubated for a further 14h and afterwards depleted medium was removed and culture flasks were incubated without thymidine for an additional 10h, at the end of which it was added 2 mM thymidine (with the same procedure as for the first block). Finished the double blockage, the medium was replaced by fresh medium with IC50 concentration of compound C9 or by 0.1 % (v/v) DMSO (as vehicle control), and was left incubating during 3h, 6h and 9h.
Cell samples were collected by trypsinization as described in section 2.4 in 15 mL falcons, and centrifuged at 2000 rpm for 5 min at 4 ºC. Supernatant was removed and the cell pellet resuspended in cold PBS 1X and centrifuged again at 2000 rpm.
13 Supernatant was discarded and pellet was resuspended in 1 mL PBS 1X followed by 1 mL of an 80% (v/v) ethanol solution. The ethanol solution was added carefully and progressively into the cell suspension, gentle agitating in vortex. Cell samples were then maintained in ice for a period of 30 min, and then stored at 4 ºC for at least 18h prior to analysis. For a synchronization control, cells from a separate culture flask were immediately collected and fixed after the end of the thymidine block procedure, and were considered as the initial time point.
Falcons were centrifuged at 2000 rpm for 5 min at 4 ºC, and the supernatant was discarded, The remaining cell pellet was resuspended in 1 mL of a Propidium Iodide solution (50 μg/mL Propidium Iodide, 200 mL distilled water, 0.1% sodium citrate, 0.02 ng/mL RNAse, 0.20% Nonidet P-40; pH=7) and incubated at room temperature for 30 min. Cell cycle progression analysis was performed in a Attune® Acoustic Focusing Flow Cytometer.
2.8. BSA-compound interaction studies
BSA-compound interaction measurements were achieve by both absorbance and fluorescence spectroscopy.
The fluorescence intensity measurements were performed at room temperature, using a Cary Eclipse Fluorescence spectrophotometer at excitation wavelength of 295 nm and recorded in the frequency range of 305 to 500 nm. BSA concentration was kept constant (2.0 μM), and incubated with a range of compound C9 concentrations (0 to 30 µM). BSA stock solutions were prepared in 10 mM pH 7.0 phosphate buffer with 0.15 M NaCl. The samples of serum albumin and of each compound were mixed in order to obtain the desired concentrations and next incubated for 24h at 37 ºC.
The UV-visible spectrum (UVmini-1240, Shimadzu, Germany) was red between 230 and 400 nm. BSA concentration was again kept constant at 15 μM and compound concentration and incubation condition was the same as for fluorescence assay.
2.9. Synthesis, Functionalization, Characterization of Nanoconjugates 2.9.1. Nanoparticle synthesis and characterization
Gold Nanoparticles (AuNPs) were synthetized by the citrate reduction method, described by Lee and Meisel 40. 250 mL of 1 mM HAuCl4 (Sigma, USA) was brought to a boil while stirring, in a 500 mL round-bottom flask. When in reflux, 25 mL of 38.8 mM of sodium citrate (Sigma, USA) was added and kept refluxing for 20 min with continuous stirring. After this time, the colloidal solution was cooled to room
14
temperature, with continuous stirring, and transferred to a flask and stored away from light at room temperature. All solutions were prepared with milli-Q water. All glass material was previously prepared by immersing in fresh aqua regia overnight, to eliminate any residues and subsequently washed around 10 times with distilled water and around 5 times with mili-Q water.
AuNPs were characterized by three different techniques: UV-vis spectroscopy, Dynamic Light Scattering (DLS) and Transmission Electron Microscopy (TEM). UV-vis spectra for AuNP was acquired from 400 nm to 800 nm in a UV-Vis spectrophotometer (UVmini-1240, Shimadzu, Germany). DLS was performed with 2 nM of AuNPs, AuNPs@PEG and AuNPs@PEG@C9 dissolved in milli-Q water, using a Nanoparticle Analyzer SZ-100 (Horiba Scientific, Japan) at 25 ºC, with a scattering angle of 90 º. A total of 3 measures were taken for each sample. TEM was performed at Instituto Superior Técnico (ICEMS/IST), Portugal – contracted service. The samples were prepared by depositing 10 μL of the colloidal solution of gold in carbon copper grids, washing twice with milli-Q water and air dried.
2.9.2. Functionalization with PEG and characterization
Immediately after synthesis, AuNPs were functionalized with a bifunctional polyethylene glycol (PEG) molecule (Iris BIOTECH) containing a thiol group at one end of the molecule and a carboxyl group at the other end - HS-EG(8)-COOH – AuNP@PEG.
In order to obtain a complete saturation of PEG on the particle surface, it was used 0.035 mg/mL of PEG. For the functionalization, a 50 mL solution was made, containing 0.028% SDS, 10 nM of naked AuNP, and 0.035 mg/mL of PEG and milli-Q water for the remaining volume. This solution was left for 16h in constant stirring. Afterwards, the solution was centrifuged at 14000 g for 30 min three times, replacing the supernatant for milli-Q water, except for the last centrifugation that the particles samples remain concentrated.
To determine the number of PEG molecules bound to each AuNP, the Ellman’s Assay 41 was performed. For this assay, 200 µL of newly centrifuge sample’s supernatant, 100 µL of phosphate buffer 0.5M pH 7and 7 µL of DTNB was added to each well. After 10 min incubation, the absorbance was read at 412 nm. Simultaneously, a linear standard curve was prepared with PEG concentration ranging from 0 to 0.1 mg/mL, in which the supernatant was substituted for the different PEG concentrations. Quantification of thiolated chains was determined after interpolation from the standard curve.
15 2.9.3. Functionalization with compound and characterization
For the functionalization with compound, 1 mL solution was made, containing 6 nM of previously pegylated AuNP, 50 µM of C9 compound and milli-Q water for the remaining volume. The solution was incubated for 1h at 4ºC, centrifuged once at 14000 rpm for 30 min and the supernatant removed. The characterization was performed by UV-vis spectroscopy and by DLS as described in section 2.10.1.
2.9.4. Viability assays with nanoparticles
This assay was performed the same way as in section 2.3. and was done with a concentration of AuNP@PEG@C9 that correspond to the C9 IC50 on top of the particle, the same concentration of AuNP@PEG and IC50 value of free C9.
2.10. Proteomics
2.10.1. Sample Preparation
HCT-116 cells were seeded in 75 cm2 culture flasks, at a cell density of 35x105 cells/mL and incubated in the conditions described in section 2.2. After 24h, depleted medium was removed and the IC50 corresponding compound concentration (5.4 µM) or with 0.1% (v/v) DMSO (vehicle control) was added. After 48h, cell samples were collected by trypsinization as described in section 2.4 in 15 mL falcons, and centrifuged at 2000 rpm for 5 min at 4 ºC. Cell sediments were rinsed trice with PBS 1X, and centrifuged in between, in the same conditions as mentioned above.
For whole protein extraction, cells were resuspended in a cell lysis solution (100 μL per 4x10⁶ cells/mL) containing NaCl-Tris-EDTA buffer (150 mM NaCl; 50 mM Tris, pH=8; 5 mM EDTA), phosphatase inhibitors 1x (PhosStop, Roche), protease inhibitors 1x (complete ULTRA Tablets, Mini, EASYpack, Roche, Switzerland), 0.1 % (w/v) dithiothreitol (DTT) (AMRESCO, USA), 1 mM of phenylmethylsulfonyl fluoride (PMSF) (Sigma), and 2 % (w/v) Nonidet P-40 (Thermo Scientific, EUA), and were submitted to ultrasonication (shown in Table 2).
Table 2 Ultrasonication protein extraction protocol.
Cycles Bursts Output (%)
5 10 60
15 20 70
15 20 80
* Samples were maintained in ice for 30 seconds between cycles to avoid overheating and protein loss due to shear forces.
16
2.10.2. Whole Protein Precipitation and Purification: 2-D Clean-Up Kit
Cell lysates were centrifuged 13000 g for 15 min and supernatants were recovered and stored at -80 ºC. For whole protein precipitation and purification 2-D Clean-Up Kit (GE Healthcare, United Kingdom) was used accordingly with manufacturer protocol except for wash additive and wash buffer step were cell lysates were incubated overnight at -20 ºC.
After centrifugation, 100 μL of re-hydration buffer (7M urea (BDH Prolabo, VWR, USA), 2M Tiourea (Merck, Germany), 2% (w/v) CHAPS ((3-[3-Cholamidopropyl) dimethylammonio]-1-propanesulfonate) (GE Healthcare), phosphatase inhibitors 1x, protease inhibitors 1x, bromophenol blue (Merck), 1 μL 10 % (w/v) DTT and 1μL of 100 mM PMSF) was used to resuspend protein extract. After overnight incubation at room temperature whole protein extract was centrifuged at 13000 g for 15 min and the resulting supernatant recovered.
2.10.3. Whole Protein Quantification: Pierce Reagent 660 nm
For whole protein quantification, Pierce method was used, as described section 2.5.1. 2.10.4. 2-D Gel Electrophoresis: Isoelectric Focusing
Isoelectric focusing (IEF), was performed by in-gel active rehydration using the Ettan IPGphor3 IEF System (GE Healthcare). 150 μg of whole protein sample was uniformly distributed into each 7 cm IPG strip holder (GE Healthcare), resuspended in 125 μL of rehydration solution supplemented with 0.5% Immobilized pH gradient (IPG) (GE Healthcare) and 0.5% of destreak (GE Healthcare), Immediately after, a 7 cm long Immobiline DryStrip pH 3-10 NL (GE Healthcare) was placed over the sample, ensuring that no bubbles were formed between the gel and the sample. Additionally 750 μL of Drystrip Cover Fluid (GE Healthcare) were added over the strip in order to protect the strip from drying. The IEF program is present in Table 3.
Table 3 2-D gel electrophoresis IEF five step program.
Steps Voltage (V) Time (h) Temperature (°C)
1 30 14 20 2 100 0.5 3 500 0.5 4 1000 0.5 5 5000 1
17 2.10.5. 2-D Gel Electrophoresis: SDS-PAGE
Immediately after IEF the 7 cm long Immobiline DryStrip pH 3-10 NL (GE Healthcare) was incubated with a 5 mL solution comprised of 70 mM Tris-HCl pH 8.8, 6M Urea, 30 % (v/v) glycerol, 2 % (w/v) SDS and 1 % (w/v) DTT (GE Healthcare) for 15 min, followed by a second solution further supplemented with 2.5 % (w/v) iodoacetamide (GE Healthcare), incubated for another 15 min.
For the second-dimension run a SDS-PAGE Mini-PROTEAN® 3 System was used. A 12 % (v/v) polyacrylamide gel was prepared (see Table 7 in Appendix A for gel composition). After gel polymerization (approximately 30 min) IPG strips were put on top of each gel and sealed with an agarose solution (0.5 % (w/v) agarose diluted in running buffer (3.79 g/L Tris, 18 g/L glycine, 1.25 g/L SDS, and evidences of bromophenol blue). SDS-PAGE ran for 30 min at 30 V and then 150 V until de bromophenol blue ran out from the gel.
2.10.6. Detection and Digital Imaging
Gel staining was performed using 3 PhasTGelTM Blue R tablets (Coomassie R350) (GE Healthcare) diluted in 1 L, 10 % (v/v) acetic acid. Gel was immersed in Commassie solution for 30 min at 50ºC followed by another 30 min at room temperature with agitation. After this time, the gel was rinsed with milli-Q water until appropriate contrast was obtained for protein spot detection.
Images of the 2-DE gels were acquired through Magic Scan software in Tiff and Lab Scan format, and protein spot analysis was carried out by Melanie 7.0 software (GeneBio, Genebra, Switzerland). Protein spot comparison was conducted between DMSO and compound C9 gels in order to evaluate abundance level variation, calculated through the ratio between the intensity of each sample spot and its homologous spot in the control gel. Abundance levels ≤ 0.7 and ≥ 1.5 were considered significant.
2.11. Complementary Assays
2.11.1. Compound stability in different pH and time-points
For the evaluation of the compound stability in different pH and time-points, 25 µM of C9 compound was incubated in buffer 5 mM Tris-HCl, 50 mM NaCl, with different pH values, from 6 to 8, for 24h. Then, the absorbance spectrum was red on from 230 nm to 500 nm in a UV-Vis spectrophotometer (UVmini-1240, Shimadzu, Germany).
18
3. Results and Discussion
3.1. Cytotoxic potential evaluation 3.1.1. Cellular Viability assays
The antiproliferative potential of C9 was evaluated after exposure of HCT116 and A549 cancer cell lines to increasing concentrations of compound. The CellTiter CellTiter 96® AQueous Non-Radioactive Cell Proliferation assay was performed in order to determine the cytotoxicity, in which the number of viable cells in proliferation is correlated with the amount of formazan originated from the bioreduction of MTS by mitochondrial dehydrogenases of metabolically active cells 39,42. From the results obtained with this method, it was possible to calculate the compound’s IC50, the compound concentration corresponding to the halfway point of the dose-response curve between the maximum and minimum and observed viability plateaus 43, resorting to GraphPad software. In order to compare the cytotoxic effect in healthy cells, normal primary fibroblasts were also exposed to increasing concentrations of C9 compound. The respective IC50 was also calculated.
As observed in Figure 5, the compound has a significant effect in the reduction of HCT116 (IC505.4 µM) cell viability but no cytotoxic effect on A549 cells (IC5058.17 µM; A549 dose dependent cytotoxicity graph in Appendix B). The IC50 value observed for HCT116 cells is in the same order of magnitude of 5- Fluorouracil (IC50 5 µM), one of the most common drugs found in chemotherapy cocktails used to treat colorectal cancer 44,45.
Figure 5Dose dependent cytotoxicity of compound C9 on HCT116 (left) and Fibroblasts (right). The data are represented as means ± SEM of at least three independent experiments; *p < 0.05, as compared with the control group. Cell viability values were normalized in relation to the control group without compounds (only DMSO).
Compared to healthy cells (IC50 30.1 µM) the IC50 value of HCT116 is approximately 5.5-fold lower, which translates into the ability of this concentration to reduce 50% of the colorectal cancer cell population, without major effects on Fibroblasts (Figure 5). In this context HCT116 cell line was chosen as the cancer model for further studies.