Revista Brasileira de Estudos Regionais e Urbanos (RBERU) v. 13, n. 3, p. 357-378, 2019
http://www.revistaaber.org.br
WIND POWER AND THE LABOR MARKET IN THE BRAZILIAN NORTHEAST: A SPATIAL PROPENSITY SCORE MATCHING APPROACH*
Thiago Pastorelli Rodrigues
Energy Research Office (EPE) and University of São Paulo (USP) E-mail: [email protected]
Solange Ledi Gonçalves Federal University of São Paulo (UNIFESP)
E-mail: [email protected] André Squarize Chagas University of São Paulo (USP)
E-mail: [email protected]
ABSTRACT: Debates on the importance of renewable energy sources have arisen in the context of climate change. Wind power is a renewable and clean energy source with minimal environmental impact. Also, the existing literature indicates that the installation of wind farms can be an important channel for local development through job and income generation. In this context, this study aims to analyze the relationship between the presence of wind farms and the labor market outcomes of the municipalities of the Northeast region of Brazil, which contains around 80% of the installed capacity of this technology in the country. The database of this study is built from several public data sources. The methodological approach taken was a combination of propensity score matching and the estimation of the average treatment effect. However, we consider the existence of spatial dependence of the municipalities in the estimation of the propensity score. The results suggest that the presence of wind power plants is positively related to increases in the total wage of the municipalities, mostly in sectors such as construction, transportation, and logistics. In addition, the presence of these plants allows the shifting of resources to the agricultural sector.
Keywords: Wind energy; Spatial propensity score matching; Local development. JEL Codes: Q42; C31; R58.
ENERGIA EÓLICA E O MERCADO DE TRABALHO NA REGIÃO NORDESTE DO BRASIL: UMA ABORDAGEM DE PAREAMENTO POR ESCORE DE PROPENSÃO
ESPACIAL
RESUMO: O debate acerca do potencial da energia eólica surge no contexto das discussões sobre mudanças climáticas. A energia eólica é uma fonte de energia renovável, limpa e de baixo impacto ambiental. Além disso, a literatura indica que a implantação de usinas eólicas pode ser um importante canal de desenvolvimento local ao gerar empregos e renda. Nesse sentido, este estudo busca analisar a relação entre a instalação de parques eólicos nos municípios da região Nordeste do Brasil, a qual concentra cerca de 80% da capacidade instalada dessa tecnologia no país, e os resultados de mercado de trabalho da região. A base de dados deste trabalho é construída a partir de várias fontes de dados públicos. A metodologia empregada é o pareamento por escore de propensão, além do cálculo do efeito médio de tratamento nos tratados. Em decorrência da natureza espacial das unidades observadas, a existência de dependência espacial é considerada na estimação. Os resultados sugerem que a implantação de usinas eólicas pode elevar a massa salarial nos setores de construção, transporte e logística. Além disso, a presença dessas usinas pode deslocar recursos para o setor agropecuário.
Palavras-chave: Energia eólica; Pareamento por escore de propensão espacial; Desenvolvimento local. Classificação JEL: Q42; C31; R58.
1. Introduction
The electricity sector is essential for the growth and development of any economy. For this reason, understanding the determinants of supply and demand in this sector is strategic in public
policy formulation1. Debates on the importance of renewable energy sources have arisen in the
context of climate change. The Kyoto Protocol, created at the United Nations Framework Convention on Climate Change (UNFCCC) in 1997 and came into force in 2005, was a relevant agreement in the promotion of the use of renewable energy. This agreement set targets for reducing greenhouse gas emissions, from which each country sought to implement the use of renewable energy according to its characteristics and potential (MORENO; LOPEZ, 2008). In December 2015, during the 21st Conference of the Parties in Paris (COP21), governments of around 190 countries presented their plans to reduce domestic greenhouse gas emissions. Brazil committed to reduce its emissions by 37% as of 2025 and by 43% as of 2030 from the 2005 levels (EPE, 2016).
Given this context, wind energy is deemed an important renewable source of energy since it has a high potential in reducing greenhouse gas emissions, although it is not equally distributed in space. However, this source of renewable energy is not widely used worldwide, notwithstanding that it could, theoretically, supply up to 20% of world electricity demand by 2050 (EDENHOFER et al., 2011). In addition to environmental impacts, some studies provide evidence demonstrating that advancing the production of renewable energy sources, especially wind energy, may be relevant to the local development of regions impacted by the installation of wind farms. Wei et al. (2010) argue that many local jobs can be generated, mainly at the construction and installation stages of such plants. Río and Burguillo (2008) also show that the implementation of renewable energy projects can contribute to local development, especially in rural areas. These authors further argue that during the construction phase, an increase in the demand for goods and services is expected, and local suppliers are benefited from increased income and temporary jobs, inside and outside the communities. In addition, changes in community structure can occur, such as improving public infrastructure, lower-cost energy supply, and more.
Despite the existence of many studies focused on the socioeconomic impacts of other renewable
energy sources2, literature that specifically addresses the effects of wind energy on local development
is merely recent and scarce. Blanco and Rodrigues (2009) showed that the deployment of wind energy in countries in the European Union creates a significant number of direct jobs, mainly in the wind turbine and component industry. Ejdemo and Söderholm (2015) have identified the impacts on employment in the Swedish construction sector. Concerning Brazil, Simas and Pacca (2014) have verified that the main contribution is in the construction phase and that, despite the low number of jobs created in operation and maintenance of the farms, these jobs have persisted over time.
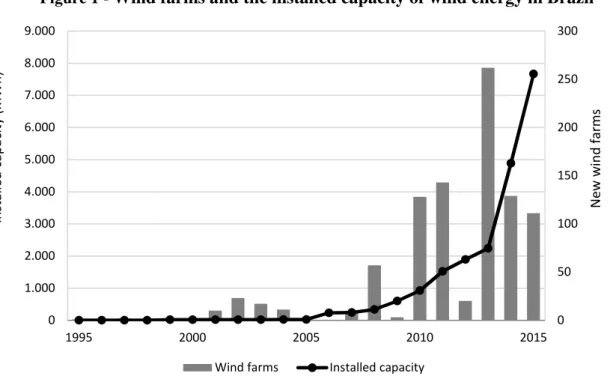
According to data from the Brazilian Electricity Regulatory Agency (ANEEL), the installed capacity of wind energy in Brazil grew by approximately 430% between 2010 and 2014, from 927 MWh to 4,888 MWh. In addition, data from ANEEL indicate that wind farm records in Brazil began in 1995 and have grown significantly from 2010 (see Figure 1). According to the Global Wind Energy Council (GWEC) report, Brazil, in 2015, was the Latin American country with the largest installed capacity of wind power energy (5.96 MWh) and was ranked tenth in the global ranking for installed capacity, accounting for 2% of the global share of accumulated capacity this year (8.72 GW). In addition, Brazil was the country ranked fourth in the ranking of the new installed capacity of wind power generation (2.76 GW) in 2015.
1 For a literature review on the conditions of electricity demand in Brazil, see Uhr et al. (2017 and 2019).
2 For a literature review on the potential of various renewable energy sources in creating jobs, see Wei et al. (2010) and
Figure 1- Wind farms and the installed capacity of wind energy in Brazil
Source: Elaborated by the authors, based on data from ANEEL.
Given these facts and the small number of studies that have analyzed the impact of wind farms on local development, this article aims to understand the relationship between the implementation of wind farms and the labor market results of the municipalities of the Northeast region of Brazil, focusing on three main variables: (i) employment level, (ii) the total amount of wages, and (iii) the number of firms.
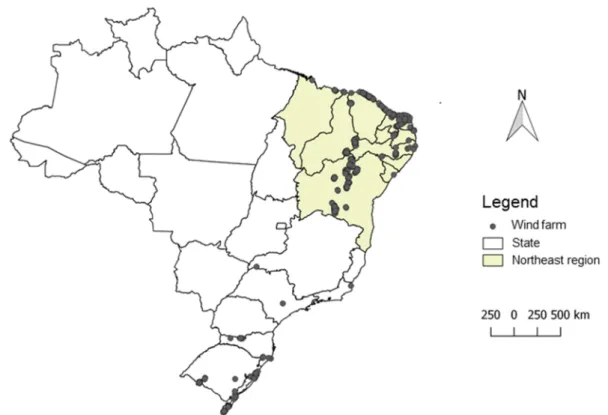
Brazil’s Northeast region accounts for 54% of the country’s wind potential. Moreover, in this region, the sources of wind and hydroelectric power are complementary, because the periods of drought, when the reservoirs of the dams are at the lowest level, coincide with the period of highest incidence and intensity of winds (COSTA et al., 2009). According to ANEEL, 80% of the municipalities with wind farms, in operation or under construction, are located in this region. Figure 2 shows the spatial distribution of wind farms in Brazil and illustrates this intense concentration in the Northeast region, highlighted in gray.
The main contribution of this paper is to relate the implementation of wind farms and the labor market outcomes of the municipalities, through the spatial propensity score matching method as well as the calculation of the average treatment effect on the treated. This methodological approach allows the determination of a control group of municipalities, statistically similar to the treatment group of municipalities, in terms of specific observable characteristics, with the presence of wind farms as the only factor that differentiates the groups. We considered the existence of spatial dependence in the estimate of the propensity score, due to the spatial nature of the units analyzed (CHAGAS et al., 2012).
We concentrated our analysis for the year 2013, and we built our database based on two ANEEL databases, the Georeferenced Information System of the Electricity Sector (SIGEL) and the Generation Information Data (BIG), in addition to the Annual Social Information Report (RAIS), from the Brazilian Ministry of Economy, and other variables from the Brazilian Institute of Geography and Statistics (IBGE) and the National Institute for Space Research (INPE).
0 50 100 150 200 250 300 0 1.000 2.000 3.000 4.000 5.000 6.000 7.000 8.000 9.000 1995 2000 2005 2010 2015 N e w w in d f a rm s In st a ll e d c a p a ci ty ( M W h )
Figure 2- Spatial distribution of wind farms in Brazil
Source: Elaborated by the authors, based on data from ANEEL.
The results suggest that the total wages of the construction, transportation, and logistics sectors are higher in municipalities that have wind farms, either in operation or under construction. In addition, municipalities that have wind farms in operation or under construction contain more firms in the agricultural sector, suggesting that the presence of wind power plants can lead to the transfer of resources to the agricultural sector, boosting this activity in the local economy. For the number of jobs in the municipalities, no statistically significant results were found.
The article contains six sections, besides this introduction, appendices, and bibliographical references. The second section consists of a brief literature review on wind energy in Brazil. The third section presents the empirical strategy of the paper and the description of the sample. The fourth section shows the descriptive analyses we conducted. The fifth section presents the results of our study. Lastly, the last section contains our final considerations.
2. Wind farms and the local development
Wind energy has grown exponentially in the world since the late 1990s, especially in the European Union and the United States. Wind energy stands out among renewable energy sources due to its lower production costs, the security of supply, and environmental sustainability (GWEC, 2011). Indeed, this energy source has some specific advantages: (i) the non-use of water and the absence of greenhouse gas emissions during the operation phase of wind turbines; (ii) the absence of danger of fuel leakage; (iii) the possibility of occupation of the land by agriculture or pasture, around the perimeter of the wind farm; (iv) the relatively small area occupied by wind turbines; and (5) the opportunity given to geographically isolated regions that have no available power grid but have strong winds, to generate energy without incurring high transmission costs (Costa, Casotti, and Azevedo,
2009)3.
3 Disadvantages of wind power generation include: (i) the threat to the life of wild animals, especially birds; ii) noise
In Brazil, the emergence of the Programme of Incentives for Alternative Electricity Sources (Proinfa) has also been identified as a contributor to the growth of wind farms in recent years. The main objectives of this program were: the diversification of the Brazilian energy matrix; the security of supply; the reduction of greenhouse gas emissions; and the exploration of regional and local characteristics and potentials, thereby generating employment and training for the workforce. This program was aimed at increasing the participation of electricity through incentives to independent producers, based on wind sources, small hydroelectric plants (PCHs), and biomass, in the National Interconnected System.
Thus, Proinfa can be regarded as a relevant milestone in the dissemination of wind energy in Brazil, with 44% of the implemented plants of the program are wind power plants. Several studies have highlighted the importance of public programs in the promotion of wind energy. Ohl and Eichhornb (2010) have stated that government policy is an essential step towards the implementation of renewable energy, including the development of wind energy. Bird et al. (2005), in turn, highlighted the role of financial incentives in terms of wind energy in Europe and the United States.
Government incentives and policies may be further justifiable if, in addition to environmental impacts, we take into account the effects of wind farms on the local development of regions affected by the installation of wind farms. Several studies have pointed to the generation of employment and mastery of technology as factors relevant to environmental preservation and energy security in terms of wind energy (MARTINS et al., 2008; SZARKA, 2006).
In this context, Blanco and Rodrigues (2009) have shown that many of the jobs generated by wind energy, especially those related to specialized services as well as the operation and maintenance of the plants, tend to be offered by local firms. These authors also determined that about 59% of direct jobs related to wind energy in Europe are in the component and turbine industries. They have also concluded that because much of the wind energy activity takes place locally (construction, operation, and maintenance), there is a positive relationship between the location of a wind farm and the number of new jobs.
On the other hand, Simas and Pacca (2015) found that, in Brazil, the jobs generated in construction correspond to about 55% of direct jobs and 40% of the total jobs created from the wind energy. They thereafter concluded that this is the stage of greater potential in terms of generating new jobs.
3. Empirical strategy
In this article, we use the propensity score matching (PSM) method. The existence of spatial dependence is taken into account in the estimates due to the spatial nature of the units analyzed (i.e., the municipalities).
3.1. Propensity score matching
Matching methods seek to obtain a control group statistically similar to the treatment group in terms of specific observable characteristics. Thus, in comparing two groups of municipalities with the same observable characteristics, the only factor that differentiates them is the existence or the expectation of the presence of a wind farm in its territory.
According to Khandker et al. (2010), under the assumptions of conditional independence and common support, the average treatment effect on the treated (ATT), for a subsample with observable characteristics, , can be written as:
= (1)| = 1, − (0)| = 1, (1)
where (1) is the potential outcome of the variable of interest under treatment and (0) is the potential outcome of the variable of interest in the absence of treatment.
The PSM method seeks to summarize the effects of different observable variables on a single index. Thus, treated and control municipalities with similar propensity scores are compared. Using the PSM, it is possible to construct a comparison group based on the probability of a municipality being treated ( ), conditioned on the observed characteristics X or the propensity score: ( ) =
( = 1| ). In this article, we estimated the propensity score using a probit model, such that:
( = 1| ) = Φ( ) (2)
where Φ is the cumulative distribution function (CDF) of the standard normal distribution and is the estimated parameter vector.
However, as the unit of interest in this study consists of the municipalities of the Northeast region of Brazil, the sample has a geographical nature; thus, the units analyzed may not be randomly distributed in space. Hence, the possibility of spatial dependence between the observed units should be considered in the propensity score estimation through the implementation of a spatial propensity score. Based on Chagas et al. (2012), the spatial dependence can be inserted into equation (2) in two
ways: through a regressor in the form of a spatially lagged dependent variable ( ) or in the structure
of the error term ( ). Formally, the spatial model is represented by:
= + +
= + (3)
where is the vector of the dependent variable, is a spatial weight matrix that characterizes the type of neighborhood relationship between municipalities, and are the spatial parameters, and is the error term. If ≠ 0 and = 0, the specification is known as the spatial autoregressive model
(SAR), and if = 0 and ≠ 0, the specification is called the spatial error model (SEM)4.
3.2. Treatment and control groups
According to the Georeferenced Information System of the Electricity Sector (SIGEL) from ANEEL, wind power plants can be classified as: (i) operation; (ii) construction with grant; (iii) construction not started; (iv) winner of the auction; (v) disabled; and (vi) Despacho de Requerimento de Outorga (DRO). Municipalities with wind farms, either in operation or under construction, with a grant, already have the minimum required infrastructure in the area. On the other hand, the other municipalities have only the expectation of the installation of a wind power plant. Thus, to analyze the relationship between the presence of wind farms in the municipalities in the Northeast region of Brazil and the variables that capture local development, three analysis groups were defined.
For Group 1, the treatment consists of the municipalities where there is at least one wind farm in operation or under construction with a grant and the control group, the municipalities with wind power plants at the project stage, that is, wind farms with statuses of construction not started, winner of the auction or DRO. For Group 2, the control group is expanded to include all other municipalities of the Northeast region, that is, those with no expectation of implementation of wind farms. Finally, Group 3 contains the municipalities with operating wind farms that are part of the Proinfa program in the treatment group, and the municipalities with operating wind farms that are not participating in this program in the control group. Figure 3 shows the spatial distribution of municipalities according to these groups. The red dots on the map are the treatment group municipalities, and the green dots are the control group municipalities. For all analyses, the reference year is 2013.
4 For more details on spatial models and spatial econometrics, see Anselin (2001), LeSage and Pace (2009), and Almeida
Figure 3 - Spatial distribution of the treatment and control groups
Source: Elaborated by the authors.
Note: Municipalities of the treatment group are in red color and municipalities of the control group are in gray color.
4. Database and variables
We build the database by aggregating two ANEEL databases, SIGEL and BIG. SIGEL presents georeferenced information from all registered or projected wind power plants. The data extracted from these sources are the power of the wind farm, the project registration date at ANEEL, the implementation stage of the wind farm, and the municipality where the wind farm is located. BIG presents information on wind farms that are at least in the construction phase with a grant. Although SIGEL has more detailed information on wind farms, BIG contains the beginning of the wind farm operation, information relevant for our analysis.
It is noteworthy that we have disregarded deactivated wind plants and wind plants with an installed capacity of 100 kilowatts (kW) or less since these wind power plants are not implemented for commercial purposes (ANEEL, 2014). Thus, we used these data to build the database at the municipal level and to define the treatment and control groups described in Section 3.2.
The objective of this paper is to analyze the relationship between the implementation of wind farms and variables that capture the level of welfare and local development of the municipalities of the Northeast region of Brazil. Thus, in this paper, the outcome or dependent variables, for which the average treatment effect on the treated is calculated, are the employment level, the total wages, and the number of firms in the municipalities analyzed.
We used RAIS data from the Brazilian Ministry of Economy in constructing the dependent variables of employment, wages, and the number of firms. We focused on workers with active employment relationship as of December 31, 2013. In addition to the total level of employment and wages in municipalities, we computed for the estimates using disaggregation based on (i) two
schooling level of workers – completed and not completed higher education5; (ii) economic sectors
defined by the Brazilian Classification of Occupations (CBO) – Agriculture, Industry and
Maintenance, and Services and Commerce6; and (iii) three subcategories of the Industry and
Maintenance sector – Construction, Electricity and Gas, and Transport and Logistics7. For wages, we
5 For this disaggregation, we use the filter for schooling after 2005 (IBGE), present in RAIS data.
6 For this disaggregation, we use the filter for CBO 2002 Large Groups, present in RAIS data. Agricultural, forestry, and
fishery jobs are aggregated to obtain the level of employment in Agriculture. Jobs from the production of industrial goods and services of repair and maintenance are aggregated to get the level of employment of Industry and Maintenance. Finally, jobs in administrative services, other services, salespeople in shops, and markets are aggregated to obtain the number of jobs in Services and Commerce.
7 For this disaggregation, in addition to the filter for the categories of CBO 2002, we use the filter for the workers of the
production of industrial goods and services among the groups of CNAE (National Classification of Economic Activities) 2.0. Jobs from transportation, storage, and mail are aggregated to get the number of Transport and Logistics.
applied a natural logarithm. For the total number of firms, we used a different form of disaggregation, since firms are heterogeneous in terms of worker educational level. Another difference can be seen in the breakdown by economic sector, due to the number of firms, it is only possible to apply filters based on IBGE Groups. Thus, this procedure implies consolidating the Industry with the Construction sector.
The first step of the empirical strategy is the propensity score estimation, in which some explanatory variables are considered for the probability of the municipalities belonging to the treatment group. The explanatory variables are wind speed, the ratio of agricultural gross domestic product (GDP) to total GDP, area of municipalities, population, and a dummy variable for the metropolitan region.
The wind speed of a locality is the explanatory variable for which we expect a positive and high magnitude impact on the probability of having a wind farm, given that this is one of the main criteria evaluated by the Ministry of Mines and Energy (MME) for approval of participation in energy auctions of wind energy projects. This variable is considered at the municipal level, based on georeferenced information provided by the National Institute for Space Research (INPE), and is
calculated as the average annual wind speed (in meters per second) at 50 meters in height8. Figure 4
presents the spatial distribution of this variable. The comparison of Figures 3 and 4 shows that the Northeast region of Brazil, in which most of the municipalities with wind power plants are concentrated, is also the area with the highest wind speed.
Figure 4 - Average annual wind speed of the municipalities of the Northeast region of Brazil
Source: Elaborated by the authors, based on data from INPE.
Note: Average annual wind speed in meters per second at 50 meters in height.
We used the natural logarithm of the number of inhabitants of the municipality as a population variable, obtained through data provided by IBGE. The inclusion of a control for the municipality size in terms of population density, which is highly correlated with the economically active population, improves the matching of the municipalities of the treatment and control groups in terms of economic dynamics. We used the municipal GDP data at current prices to calculate the ratio between the agricultural GDP and the total GDP of the municipalities. These data are available from IBGE. The inclusion of this variable seeks to capture the opportunity cost of land use for the presence
8 According to Grubb and Meyer (1993), the density of the wind energy must be greater than or equal to 500 W/m² at the
height of 50 meters for being considered technically usable, which requires a wind speed between 7 and 8 meters per second.
of wind farms, as one of the possible alternatives for land use in agricultural activities. Thus, a negative relationship is expected between this variable and the probability of existing wind farms in the localities. Another relevant explanatory variable is the total area of the municipality – in natural logarithm – whose inclusion aims to control for the availability of space for the construction of wind farms and allows the matching of the treatment and control municipalities with similar size. Therefore, we expect the relationship between this variable and the presence of wind farms in the localities to be positive. Finally, the inclusion of a variable that indicates whether the municipality is located in a metropolitan region aims to control for populational and economic dynamics, considering that urban areas have distinct characteristics from non-metropolitan areas.
5. Descriptive analysis
The descriptive analysis presents t-tests for the differences between the means of the dependent variables of the municipalities of the treatment and control groups. The objective of these tests is to verify, in an unconditional analysis, the existence of statistically significant differences in the average of the variables for total employment, wages, and the number of firms, before performing the econometric estimation. We also perform the tests disaggregated by educational level of workers and economic sectors. Finding positive and statistically significant differences for the variables that capture the level of local development is the first evidence that the municipalities with wind farms – treatment units – could perform better in terms of these labor market outcomes.
Tables 1 to 3 show the mean variables for the treatment and control groups of municipalities – as described in section 3.2 – and the statistical significance of the tests. Comparing the results presented in these tables allows us to conclude the feasibility of using these treatment and control groups for estimates.
The comparison between the total level of employment in municipalities with wind farms under construction and operation and the municipalities with projects of wind power plants (Table 1) allows us to verify the statistically significant differences in terms of the average employment of the agricultural, electricity, and gas sectors. In contrast, when the other municipalities of the Northeast region of Brazil are added to the control group (Table 2), it is precisely the employment in these two sectors that no longer presents statistically significant differences, where all other employment variables are different between treatment and control groups. In the case of Group 3, in which the comparison is between municipalities with operating wind farms participating and non-participating in Proinfa, no differences are found for the total level of employment and employment of the sectors and subsectors analyzed (Table 3).
Regarding the level of wages, we observed that the municipalities with wind plants in operation and under construction present a higher level of wages for all sectors and subsectors analyzed, except in the electricity and gas sectors, in comparison to the municipalities with wind farms at the project phase (Group 1). This result evidences the possibility of an increase in the wages and welfare of workers in municipalities that have some wind farm operating or in construction. Statistically significant results are also found from the tests when we added the other Brazilian municipalities to the control group (Group 2). In this case, the differences also occurred for the total level of wages and the wages of sectors and sub-sectors, except in the electricity and gas sectors.
Also, when we compared the municipalities with operating wind farms participating and non-participating in Proinfa, we found significant results for the total level of wages, the wages of higher-educated workers, and the wages of the three sectors analyzed: agriculture, industry and maintenance, and services and commerce. This result serves as preliminary evidence showing that participation in this program could further reinforce the positive relationship between the presence of wind farms and local development. However, no differences are found when we disaggregated according to subsectors.
Table 1- T-test for the differences between the means of the dependent variables - Group 1 Employment Treatment (T) Control (C) Difference (T-C) t-statistic
Total 15,934 2,282 13,652 -1.14
Completed higher education 2,918 496 2,422 -1.07
Not completed higher education 13,015 1,786 11,230 -1.15
Agriculture 231 104 127 -1.69 *
Industry and Maintenance 3,329 490 2,839 -1.16
Construction 977 70 907 -1.17
Electricity and Gas 7 1 6 -1.82 *
Transport and Logistics 270 20 250 -1.20
Services and Commerce 7,139 943 6,196 -1.13
Wages
Total 14.7 14.1 0.6 -2.49 **
Completed higher education 13.5 13.0 0.5 -2.06 **
Not completed higher education 14.2 13.7 0.5 -2.38 **
Agriculture 10.7 9.6 1.2 -3.47 ***
Industry and Maintenance 12.4 11.8 0.6 -2.04 **
Construction 10.6 9.5 1.1 -2.26 **
Electricity and Gas 10.4 10.0 0.4 -0.54
Transport and Logistics 10.3 9.2 1.0 -2.00 **
Services and Commerce 13.5 13.0 0.5 -1.92 *
Number of firms
Total 1,065 184 881 -1.15
Agriculture 20 9 11 -2.69 ***
Industry and Construction 197 25 172 -1.13
Construction 77 7 70 -1.14
Electricity and Gas 1 0 1 -1.63
Transport and Logistics 0 0 0 0.00
Services and Commerce 848 150 698 -1.15
Observations 65 69
Notes: p-value < 0.10: *, p-value < 0.05: **, p-value < 0.01: ***; employment and number of firms are in levels; wages are in natural logarithm. The treatment group is composed of the municipalities in which there is a wind farm in operation or construction with a grant, whose base year is 2013, and the control group is composed of the municipalities with projects of wind farms, that is, with the status of construction not started, winner auction or DRO.
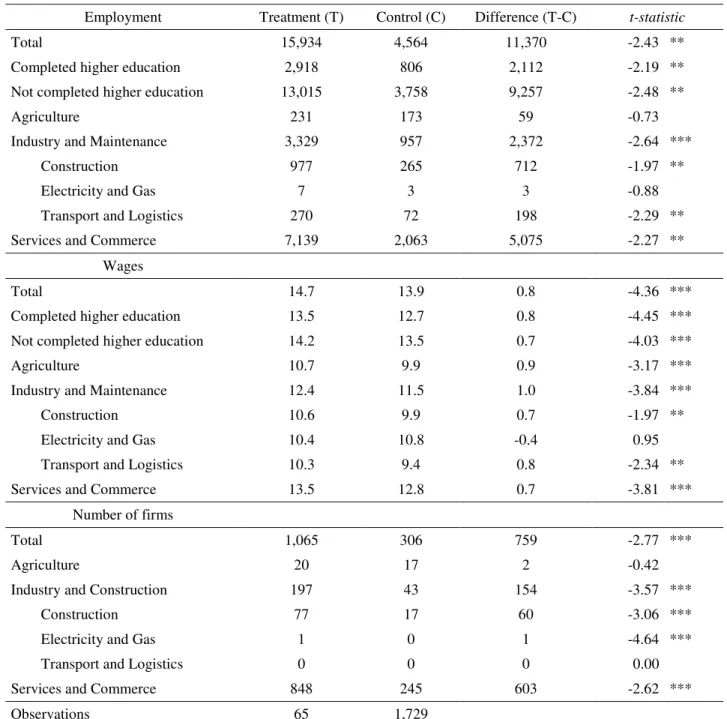
Table 2 - T-test for the differences between the means of the dependent variables - Group 2
Employment Treatment (T) Control (C) Difference (T-C) t-statistic
Total 15,934 4,564 11,370 -2.43 **
Completed higher education 2,918 806 2,112 -2.19 **
Not completed higher education 13,015 3,758 9,257 -2.48 **
Agriculture 231 173 59 -0.73
Industry and Maintenance 3,329 957 2,372 -2.64 ***
Construction 977 265 712 -1.97 **
Electricity and Gas 7 3 3 -0.88
Transport and Logistics 270 72 198 -2.29 **
Services and Commerce 7,139 2,063 5,075 -2.27 **
Wages
Total 14.7 13.9 0.8 -4.36 ***
Completed higher education 13.5 12.7 0.8 -4.45 ***
Not completed higher education 14.2 13.5 0.7 -4.03 ***
Agriculture 10.7 9.9 0.9 -3.17 ***
Industry and Maintenance 12.4 11.5 1.0 -3.84 ***
Construction 10.6 9.9 0.7 -1.97 **
Electricity and Gas 10.4 10.8 -0.4 0.95
Transport and Logistics 10.3 9.4 0.8 -2.34 **
Services and Commerce 13.5 12.8 0.7 -3.81 ***
Number of firms
Total 1,065 306 759 -2.77 ***
Agriculture 20 17 2 -0.42
Industry and Construction 197 43 154 -3.57 ***
Construction 77 17 60 -3.06 ***
Electricity and Gas 1 0 1 -4.64 ***
Transport and Logistics 0 0 0 0.00
Services and Commerce 848 245 603 -2.62 ***
Observations 65 1,729
Notes: p-value < 0.10: *, p-value < 0.05: **, p-value < 0.01: ***; employment and number of firms are in levels; wages are in natural logarithm. The treatment group is composed of the municipalities in which there is a wind farm in operation or construction with a grant, whose base year is 2013, and the control group is composed of all other municipalities of the Northeast region of Brazil.
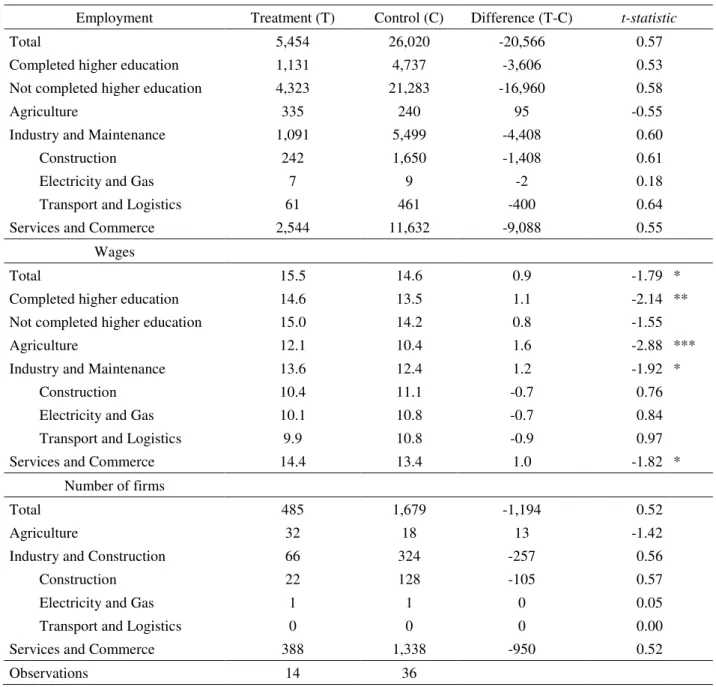
Table 3 - T-test for the differences between the means of the dependent variables - Group 3
Employment Treatment (T) Control (C) Difference (T-C) t-statistic
Total 5,454 26,020 -20,566 0.57
Completed higher education 1,131 4,737 -3,606 0.53
Not completed higher education 4,323 21,283 -16,960 0.58
Agriculture 335 240 95 -0.55
Industry and Maintenance 1,091 5,499 -4,408 0.60
Construction 242 1,650 -1,408 0.61
Electricity and Gas 7 9 -2 0.18
Transport and Logistics 61 461 -400 0.64
Services and Commerce 2,544 11,632 -9,088 0.55
Wages
Total 15.5 14.6 0.9 -1.79 *
Completed higher education 14.6 13.5 1.1 -2.14 **
Not completed higher education 15.0 14.2 0.8 -1.55
Agriculture 12.1 10.4 1.6 -2.88 ***
Industry and Maintenance 13.6 12.4 1.2 -1.92 *
Construction 10.4 11.1 -0.7 0.76
Electricity and Gas 10.1 10.8 -0.7 0.84
Transport and Logistics 9.9 10.8 -0.9 0.97
Services and Commerce 14.4 13.4 1.0 -1.82 *
Number of firms
Total 485 1,679 -1,194 0.52
Agriculture 32 18 13 -1.42
Industry and Construction 66 324 -257 0.56
Construction 22 128 -105 0.57
Electricity and Gas 1 1 0 0.05
Transport and Logistics 0 0 0 0.00
Services and Commerce 388 1,338 -950 0.52
Observations 14 36
Notes: p-value < 0.10: *, p-value < 0.05: **, p-value < 0.01: ***; employment and number of firms are in levels; wages are in natural logarithm. The treatment group is composed of the municipalities with operating wind farms that are part of the Proinfa program, and the control group is composed of the municipalities with operating wind farms that are not participating in this program.
6. Results
The results are divided into two parts. In the first part, we present the propensity score estimates, and we discuss the possibility of spatial dependence and the existence of common support (i.e., the overlap between treatment and control groups). In the second part, we present the relationship between the implementation of wind farms and the local development of the municipalities, by calculating the average treatment effect on the treated.
6.1. Spatial propensity score
The propensity score for the probability of the municipality presenting at least one wind farm is estimated using equation (2). Under the evidence of spatial dependence, identified by Moran's I
statistic, spatial elements are incorporated into the estimates according to the spatial characteristics of the data, that is, the spatial propensity score is estimated.
Five spatial weight matrices are considered in verifying the existence of spatial dependence in the observed units: 100, 200, 300, 400, and 500 kilometers. These distances are calculated by geographical coordinates of the administrative center of the municipality, available from IBGE. Thus, the proper strategy for choosing the appropriate spatial weight matrix for each model is to identify
the distances associated with the highest spatial correlation using Moran's I statistic9. Such an
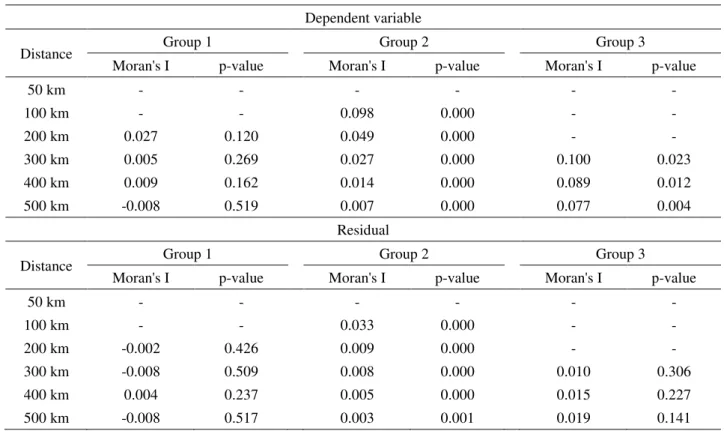
indicator measures the spatial autocorrelation based on the product of the deviations of a variable to its average (Anselin, 2001). Moran's I statistic is calculated for the dependent variable and for the residual of the estimation of equation (2), whose result is presented in Table 4. The choice of the estimation method for the propensity score is based on the existence of spatial dependence of the dependent variable and the residuals of equation (2).
Table 4 - Moran's I statistic for spatial correlation
Dependent variable
Distance Group 1 Group 2 Group 3
Moran's I p-value Moran's I p-value Moran's I p-value
50 km - - - - 100 km - - 0.098 0.000 - - 200 km 0.027 0.120 0.049 0.000 - - 300 km 0.005 0.269 0.027 0.000 0.100 0.023 400 km 0.009 0.162 0.014 0.000 0.089 0.012 500 km -0.008 0.519 0.007 0.000 0.077 0.004 Residual
Distance Group 1 Group 2 Group 3
Moran's I p-value Moran's I p-value Moran's I p-value
50 km - - - - 100 km - - 0.033 0.000 - - 200 km -0.002 0.426 0.009 0.000 - - 300 km -0.008 0.509 0.008 0.000 0.010 0.306 400 km 0.004 0.237 0.005 0.000 0.015 0.227 500 km -0.008 0.517 0.003 0.001 0.019 0.141
Note: p-value < 0.10: *, p-value < 0.05: **, p-value < 0.01: ***.
We can, therefore, observe that there is no evidence of spatial dependence of the dependent variable for Group 1. For Group 2, it is not possible to reject the null hypothesis regarding the absence of spatial dependence for all cases considered. The 100-kilometer matrix has the highest value for Moran's I. Finally, for Group 3, there is evidence of spatial dependence only in considering the spatial lag in the dependent variable, where the matrix with the highest value for Moran's I is of 300 kilometers.
Table 5 shows the results of propensity score estimates. We found no evidence of spatial dependence for the dependent variable and residuals of the estimation for Group 1. Thereafter, the non-spatial probit model is estimated. For Group 2, which presents evidence of spatial dependence
9 Stakhovych and Bijmolt (2009) point out that there are several procedures for identifying spatial dependence on data
and the most common for spatial correlation are Moran's I statistic, the Kelejian-Robinson test, and the Lagrange Multiplier (LM) test. We adopt one of these tests (Moran's I), recognizing that each test has its advantages and disadvantages.
on both the dependent variable and the residuals of equation (2), the SAR probit and SEM probit models are estimated. For Group 3, which presents spatial dependence only for the dependent variable, the SAR probit is likewise estimated. The model specification includes the entire set of variables available that could be correlated to the presence of wind farms in the localities.
Table 5 - Results of the propensity score estimations
Group 1 Probit SAR Probit SEM Probit
Coefficient SD Coefficient SD Coefficient SD
Constant -6.373*** 2.048 - - - - Wind 0.602*** 0.201 - - - - Area -0.174 0.137 - - - - Population 0.382** 0.152 - - - - GDP ratio -0.396 1.412 - - - - MR 0.043 0.540 - - - - Rho - - - - Lambda - - - - Observations 134 - -
Akaike Inf. Crit. 181 - -
Group 2 Probit SAR Probit SEM Probit
Coefficient SD Coefficient SD Coefficient SD Constant -12.287*** 1.157 -9.482*** 1.712 -1.363*** 0.22652 Wind 1.246*** 0.123 0.921*** 0.193 0.137*** 0.02121 Area 0.108 0.071 0.057 0.066 0.011 0.00843 Population 0.285*** 0.079 0.300*** 0.100 0.033*** 0.01047 GDP ratio -0.775 0.869 -0.707 0.841 -0.065 0.0901 MR -0.562* 0.302 -0.535* 0.321 -0.075** 0.03656 Rho - - 0.359* 0.209 - - Lambda - - - - 0.068 0.14522 Observations 1,792 1,792 1,792
Akaike Inf. Crit. 388 - -
Group 3 Probit SAR Probit SEM Probit
Coefficient SD Coefficient SD Coefficient SD
Constant -2.608 3.536 -2.411 3.629 - - Wind -0.209 0.348 -0.238 0.354 - - Area -0.427* 0.252 -0.439* 0.255 - - Population 0.552** 0.241 0.566** 0.236 - - GDP ratio 4.811** 2.454 5.024* 2.584 - - MR -1.147 0.903 -1.322 0.849 - - Rho - - 0.128 0.404 - - Lambda - - - - Observations 50 50 -
Akaike Inf. Crit. 60 - -
Note: p-value < 0.10: *, p-value < 0.05: **, p-value < 0.01: ***.
The results for the propensity score estimation suggest that wind and population are the main variables correlated with the presence of wind farms when using both Group 1 and Group 2. Wind
speed is positively associated with the presence of wind farms in the localities, as expected. Population size is also positively related to the presence of wind farms in the municipalities, indicating that the presence of these wind power plants is more likely to occur in denser areas. For Group 2, the binary variable for the metropolitan regions (MR) is also significant, but it negatively affects the probability of presenting wind farms. In the estimates for Group 3, in addition to the population, the area and the ratio between agricultural GDP and total GDP were deemed relevant variables explaining the probability of presenting at least one wind farm. The higher the participation of agricultural activities in the municipality's economic activities, the greater the opportunity cost of land use to set up a wind farm, and the lower the likelihood that the locality will have wind farms. On the other hand, unlike expected, the area of municipalities – an indicator of area availability to implement wind power plants – is negatively correlated with the presence of wind power plants.
The spatial parameter of the SAR probit model associated with Group 2 is statistically significant, thereby corroborating the spatial nature of the sample, as indicated already by Moran's I. Therefore, in the matching step, for Groups 1 and 3, the propensity score is estimated by the standard probit and, for Group 2, by the SAR probit.
In the matching step, for the three treatment and control groups analyzed, the existence of common support is verified. We found common support for all groups, and we excluded some observations out of support in the second estimation step of the paper. It is noteworthy that in the matching performed for Group 2, there was a higher concentration of control units found in lower propensity score values. Indeed, based on the definition of this group, the treatment group is the municipalities with wind farms in operation or construction, while the control group is broad and includes the municipalities with wind farm projects and other municipalities in the Northeast region of Brazil. It should also be noted that the matching procedure for the three groups analyzed ensures that the mean propensity score was not different for treated and non-treated municipalities10.
6.2. Average treatment effect on the treated
This paper aims to analyze the relationship between the implementation of wind power plants and the local development of municipalities. We estimated this relationship by calculating the average treatment effect on the treated (see Tables 6 to 8). Table 6 presents the results for the total level of employment and the employment of the sectors and subsectors analyzed. Tables 7 and 8 show the results for the natural logarithm of wages and the number of firms, respectively.
In Table 6, we were not able to verify any statistically significant result for the relationship between the implementation of wind farms and the level of employment in the municipalities, for any of the defined treatment and control groups. The lack of statistical significance for this relationship contradicts the results found in the literature, given that Blanco and Rodrigues (2009) found a positive relationship for employment in the industry and Simas and Pacca (2015) and Ejdemo and Söderholm (2015) identified a positive relationship for the employment of the construction sector. The difference in the results of our paper and the cited studies may be due to estimation methods, degree of robustness of each method, or the definition of the sample of localities.
Table 7 shows that wages in the construction and transportation and logistics subsectors are higher in municipalities that have wind farms in operation or construction (Group 1). This difference accounts for approximately 11% for the construction subsector and 9% for the transportation and logistics subsector. We found a negative correlation between the presence of wind power plants and the total level of wages for the electricity and gas subsectors when we added the other municipalities of the Northeast region of Brazil to the control group (Group 2). This result is counterintuitive since the demand-side effects of labor in this subsector should pressure and raise wages. However, in this paper, we obtained employment and wage data based on RAIS data for employee-employer matching; thus, we focused on the equilibrium results of the labor market. Thus, this expected increase in wages in the electricity and gas subsectors, through increased demand for labor in this subsector, could be
offset by an increase in labor supply in the subsector, which could, in turn, decrease average wages per worker and total level of wages.
Table 6 - Results for the level of employment in the municipalities of the Brazilian Northeast
Group 1 Treatment Control Difference
Mean SD
Total 15,933 2,863 13,069 12,384
Completed higher education 2,918 615 2,303 2,345
Not completed higher education 13,015 2,248 10,766 9,701
Agriculture 231 233 -2,18 134
Industry and Maintenance 3,329 627 2,701 2,620
Construction 976 82 894 915
Electricity and Gas 6,52 0,57 5,95 3,69
Transport and Logistics 270 22,15 247 230
Services and Commerce 7,138 1,122 6,016 5,133
Observations 65 69
Group 2
Total 15,934 14,519 1,414 13,965
Completed higher education 2,918 2,722 196 2,410
Not completed higher education 13,015 11,797 1,218 8,932
Agriculture 231 408 -176 132
Industry and Maintenance 3,329 2,920 409 2,593
Construction 977 954 22 735
Electricity and Gas 6,52 12,49 -5,97 5,97
Transport and Logistics 270 223 47 239
Services and Commerce 7,139 6,865 273 6,272
Observations 65 1,729
Group 3
Total 5,453 103,622 -98,169 77,870
Completed higher education 1,131 19,339 -18,209 13,424
Not completed higher education 4,323 84,283 -79,960 59,899
Agriculture 335 506 -171 276
Industry and Maintenance 1,091 21,032 -19,942 20,442
Construction 242 6,609 -6,367 5,047
Electricity and Gas 7,21 26,53 -19,31 30,05
Transport and Logistics 61,21 1,783 -1,722 1,331
Services and Commerce 2,544 47,114 -44,560 46,474
Observations 14 36
Table 7 - Results for the level of wages in the municipalities of the Brazilian Northeast
Group 1 Treatment Control Difference
Mean DP
Total 14.69 14.44 0.24 0.20
Completed higher education 13.50 13.27 0.23 0.25
Not completed higher education 14.23 14.02 0.22 0.21
Agriculture 10.74 9.97 0.77 0.52
Industry and Maintenance 12.45 12.34 0.11 0.26
Construction 10.62 9.46 1.16 ** 0.57
Electricity and Gas 10.40 9.86 0.54 0.42
Transport and Logistics 10.25 9.35 0.90 * 0.50
Services and Commerce 13.48 13.31 0.17 0.22
Observations 65 69
Group 2
Total 14.69 14.62 0.06 0.19
Completed higher education 13.50 13.34 0.15 0.21
Not completed higher education 14.23 14.22 0.01 0.29
Agriculture 10.74 10.35 0.40 0.30
Industry and Maintenance 12.45 12.43 0.02 0.32
Construction 10.62 10.52 0.10 0.50
Electricity and Gas 10.40 11.29 -0.90 * 0.52
Transport and Logistics 10.25 10.17 0.09 0.47
Services and Commerce 13.48 13.50 -0.02 0.21
Observations 65 1,729
Group 3
Total 15.51 15.15 0.36 0.81
Completed higher education 14.59 13.96 0.63 0.78
Not completed higher education 14.95 14.70 0.25 0.88
Agriculture 12.08 11.15 0.94 0.78
Industry and Maintenance 13.59 12.71 0.88 1.03
Construction 10.36 11.01 -0.65 1.61
Electricity and Gas 10.11 12.24 -2.13 * 1.17
Transport and Logistics 9.89 12.68 -2.79 ** 1.40
Services and Commerce 14.36 14.12 0.23 0.87
Observations 14 36
Table 8 - Results for the number of firms in the municipalities of the Brazilian Northeast
Group 1 Treatment Control Difference
Mean DP
Total 1,065 222 843 631
Agriculture 19 10 9 ** 4
Industry and Construction 197 31 166 166
Construction 77 8 68 62
Electricity and Gas 1 0 1 1
Transport and Logistics 0 0 0 0
Services and Commerce 848 181 667 649
Observations 65 69
Group 2
Total 1,065 971 94 1,061
Agriculture 19 30 -11 9
Industry and Construction 197 147 50 147
Construction 77 70 7 62
Electricity and Gas 1 1 1 0
Transport and Logistics 0 0 0 0
Services and Commerce 848 793 54 766
Observations 65 1,729
Group 3
Total 485 6,607 -6,122 4,771
Agriculture 31 31 1 19
Industry and Construction 66 1,312 -1,246 1,151
Construction 22 529 -507 435
Electricity and Gas 1 4 -3 4
Transport and Logistics 0 0 0 0
Services and Commerce 388 5,264 -4,876 3,970
Observations 14 36
Note: p-value < 0.10: *, p-value < 0.05: **, p-value < 0.01: ***; total of firms in absolute numbers.
In the estimates for Group 3 – treatment group is the municipalities with operating wind farms participating in the Proinfa program, and the control group is formed by the other municipalities with operating wind power plants – we also found a negative relationship for wages of the subsectors of electricity and gas and transportation and logistics. However, in this case, the results are not out of line, as it would be possible for municipalities with operating wind farms, but not participants in Proinfa, to have better outcomes for the labor market after the implementation of the wind farms. We also verified that the level of wages is about 21% higher for electricity and gas and 28% for transportation and logistics in municipalities not participating in Proinfa.
In Table 8, we observed that the municipalities having wind farms in operation or construction present 48% more firms in the agricultural sector, and this is the only statistically significant result that we found regarding the number of firms. This positive result for the number of firms in the agricultural sector may be related to the possibility of land leasing in the implementation of a wind
farm project in a locality. This mechanism allows the continuity of agricultural activities in the land and can strengthen the local development.
Therefore, the results of this paper suggest that the presence of wind farms in operation or construction may be related to a higher level of wages in the construction and transportation and logistics subsector. Moreover, the results suggest that the presence of wind power plants may shift resources to the agricultural sector, boosting this activity in the local economy. This latter result is in line with the study of Bergmann, Hanley, and Wright (2006) for Scotland, which shows that the most significant socioeconomic benefits of implementing renewable energy sources, especially wind energy, occur in rural areas.
Finally, regarding the Proinfa program, the results indicate that the effects of the program on employment, wages, and the number of firms can be limited since the presence of wind farms out of the program is related to a higher level of wages in the electricity, gas, transportation, and logistics subsectors.
7. Concluding remarks
This study aims to analyze the relationship between the implementation of wind farms and local development in the municipalities of the Northeast region of Brazil in 2013. We focused on labor market outcomes, such as employment, wages, and the number of firms. The main contribution of this article is to relate the presence of wind farms to the labor market outcomes through the use of the spatial propensity score matching method and the calculation of the average treatment effect on the treated.
We found that the total level of wages in the construction, transportation, and logistics sectors are higher in municipalities that have wind power plants in operation or construction. This difference accounts for about 11% in the construction subsector and 9% in the transportation and logistics subsectors. Also, municipalities that have wind farms in operation or construction contain 48% more firms in the agricultural sector, thereby suggesting that the presence of wind power plants leads to the shifting of resources to the agricultural sector, boosting this activity in the local economy.
In addition, wages are higher in the electricity and gas and transportation and logistics subsectors in municipalities with operating wind farms but not participating in the Proinfa program. This result serves as evidence that the impacts of this government program may have been limited in the case of wind farm implementation. Finally, no statistically significant results were found regarding the relationship between the presence of wind farms and the total level of employment.
The results of this paper suggest that the presence of wind farms may generate positive impacts on the local development of Brazilian municipalities. Thus, given the natural conditions of the country, especially in its Northeast region, it could be expected that the expansion in the number of projects of this type of renewable energy will contribute to the increase of the local welfare. We can also expect that once auctions for renewable energy projects continue to take place, as a process of transition to an increasingly cleaner energy matrix, these positive impacts can be even higher, thereby positively affecting jobs, income, and the number of firms in the region.
It is noteworthy that, despite the relevance of the correlations found in this paper, it is not the purpose of the study to identify and estimate the isolated effect of wind energy. For this purpose, it would be necessary to use longitudinal data and econometric panel methods or other methods, allowing achieving robustness of the effects
References
ALMEIDA E. Econometria espacial. Campinas: Alínea. 2012.
ALVES, J. J. A. Análise regional da energia eólica no Brasil. Revista Brasileira de Gestão e Desenvolvimento Regional, v. 6, n. 1, p. 165-188, 2010.
ANSELIN, L. Spatial econometrics. In: BALTAGI, B. H. (ed.). A Companion to Theoretical Econometrics. Oxford: Blackwell Publishing, 2001. Cap. 14, p. 310-330.
ANEEL. Micro e minigeração distribuída. Sistema de Compensação de Energia Elétrica. Brasília, DF, Brasil: Centro de Documentação (Cedoc). 2014.
BERGMANN, A.; HANLEY, N.; WRIGHT, R. Valuing the attributes of renewable energy investments. Energy Policy, v. 34, n. 9, p. 1004-1014, 2006.
BIRD, L.; BOLINGER, M.; GAGLIANO, T.; WISER, R.; BROWN, M.; PARSONS, B. Policies and market factors driving wind power development in the United States. Energy Policy, v. 33, n. 11, p. 1397-1407, 2005.
BLANCO, M. I.; RODRIGUES, G. Direct employment in the wind energy sector: An EU study. Energy Policy, v. 37, n. 8, p. 2847-2857, 2009.
CHAGAS, A. L. S.; TONETO-JR, R.; AZZONI, C. R. A spatial propensity score matching evaluation of the social impacts of sugarcane growing on municipalities in Brazil. International Regional Science Review, v. 35, n. 1, p. 48-69, 2012.
COSTA, R. A.; CASOTTI, B. P.; AZEVEDO, R. L. S. Um panorama da indústria de bens de capital relacionados à energia eólica. BNDES Setorial, Rio de Janeiro, n. 29, p. 1-50, 2009.
DEL RÍO, P.; BURGUILLO, M. Assessing the impact of renewable energy deployment on local sustainability: Towards a theoretical framework. Renewable and Sustainable Energy Reviews, v. 12, n. 5, p. 1325-1344, 2008.
EDENHOFER, O.; PICHS-MADRUGA, R.; SOKONA, Y.; SEYBOTH, K. IPCC special report on renewable energy sources and climate change mitigation. Prepared By Working Group III of the Intergovernmental Panel on Climate Change, Cambridge University Press, Cambridge, UK, 2011.
EJDEMO, T.; SÖDERHOLM, P. Wind power, regional development and benefit-sharing: the case of Northern Sweden. Renewable and Sustainable Energy Reviews, v. 47, p. 476-485, 2015. EPE. Empresa de Pesquisa Energética. Nota Técnica: O Compromisso do Brasil no Combate às
Mudanças Climáticas: Produção e Uso de Energia. Disponível em http://www.epe.gov.br. Rio de Janeiro/RJ. 2016.
GWEC. Global Wind Energy Council. Global wind statistics 2011 Report. Brussels, Belgium: Global Wind Energy Council (GWEC), 2011.
GWEC. Global Wind Energy Council. Global Wind Report 2015: Annual Market Update. Brussels, Belgium: Global Wind Energy Council (GWEC), 2015.
GRUBB, M. J; MEYER, N. I. Wind energy: resources, systems and regional strategies. In: JO-HANSSON, T. B. (ed.). Renewable Energy: Sources for Fuels and Electricity. Washington, D.C.: Island Press, 1993.
KHANDKER, S. R.; KOOLWAL, G. B.; SAMAD, H. A. Handbook on Impact Evaluation: Quantitative Methods and Practices. Washington: World Bank Publications, 2010.
KLICK, H.; SMITH, E. Public understanding of and support for wind power in the United States. Renewable Energy, v. 35, n. 7, p. 1585-1591, 2010.
LEHR, U.; NITSCH, J.; KRATZAT, M.; LUTZ, C.; EDLER, D. Renewable energy and employment in Germany. Energy Policy, v. 36, n. 1, p. 108-117, 2008.
LESAGE, James; PACE, Robert Kelley. Introduction to spatial econometrics. Chapman and Hall/CRC, 2009.
MARTINS, F. R.; GUARNIERI, R. A.; PEREIRA, E. B. O aproveitamento da energia eólica. Revista Brasileira de Ensino de Física, v. 30, n. 1, p. 1-13 2008.
MORENO, B.; LOPEZ, A. J. The effect of renewable energy on employment. The case of Asturias (Spain). Renewable and Sustainable Energy Reviews, v. 12, n. 3, p. 732-751, 2008.
OHL, C.; EICHHORN, M. The mismatch between regional spatial planning for wind power development in Germany and national eligibility criteria for feed-in tariffs - A case study in West Saxony. Land Use Policy, v. 27, n. 2, p. 243-254, 2010.
SIMAS, M.; PACCA, S. Assessing employment in renewable energy technologies: A case study for wind power in Brazil. Renewable and Sustainable Energy Reviews, v. 31, p. 83-90, 2014. STAKHOVYCH, S.; BIJMOLT, T. H. A. Specification of spatial models: A simulation study on
weights matrices. Papers in Regional Science, v. 88, n. 2, p. 389-408, 2009.
SZARKA, J. Wind power, policy learning and paradigm change. Energy Policy, v. 34, n. 17, p. 3041-3048, 2006.
UHR, D. A. P., CHAGAS, A. S., UHR, J. G. Z. Demand for residential energy in Brazil revisited: a dynamic panel data approach. The Empirical Economics Letters, v. 16, n. 8, p. 747-753, 2017. UHR, D. A. P., CHAGAS, A. S., UHR, J. G. Z. Estimation of elasticities for electricity demand in
Brazilian households and policy implications. Energy Policy, v. 129, p. 69-79, 2019.
WEI, M.; PATADIA, S.; KAMMEN, D. M. Putting renewables and energy efficiency to work: How many jobs can the clean energy industry generate in the US? Energy Policy, v. 38, n. 2, p. 919-931, 2010.
ORCID
Thiago Pastorelli Rodrigues https://orcid.org/0000-0001-5762-8497 Solange Ledi Gonçalves https://orcid.org/0000-0002-4607-9151 André Squarize Chagas https://orcid.org/0000-0001-7870-8736
The views and opinions expressed in this study are those of the authors and do not necessarily reflect the position of EPE.
Appendix
Table A1 - T-tests for the explanatory variables (prior and after the matching)
Group 1 Prior the matching After the matching
Variables T C t-statistic T C t-statistic
Wind 6.35 6.05 -2.82 *** 6.22 6.19 -0.26
Area (log) 6.36 6.52 0.92 6.33 6.60 0.86
Population (log) 10.05 9.76 -1.67 * 9.88 9.99 0.42
Ratio Agriculture and total GDP 0.10 0.10 0.33 0.12 0.09 -1.34
MR 0.09 0.04 -1.13 0.04 0.04 0.03
Observations 65 69 65 69
Group 2 Prior the matching After the matching
Variables T C t-statistic T C t-statistic
Wind 6.35 5.17 -12.41 *** 6.59 6.57 -0.15
Area (log) 6.36 6.11 -1.75 * 6.50 6.44 -0.16
Population (log) 10.05 9.60 -3.67 *** 10.24 10.34 0.25 Ratio Agriculture and total GDP 0.10 0.14 2.76 *** 0.08 0.10 0.89
MR 0.09 0.08 -0.33 0.06 0.14 0.76
Observations 65 1,728 65 1,728
Group 3 Prior the matching After the matching
Variables T C t-statistic T C t-statistic
Wind 6.34 6.47 0.70 5.82 6.04 0.57
Area (log) 6.14 6.36 0.69 6.04 5.89 -0.11
Population (log) 10.51 10.05 -1.25 10.48 12.43 0.83 Ratio Agriculture and total GDP 0.13 0.08 -1.83 * 0.23 0.17 -0.32
MR 0.07 0.14 0.65 - - -
Observations 14 36 14 36
Note: p-value < 0.10: *, p-value < 0.05: **, p-value < 0.01: ***. T-tests after the matching are performed for one of the blocks generated in the PSM. As this matching procedure ensures that the mean propensity score is not different for the treatment and control groups, the selection criterion for blocks was the maximum number of observations in each group.