AGFORWARD (Grant Agreement N° 613520) is co-funded by the European Commission, Directorate General for Research & Innovation, within the 7th Framework Programme of RTD. The views and opinions expressed in this
Initial modelled outputs at field scale
Project name AGFORWARD (613520)
Work-package 6: Field- and Farm-scale Evaluation of Innovations
Deliverable Deliverable 6.16 (6.1): Initial modelled outputs at field scale to support best management practices for resource efficiency of agroforestry systems Date of report 23 August 2016
Authors Marie Gosme, Céline Blitz-Frayret, Paul Burgess, Josep Crous-Duran, Christian Dupraz, Dunja Dux, Silvestre García de Jalón, Anil R. Graves, Felix Herzog, Isabelle Lecomte, Gerardo Moreno, Tania Oliveira, Joao Palma, Joana Amaral Paulo, Firesenai Sereke, Margarida Tomé
Contact [email protected] Approved Paul Burgess (24 August 2016) Content
1 Context ... 2
2 Description of the papers ... 2
3 Abstracts of the published/submitted papers to journals ... 5
4 Modelling holm oak acorn production in south-western Iberia ... 7
5 Agroforestry at all latitudes? Unexpected results about best designs to allow more light to the crop at various latitudes ... 12
6 Using the Yield-SAFE model to assess hypothetical eucalyptus silvopastoral systems in Portugal ... 17
7 Assessing the environmental externalities of arable, forestry, and silvoarable systems: new developments in Farm-SAFE ... 23
1 Context
The AGFORWARD research project (January 2014-December 2017), funded by the European Commission, is promoting agroforestry practices in Europe that will advance sustainable rural development. The project has four objectives:
1. to understand the context and extent of agroforestry in Europe,
2. to identify, develop and field-test innovations (through participatory research) to improve the benefits and viability of agroforestry systems in Europe,
3. to evaluate innovative agroforestry designs and practices at a field-, farm- and landscape scale, and
4. to promote the wider adoption of appropriate agroforestry systems in Europe through policy development and dissemination.
This report comprises Deliverable 6.16 in the project, which contributes to the third objective as it presents field-scale evaluation of innovations, in order to adapt and evaluate agroforestry designs and practices for locations where agroforestry is currently not-widely practised or declining. The modelling of outputs at field scale to support best agroforestry practices is an ongoing activity during the AGFORWARD project. This report highlights some of the outputs which has been produced in the form of three papers (either submitted or about to be submitted to a peer-reviewed journal) or in four presentations at the Third European Agroforestry Conference in May 2016.
2 Description of the papers
Agroforestry is the practice of deliberately integrating woody vegetation (trees or shrubs) with crop and/or animal production systems to benefit from the resulting ecological and economic interactions (Burgess et al. 2015). The diversity of land uses under the term agroforestry is vast (it includes silvoarable systems, forest farming, riparian buffer strips, improved fallow, multipurpose trees and silvopasture systems (Mosquera-Losada et al. 2009; den Herder et al. 2016)). Even within one land use, the range of possible system structures (i.e. density and spatial pattern of trees, type of associated crops and/or animals) and management practices (i.e. tree management such as thinning and pruning, soil management such as tillage, crop management such as choice of cultivar or fertilisation) makes it impossible to field-test all combinations of practices in order to identify the most favourable combinations in one location, let alone in the diversity of soil and climate conditions encountered over Europe. To solve this problem, and to test innovations in conditions where agroforestry is not yet practiced, the AGFORWARD consortium is using simulation models that allow the identification of the best management practices for resource efficiency of agroforestry systems. Stakeholders meetings held during the first year of the project allowed identifying innovations and challenges proposed by farmers and/or extension workers (Moreno et al. 2015, Pantera et al. 2015, Mirck et al. 2014, and Hermansen et al. 2015 from work-packages 2, 3, 4 and 5 respectively). These were then classified as suitable for model testing (Palma et al. 2015) or as better evaluated in the field. The Yield-SAFE (Palma et al. 2016a) and Hi-sAFe (Lecomte et al. 2016) models were then improved to meet the requirements for testing (some) of the innovations/challenges. In brief the Yield-SAFE is a parameter-sparse biophysical model of tree-crop interactions that operates on a daily time-step. The Hi-sAFe model is a more complicated model that can address 3-dimensional tree-crop interactions. A third model, called Farm-SAFE, can use yield data from biophysical models (like
Yield-SAFE and Hi-sAFe), combined with financial and economic data, to undertake cost-benefit analyses. The results presented in this deliverable were obtained with these improved models, and contribute to answer initial questions raised by the stakeholders.
The first challenge that farmers face when implementing an agroforestry system is the design of the system, i.e. the choice of tree species, tree density and tree spatial pattern. The question of the optimal spatial design was raised in several stakeholders groups in several systems: High natural and cultural value agroforestry (e.g. in the " Wood pastures and reindeer in Sweden" stakeholder group (Moreno et al. 2015), silvoarable systems (it was identified as a question in 7 out of the 11 stakeholder groups by Mirck et al. 2014) and silvopastoral systems (e.g. testing the spatial organization of trees and shrubs in a plot grazed by dairy cows, (Hermansen et al. 2015). Only in the high value tree systems was this question not raised, probably because in these systems, agroforestry implementation starts from existing tree plantations.
This question was first addressed for arable systems, using Hi-sAFe model: we identified the best tree row orientation depending on latitude and crop type (winter/summer crops) in order to optimize arable crops growth and spatial homogeneity of crop maturation. The results, presented in a paper to be submitted shortly in Agroforestry Systems (Dupraz et al., to be submitted) (Section 3.1) and summarized in an oral presentation at the Third European Agroforestry Conference (Dupraz et al. 2016) (Section 5), indicate that for winter and summer crops, north-south tree lines should be preferred at high latitudes (>50°) and east-west tree lines should be preferred at low latitudes (<40°) to maximize the crop irradiance during the grain filling phases. At high latitudes, given the low late summer irradiance of crops with east-west tree lines, summer crops should never be associated with east-west tree lines. For temperate latitudes (40° to 50°), the tree line orientation has no significant impact on crop irradiation at most key phenological stages such as flowering or grain filling.
A major concern raised in all stakeholder groups is the profitability of agroforestry systems, compared to the current alternative (i.e. sole crop, or animals without trees, or single species orchard, depending on the starting system). The Hi-sAFe and Yield-SAFE models are able to predict the productivity as well as the provision of other services of agroforestry systems, compared to the sole crop and/or the forest. In the AGFORWARD project, the Farm-SAFE model has been used to assess the financial and economic profitability of agroforestry systems. Yield-SAFE was used to estimate the land equivalent ratios of agroforestry systems with different productions (timber-arable vs fruit-(timber-arable vs timber-grassland vs and fruit-grassland), with different tree species (cherry vs walnut) and with either 40 or 70 trees ha−1 (Sereke et al. 2015) (Section 3.3). Mixing trees and crops was commonly (in 12 out of the 14 options) predicted to be more productive than growing them in separate forestry and arable systems i.e. a land equivalent ratio higher than 1 (predicted land equivalent ratios ranged from 0.95 to 1.30).
A useful feature of modelling studies is that they allow quick assessment of the potential for new systems in regions where they are not currently being implemented. For example, agroforestry with eucalyptus is not practised in Portugal, but the stakeholders from a cork-producing region in Portugal asked researchers to evaluate its potential in their region (Palma et al. 2016b) (Section 6). Using Yield-SAFE, land equivalent ratios of simulated eucalyptus-ryegrass agroforestry systems were
found to range between 1 (irrigated system with 52 trees per hectare) and 1.2 (for rainfed-systems with 203 trees per hectare). The results also suggested that similar stand biomasses can be achieved with less trees (=> lower establishment cost) in agroforestry than in forest monoculture.
The Yield-SAFE model also gave good results in predicting the acorn production of dehesa/montado systems (Crous-Duran et al. 2016) (Section 4), which will be useful to test the capacity of agroforestry systems to address the strong seasonality of forage resources for pigs, and to assess the economic potential of promoting new acorn-derived products for animal and human consumption. These were both subjects raised by the "high natural and cultural value agroforestry" stakeholder groups in Spain and Portugal. Concerning the provision of other ecosystem services, Yield-SAFE was used to compare carbon storage achieved through different scenarios of land use (agroforestry vs forestry) allocation to different types of soils (low vs high water holding capacity (Palma et al. 2014). The modelled results indicate that on land with a high water holding capacity, it is possible to maintain food production (through the crop/animal component of agroforestry) and achieve higher rates of carbon sequestration in the agroforestry trees than in the trees of a forest on poorer land. Furthermore, the simulations show that an implementation of 10% of agroforestry in areas with high soil water holding capacity results in approximately the same carbon storage as 50% implementation in poorer agricultural land. This type of analysis, comparing different scenarios of adoption in different soil and climate conditions is particularly interesting for land use planners who allocate different land uses to different soils, and policy makers who determine the type of financial incentives given to support carbon sequestration.
Carbon emissions from field operations (fuel and machinery and agrochemicals manufacture) have been evaluated in Farm-SAFE (Garcia de Jalon et al. 2016) using a life cycle assessment model to compare the emissions of the different land uses (arable, forestry and agroforestry) (Section 7). Farm-SAFE has also started to be used to convert the provision of some environmental externalities into monetary terms, hence allowing a financial and economic assessment of costs and benefits of alternative land uses.
3 Abstracts of the published/submitted papers to journals
3.1 Influence of latitude on the light availability for intercrops in an agr oforestry alley-cropping system
Provisional abstract of Dupraz C, Blitz-Frayret C, Lecomte I, Molto Q, Gosme M (2016). Influence of latitude on the light availability for intercrops in an agroforestry alley-cropping system. A paper to be submitted to a peer-reviewed journal during 2016. The results in this paper were derived from the Hi-sAFe model.
Light competition by trees is often regarded as a very limiting factor for crops in alley-cropping agroforestry. Northern latitude farmers are usually reluctant to adopt agroforestry as they fear that light competition will be fiercer in their conditions. We questioned light availability for crops in alley-cropping at different latitudes from the tropic circle to the polar circle with a process-based 3D model of alley-cropping agroforestry. Two tree densities and two tree line orientations were considered. The effect of latitude was evaluated with same-sized trees. The relative irradiance of the crops was computed for the whole year or at specific times of the year when crops need more light. The heterogeneity of crop irradiance across the alley was also computed. Surprisingly, crop irradiance of summer crops at high latitudes is high, at odds with farmers’ fears. Best designs for improving the crop irradiance were evidenced: North-south tree lines are recommended at high latitudes and east-west tree lines at low latitudes. At medium latitudes, north-south tree lines should be preferred to achieve homogeneous irradiance of the crop in the alley. If we assume that trees grow more slowly at northern latitudes, then alley-cropping agroforestry is highly advisable even at very high latitudes with summer crops.
3.2 Carbon sequestration of modern Quercus suber L. silvoarable agroforestry systems in Portugal: a YieldSAFE -based estimation
Abstract of: Palma JHN, Paulo JA, Tomé M (2014). Carbon sequestration of modern Quercus suber L. silvoarable agroforestry systems in Portugal: a YieldSAFE-based estimation. Agroforestry Systems 88: 791–801. doi:10.1007/s10457-014-9725-2. The paper acknowledges the support of the AGFORWARD project.
Modern alley cropping designs, with trees aligned in rows and adapted to operating farming machinery, have been suggested for Europe. This paper explores the potential for adoption of cork oak (Quercus suber L.) agroforestry in Portugal and estimates the potential carbon sequestration. Spatial modeling and Portuguese datasets were used to estimate target areas where cork oak could grow on farmland. Different implementation scenarios were then modeled for this area assuming a modern silvoarable agroforestry system (113 trees ha−1 thinned at year 20 for establishing 50 trees ha−1). The YieldSAFE process-based model was used to predict the biomass and carbon yield of cork oak under low and high soil water holding capacity levels. Approximately 353,000 ha are available in Portugal for new cork oak alley cropping. Assuming implementation rates between 10% of the area with low soil water capacity (60 mm: 15 cm depth, coarse texture) and 70% of the area with high soil water holding capacity (1228 mm: 200 cm depth, very fine texture), then carbon sequestration could
be 5 × 10⁶ and 123 × 106 Mg CO2 respectively. Due to higher yields on more productive land, scenarios of limited implementation in high productivity locations can sequester similar amounts of carbon as wide implementation on low productivity land, suggesting that a priori land classification assessments can improve the targeting of land and financial incentives for carbon sequestration. 3.3 Innovative agroecosystem goods and services: key profitability drivers in Swiss
agroforestry
Abstract from Sereke F, Graves AR, Dux D, Palma JHN, Herzog F (2015). Innovative agroecosystem goods and services: key profitability drivers in Swiss agroforestry. Agronomy for Sustainable Development 35: 759–770. doi: 10.1007/s13593-014-0261-2. Although this paper was not completed with funding from the AGFORWARD project, the authors are engaged in AGFORWARD and the research has strong synergies with our modelling work.
Trees that characterized many agricultural landscapes across Europe are declining, despite the recent revival of agroforestry research and increasing direct payments for their maintenance. Therefore, in addition to field experiments, there is a need for transdisciplinary research in close alliance with local farmers. This paper proposes a three-step participatory design and assessment approach, incorporating local innovation and scientific evidence. To our knowledge, this is the first participatory and bio-economic analysis of farmer-designed agroforestry systems in Europe. First, an exploratory survey of farmers’ innovations in Switzerland was conducted together with a literature review. Based on the survey, 14 representative agroforestry practices were defined for the bio-economic assessment, focusing on walnut (Juglans hybr.) and wild cherry (Prunus avium). The predictions of long-term yields were made with the Yield-SAFE model, and the profitability was assessed using the Farm-SAFE model. The survey results suggested a lack of local knowledge on key ecosystem services provided by agroforestry. It is therefore recommended to apply the concept of ecosystem services, in order to support the design of multifunctional agriculture and to increase the willingness to pay for its services. According to our yield predictions, mixing trees and crops was commonly more productive (12 out of the 14 options, land equivalent ratio = 0.95–1.30) than growing them in separate forestry or arable systems. This result contradicts the widespread view among modern Swiss farmers that agroforestry is unproductive. In terms of profitability, 68 % of the 56 financial scenarios for the agroforestry practices, particularly those linked to innovative marketing of fruit or receiving payments for ecosystem services, were found to be more profitable than the business as usual reference systems. These results demonstrate that there is a need and a value in bridging the gap between scientists and farmers, in order to coproduce applied knowledge for the design of productive agroforestry practices.
4 Modelling holm oak acorn production in south-western Iberia
Copy of paper: Crous Duran J, Moreno G, Oliveira TS, Paulo JA, Palma JHN. (2016). Modelling holmoak acorn production in South-Western Iberia. In: 3rd European Agroforestry Conference Book of Abstracts, pp. 344-346 (Eds. Gosme M et al.). Montpellier, France, 23-25 May 2016.
4.1 Introduction
Since old times the production of acorn by the oak trees has been of high interest for human and animal consumption (Fernández-Rebollo and Carbonero-Muñoz 2008). An important source of these acorns are Dehesas and Montados which are typical agroforestry systems of the Mediterranean region characterized by the presence of wooded pastures under holm oak (Quercus ilex L. or Quercus
rotundifolia L.) and cork oak (Quercus suber L.). These systems are focused on livestock extensive
production, where the acorns play an important role in the energy demand of livestock, a wide range of wild animals, but also for future interest in human consumption (Pintado 2015).
However, acorn production is highly variable between years, geographic locations and even between nearby trees. This variability is a source of uncertainty and a challenge for modelling the production of acorns. Nevertheless, this work focused on a preliminary method to project acorn productivity at a daily time step to complement the energy availability of the system to estimate livestock carrying capacity.
Considering a process-based modelling approach, the main objectives of this study are: 1) to develop a methodology to estimate acorn productivity in Quercus ilex L based on crown cover size of trees; 2) to integrate the method into Yield-SAFE, an agroforestry process-based growth model (van der Werf et al. 2007) and 3) compare acorn productions between stands and locations while estimating animal carrying capacity of the system by considering the metabolisable energy from acorns and grass.
4.2 Material and methods
The Yield-SAFE model (YS), a biophysical model that describes tree and crop growth in arable, forestry, and agroforestry systems according to light and water availability, was calibrated for
Quercus ilex and grasslands in dehesas systems.
The fruit module was implemented into YS following the suggestion of Gea-Izquierdo et al (2006) by linking the acorn productivity to the crown cover size. The fruit productivity parameter (Fp, in g m-2 of canopy cover) was included in YS and linked to the CanopyCover state variable that is defined as the area of the ground covered by the vertical projection of the canopy of the tree (in m2). A reference value of 100 g m-2 was considered as average acorn production for Quercus ilex in Spain (Gea-Izquierdo et al. 2006).
Fruit fall seasonality was also taken into account by considering the number of days when the fruit is falling (FFSpan in days) and the fruit falling peak day (FFPeak in day of year). For Quercus ilex acorn is expected to fall for 100 days, from 15th September to 23th of December with fruit peak the 3rd of November (Cañellas et al. 2007). Given this fruit seasonality, daily probabilities of acorns to fall
(FFPDOY) were calculated using a normal distribution function where FFPeak is the average and the standard deviation defined as FFSpan/4, meaning that 95% of the probability of acorn fall is included in the FFSpan number of days.
𝐹𝐹𝑃𝐷𝑂𝑌𝑛𝑜𝑟𝑚 =𝐹𝐹 1 𝑆𝑝𝑎𝑛 4 √2𝜋 𝑒 −(𝐷𝑂𝑌𝑛𝑜𝑟𝑚−𝐹𝐹𝑃𝑒𝑎𝑘)2 2(𝐹𝐹𝑆𝑝𝑎𝑛4 )2
Once the daily fruit availability is estimated, the daily fruit production (DFPDOY in kg ha-1day-1) was calculated as:
𝐷𝐹𝑃𝐷𝑂𝑌𝑁𝑂𝑅𝑀 = 𝐶𝑎𝑛𝑜𝑝𝑦𝐶𝑜𝑣𝑒𝑟𝐷𝑂𝑌∗ (𝐹𝑝/1000) ∗ (
t ∗ 10000) ∗ 𝐹𝐹𝑃𝐷𝑂𝑌𝑁𝑂𝑅𝑀Where
t is the tree density of the stand (trees m-2).The Annual fruit production (kg ha-1year-1) was calculated as the sum of the Daily fruit production for the period of time where there is a fruit fall (when FFPDOYnorm is > 0.00001) as:
𝐼𝑓 𝐹𝐹𝑃𝐷𝑂𝑌𝑁𝑂𝑅𝑀 < 0.00001, 𝑡ℎ𝑒𝑛, 𝐴𝐹𝑃 = 0
𝐼𝑓 𝐹𝐹𝑃𝐷𝑂𝑌𝑁𝑂𝑅𝑀 > 0.00001, 𝑡ℎ𝑒𝑛, 𝐴𝐹𝑃 = 𝐷𝐹𝑃𝐷𝑂𝑌𝑁𝑂𝑅𝑀+ 𝐷𝐹𝑃𝐷𝑂𝑌𝑁𝑂𝑅𝑀−1
The potential daily carrying capacity of the system was calculated as the sum of the metabolisable energy content from fruit (Fec in MJ Mg-1) and grass (Cec in MJ Mg-1), and compared to the reference livestock unit energy requirement (LUER) of 103 MJ day-1 (Hodgson 1990). The metabolizable energy content for acorn and grass considered were 7230 MJ Mg-1 (Lopez-Bote et al. 2000) and 9750 MJ Mg -1
(Köster et al. 2004) respectively.
Finally the sequential days of carrying capacity expresses the number of following days the system is able to supply the energy requirements for a selected livestock species. In dehesas with Iberian pigs, the sequential number of days is of high relevance as animals need to free graze for at least 40 days in order to receive the Protected Designation of Origin (PDO) certificate.
The methodology was then validated in two different sites in south-west Iberia: Badajoz and Cáceres. In Badajoz acorn productivity was studied during the years 1997-1999 having an average of 680 kg ha-1 year-1 (15.1 kg tree-1 year-1). The area has a tree density up to 45 trees ha-1 with a loam soil texture (Cañellas et al. 2007). The experimental site in Cáceres has an average density of 25 trees ha-1 with average acorn productions of 365 kg ha-1year-1 (14.6 kg tree-1 year-1) and deep sandy-loam soils. In both cases weather information was obtained with the CliPick tool (Palma 2015).
4.3 Results
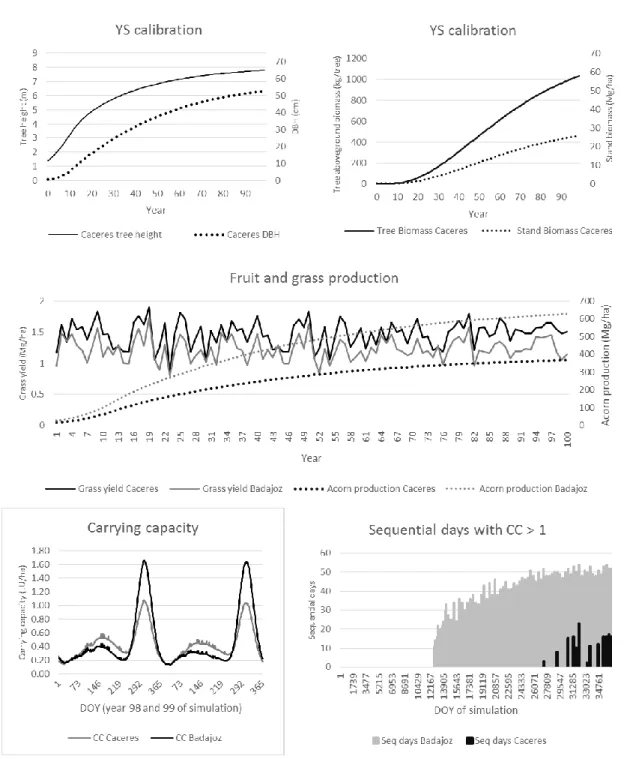
With the YieldSAFE simulation of 25 trees ha-1 holm oak stands over a period of 100 years in the area of Cáceres site, first results showed reasonable estimations for height, dbh, tree biomass and stand compared to those observed: height of 8.1 +- 1.3m; DBH of 44.9 +-6.4 cm; tree biomass of 1056 kg tree-1 and stand biomass of 26.4 Mg ha-1 (Moreno, personal communication, 2016; Figure 4.1, top). Results were also consistent with previous studies for grass production estimations. YS estimated productions of around 1.44 Mg ha-1 for Badajoz site and 1.22 Mg ha-1 for Cáceres site. Similar values
to the average grass production for non-fertilized grasslands of the region of 1.4 Mg ha-1 (Moreno et al. 2007; Figure 4.1 centre).
Figure 4.1. YieldSAFE predictions of height, diameter at breast height and biomass for Quercus ilex (top). Simulated acorn and grass production for Cáceres and Badajoz sites (centre). Carrying capacity of the systems for years 99 and 100 considering fruit and grass availability for Cáceres and Badajoz sites and number of sequential days the system can feed Iberian pigs (bottom).
The values obtained for acorn production fit well with the results observed for the two experimental sites. In year 100, representing a mature system, an annual production of 620 kg ha-1 year-1 and 367 kg ha-1 year-1 is estimated for Badajoz and Cáceres respectively. These estimations are close to the
observed values between 590 and 830 kg ha-1 in Badajoz and to the average 365 kg ha-1 observed in Cáceres (Figure 1 centre). Also the results are similar to the results obtained in previous studies in dehesa systems: Gea-Izquierdo (2006) reported productions of around 250-600 kg ha-1 in a system with 50 tree ha-1, and other authors reported average values around 550 kg ha-1 (Cañellas et al. 2007; Fernández-Rebollo and Carbonero-Muñoz, 2007).
Considering the 48 MJ day-1 energy requirements of an Iberian pig (Lopez-Bote et al. 2000) both sites present similar annual carrying capacity values (0.39 LU ha-1 and 0.41 LU ha-1 for Cáceres and Badajoz respectively) and seem to be consistent with the carrying capacity reported for the region of 0.3 LU ha-1 (Moreno, personal communication, 2015). The sequential days of carrying capacity expresses the number of following days the system is able to supply the energy requirements for one Iberian pig (i.e. 0.47 livestock units) - what in Spanish/Portuguese is called montanera/montanheira). For Badajoz site, as fruit production is higher, the system is able to support more than 40 sequential days in year 60, while in Cáceres the system supports up to 15 sequential days in year 100 of simulation (Figure 4.1 bottom).
4.4 Discussion
The methodology proposed allows the YieldSAFE model to simulate long-term acorn fruit production from dehesas agroforestry systems. Although the model is not sensitive to the high variability of acorn production, the long-term prediction matches well the values reported in the literature. Furthermore, the estimation of fruit production linked to data on utilisable metabolizable energy provided a coherent estimation of the carrying capacity for Iberian pigs. These first results seem to offer consistent information related to the potential carrying capacity of dehesa/montado systems that will enable future assessments of land management scenarios to improve the provisioning of food and materials. Due to its simple approach, the proposed methodology can be transferred to other silvopastoral systems in Europe, developed under the AGFORWARD project (Burgess et al. 2015).
4.5 Acknowledgements
The AGFORWARD project (Grant Agreement N° 613520) is funded by the European Commission, Directorate General for Research & Innovation, within the 7th Framework Program of RTD, Theme 2 - Biotechnologies, Agriculture & Food. The views and opinions expressed in this report are purely those of the writers and may not in any circumstances be regarded as stating an official position of the European Commission.
4.6 References
Burgess PJ, Crous-Duran J, den Herder M, Dupraz C, Fagerholm N, Freese D, Garnett K, Graves AR, Hermansen JE, Liagre F, Mirck J, Moreno G, Mosquera-Losada MR, Palma JHN, Pantera A, Plieninger T, Upson M (2015). AGFORWARD Project Periodic Report: January to December 2014 Cranfield University: AGFORWARD, 95 pp.
Cañellas I, Roig S, Poblaciones MJ, Gea-Izquierdo G, Olea L (2007). An approach to acorn production in Iberian dehesas. Agroforestry Systems, 70(1), 3–9. http://doi.org/10.1007/s10457-007-9034-0
Fernández-Rebollo P, Carbonero-Muñoz BA (2008). La dehesa en el norte de Córdoba. Perspectivas futuras para su conservación. Publicaciones, Servicio de 978-84-7801-902-1, Universidad de Córdoba 443 pp
Gea-Izquierdo G, Cañellas I, Montero G (2006). Acorn production in Spanish holm oak woodlands. Forest Systems 15: 339–354.
Hodgson J (1990). Grazing Management: Science into Practice. Longman Handbooks in Agriculture (Book 4).
Köster T, Viiralt R, Geherman V (2004). Yield, quality and ecologically balanced utilisation of semi-natural grasslands on coastal areas of Estonia. In Lüscher A, Jeangros B, Kessler W, Huguenin O, Lobsiger M, Millar N, and Suter D (Eds), Land Use Systems in Grassland Dominated Regions (Vol. 9, pp. 904–908). Luzerne: European Grassland Federation.
Lopez-Bote CL, Fructuoso G, Mateos GG (2000) Sistemas De Producción Porcina Y Calidad De La Carne. El Cerdo Ibérico. XVI Curso de Especialización FEDNA.
Moreno G, Obrador JJ, García A (2007) Impact of evergreen oaks on soil fertility and crop production in intercropped dehesas. Agriculture, Ecosystems and Environment 119(3-4): 270–280. http://doi.org/10.1016/j.agee.2006.07.013
Palma J (2015). CliPick : Project Database of Pan-European Simulated Climate Data for Default Model Use. Milsetone 6.1 report. AGFORWARD EU project (GA 613520). Instituto Superior de Agronomia, Lisboa. Available @ http://hdl.handle.net/10400.5/9886
Pintado M (2015). As características nutricionais e funcionais da bolota para consumo humano. I Symposium Bolota: O futuro de um alimento com Passado. Available @ http://goo.gl/k1oHVA. van der Werf W, Keesman K, Burgess P, Graves AR, Pilbeam D, Incoll LD, Metselaar K, Mayus M,
Stappers R, van Keulen H, Palma J, Dupraz C (2007). Yield-SAFE: A parameter-sparse, process-based dynamic model for predicting resource capture, growth, and production in agroforestry systems. Ecological Engineering, 29(4), 419–433. http://doi.org/10.1016/j.ecoleng.2006.09.017
5 Agroforestry at all latitudes? Unexpected results about best
designs to allow more light to the crop at various latitudes
Copy of paper: Dupraz C, Lecomte I, Molto Q, Blitz-Frayret C, Gosme M. (2016). Agroforestry at alllatitudes? Unexpected results about best designs to allow more light to the crops at various latitudes. In: 3rd European Agroforestry Conference Book of Abstracts, pp. 359-362 (Eds. Gosme M et al.). Montpellier, France, 23-25 May 2016
5.1 Introduction
Why are high latitude farmers so reluctant towards agroforestry? Competition for light between trees and crops is the greatest fear of most farmers when considering agroforestry adoption (Graves et al. 2009). It is usually assumed that this competition for light would be very detrimental to the crops at high latitudes (above 45° Latitude). Current agroforestry practices in Europe are mostly maintained at Southern Mediterranean latitudes (Eichhorn et al. 2006), and agroforestry is more successful in the tropics than in the temperate world (Ong et al. 1991). Both facts may support that radiation availability is limiting agroforestry adoption at high latitudes. Another recent assumption is that North-South tree lines should be preferred to allow for a more homogeneous irradiation of the crops in the alleys at temperate latitudes (Dufour et al. 2013). However, the effect of trees on light availability for the crop can be very different at different latitudes because of different day length and sun trajectories. Using a numerical simulation model, we question these paradigms, and look for their validity domain at different latitudes.
5.2 Material and methods
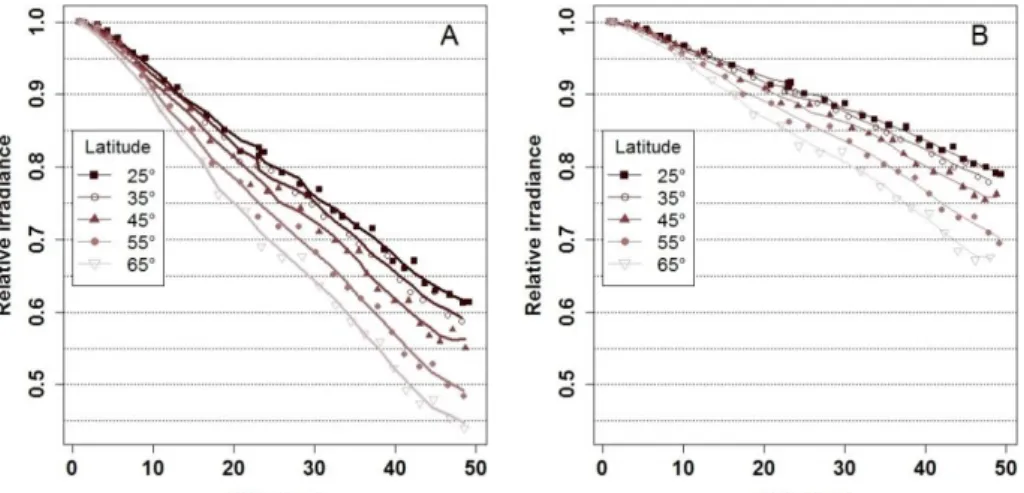
Direct field experiments involving latitude are not feasible. We therefore decided to adopt a virtual experiment approach, using a process based model of agroforestry systems. We used the Hi-sAFe model that includes a 3D light competition module between trees and crops. This light module was previously validated with field observations (Talbot and Dupraz 2012). The model is spatially explicit, allowing comparing various planting designs including tree density, tree rows orientation, plantation design (rectangular, quincunx) and pruning intensity. We computed the radiation available for crops in an alley-cropping system at five latitudes (25°, 35°, 45°, 55°, 65° Lat North ), two distances between tree lines (17 versus 35 m) and two tree row orientations (North-South, East-West). Trees were spaced 7 m on the tree line, resulting in a planting density of 84 and 41 trees ha-1 with the 17 m crop alley and 34 m crop alley respectively. We calculated the relative irradiation of the crop (ratio of incoming radiation at the crop level divided by the incoming radiation on the plot) at the day time step and m² scale, and aggregated it at various time (month, year, decades) and spatial (m², cropped alley, total plot) scales. Spatial variability was calculated as the coefficient of variation of the relative irradiation of the 1-m² cells of the cropped alley. To assess seasonal effects, we also computed the irradiation of the crops at some key times of the year. The simulations were run until the trees had reached 50 cm Diameter at Breast Height (DBH) at all sites, allowing comparing the relative irradiation of the crops with the same DBH for all trees. The simulated trees were deciduous trees (walnut type) with the same pruning scheme (every two years, 30% of tree height, up to 4 m).
5.3 Results and discussion Intensity of crop irradiation
Tree density affected crop relative irradiation at all latitudes (Figure 5.1) with higher levels for more widely spaced trees.
Figure 5.1. Variation of the annual relative irradiance at crop level as a function of tree size at 5 levels of latitude (East-West tree line orientation at 17 m (A) and 35 m (B) between tree lines). Relative irradiation was lower at high latitudes, but did not vary much between the tropics and temperate latitudes. It is sometimes assumed that crops adapted to shady environments may cope with up to 50% of reduction of the irradiance, and will perform with no yield decrease at 80% relative irradiance (Ong et al., 1991). With 41 trees ha-1 (35 m between tree lines), the 50% threshold was never reached at all latitudes (Figure 5.1B), showing that agroforestry should be feasible at high latitudes with widely spaced tree lines. With 84 trees ha-1 (17 m between tree lines), the relative irradiation of the crops remained above 60% for the whole cycle at low latitudes, and for more than half the tree life cycle at very high latitudes (Figure 5.1A). However annual values may not be sensible when discussing the behaviour of crops with short growing seasons. We therefore zoomed in on targeted periods of the year (Figure 5.2) with very large mature trees (50 cm DBH).
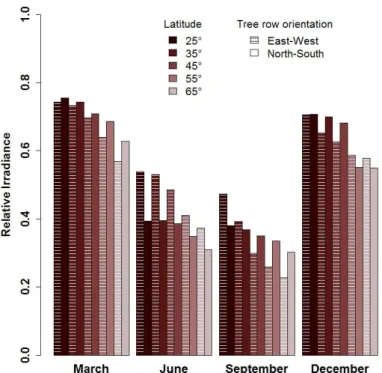
Figure 5.2. Relative irradiation of the crop in March, June, September and December with 50 cm DBH deciduous trees (tree rows at 17 m spacing).
Surprising patterns of radiation capture by the trees are evidenced. The practical result is not trivial: to increase radiation availability on the crops, East-West tree lines are better at low (tropic) latitudes, North-South tree lines at high latitudes, and there is no clear preference at temperate latitudes. This is at odds with the common sense and previous knowledge. The relative irradiation of crops decreased with latitude at all periods of the year except in June with North-South tree lines, where it remained almost constant between 25 and 45° latitude. For summer crops, East-West tree lines should not be used at high latitudes, as the late summer irradiation of crops was low with such a tree row orientation.
Heterogeneity of crop irradiation
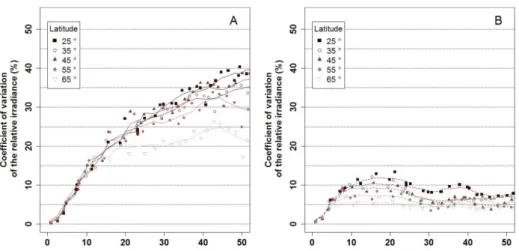
Farmers need to grow crops as homogeneous as possible, so that all management practices (in particular harvest) can be done on the whole alley at the same time. If crop irradiation is too heterogeneous, some parts of the crop may be ripe when other parts are not. Heterogeneity of irradiance at crop level increased steadily with tree size (Figure 5.3A) for East-West tree lines, while North-South tree lines (Figure 5.3B) lead to a higher homogeneity of the relative irradiation. With North-South tree lines, heterogeneity peaked with medium sized trees and then stabilized at a lower level for larger trees. Our simulations showed a higher homogeneity of the crop relative irradiation with 35 m spaced tree lines, although the difference between the most sunny and the most shaded locations was maintained (results not shown).
Figure 5.3. Heterogeneity of crop irradiation expressed by the coefficient of variation for the month of June of the relative irradiation for 17m wide alleys with East-West tree lines (A) and North-South tree lines (B).
5.4 Conclusion
It may not be safe to draw conclusions with only relative irradiation values. Absolute incoming irradiance also decreases with latitude, and this may result in levels of absolute radiation that would be limiting for the crops, even when the relative irradiation is high. The total annual radiation is reduced at high latitudes, but this is not true at all times of the year. At the summer solstice, the incoming irradiance is quite uniform across latitudes. At high latitudes, summer crops are the rule, and they will therefore benefit from high levels of irradiation even in agroforestry systems during the summer. Practical rules can then be inferred from our simulations results, based on a mature tree DBH of 50 cm (Table 5.1). Agroforesters want more light and less light heterogeneity on their crops, but they also want a fast growth of the trees. Our simulation results could allow finding a compromise between these requirements based on numerical estimation of crop and tree growth. Table 5.1. Looking for best practices in alley cropping agroforestry: what is the best tree line orientation? Increase light availability Reduce light heterogeneity Increase tree growth Best compromise Low latitudes (<35°)
(Tropics) East-West +++ North-South+ North-South+ East-West Temperate latitudes
(35°-50°) Equal North-South++ North-South+ North-South
High latitudes (>50°)
(Boreal/Austral) North-South+++ Equal+ Equal North-South Comparing the latitudes with the same tree sizes may also be questioned. Trees grow slower at Northern latitudes because of the radiation and temperature decrease that shorten the growing season. As a result, for a given tree age, crop shading is smaller at high latitudes than in the tropics. If we compare the different latitudes with different final tree sizes (linear decrease between 50 cm DBH at 25°N and 30 cm DBH at 65°), we come up with a very different conclusion : summer crop relative irradiation becomes uniform and agroforestry is possible at all latitude. These novel results
are at odds with the conclusions of some previous studies (Dufour et al., 2013; Molto and Dupraz, 2014).
5.5 Acknowledgements
The AGFORWARD project (Grant Agreement N° 613520) is funded by the European Commission, Directorate General for Research & Innovation, within the 7th Framework Program of RTD, Theme 2 - Biotechnologies, Agriculture & Food. The views and opinions expressed in this report are purely those of the writers and may not in any circumstances be regarded as stating an official position of the European Commission.
5.6 References
Dufour L, Metay A, Talbot G, Dupraz C (2013). Assessing light competition for cereal production in temperate agroforestry systems using experimentation and crop modelling. Journal of Agronomy and Crop Science 199: 217-227.
Eichhorn M, Paris P, Herzog F, Incoll L, Liagre F, Mantzanas K, Mayus M, Moreno G, Papanastasis V, Pilbeam D, Pisanelli A, Dupraz C (2006). Silvoarable systems in Europe: past, present and future prospects. Agroforestry Systems 67: 29-50.
Graves AR, Burgess PJ, Liagre R, Pisanelli A, Paris P, Moreno G, Bellido M, Mayus M, Postma M, Schindler B, Mantzanas K, Papanastasis VP, Dupraz C (2009), Farmer perceptions of silvoarable systems in seven European countries. In: Rigueiro-Rodríguez A, McAdam JH, Mosquera-Losada MR (eds) Agroforestry in Europe: Current Status and Future Prospects, pp. 67-86. Springer. Molto Q, Dupraz C (2014). Is light competition between trees and crops a limiting factor for
agroforestry systems at high latitudes? In: EURAF (eds), 2nd European Agroforestry Conference, pp 257. European Agroforestry Federation, Cottbus, Germany.
Ong CK, Corlett JE, Singh RP, Black CR (1991) Above and below ground interactions in agroforestry systems. Forest Ecology and Management 45: 45-57.
Talbot G, Dupraz C (2012). Simple models for light competition within agroforestry discontinuous tree stands: are leaf clumpiness and light interception by woody parts relevant factors? Agroforestry Systems 84: 101-116.
6 Using the Yield-SAFE model to assess hypothetical eucalyptus
silvopastoral systems in Portugal
Copy of the paper: Palma JHN, Oliveira TS, Crous-Duran, Paulo JA. (2016). Using Yield-SAFE model to assess hypothetical eucalyptus silvopastoral systems in Portugal. In: 3rd European Agroforestry Conference Book of Abstracts, pp. 348-351 (Eds. Gosme M et al.). Montpellier, France, 23-25 May 2016.
6.1 Introduction
In the last Portuguese forest inventory, Eucalyptus globulus Labill became the species with the largest forest area. This species now occupies 812,000 ha in Portugal (ICNF 2013) and despite the area increase in recent years, it is anticipated that demand will increase in the next 30 years at an annual rate of 1.6% (AIFF 2013).
During 2014, the AGFORWARD project, sponsored by the European Union, supported about 40 stakeholders meetings on agroforestry across Europe. In one of the Portuguese meetings organized in Coruche (Cork production hotspot region in Portugal), stakeholders asked about eucalyptus agroforestry solutions. In Portugal, agroforestry with eucalyptus is not practiced but the system is promoted in South America where silvopastoral systems with eucalyptus combine pulpwood and forage production on the same area of land (Souza et al. 2000; Paula et al. 2013).
The future demand scenarios of pulpwood may suggest the possibility for considering this species within an agroforestry system, e.g. an alley cropping design. Currently, eucalyptus has an interesting economic return and these systems could be up taken by farmers, even without institutional financial support.
Taking advantage of process-based modelling tools, this paper investigates the anticipated yields under a hypothetical eucalyptus agroforestry system, with and without irrigation.
6.2 Material and Methods
The Yield-SAFE model (van der Werf et al. 2007), a process based modelling concept for agroforestry systems, was calibrated for eucalyptus, a ryegrass pasture, and used to determine the potential yields of hypothetical eucalyptus agroforestry systems, comparing scenarios of a) grassland (G), b) G+52 trees ha-1 (T), c) G+203 trees ha-1,and d) G+1000 trees ha-1, in a location near Coruche (approx. Lat: 38.94°N, Lon:8.61°W). The projections were made considering two water scenarios: 1) irrigated (no water limitation) and 2) rain-fed.
For the calibration and simulation we used artificial climate retrieved from the CliPick tool (Palma 2015) for the locations of the tree measurements and near Coruche.
The tree calibration was made with data from experimental plots where eucalyptus trees were irrigated. Ryegrass was calibrated considering farmer potential yield references (7.5 Mg ha-1) and, for comparison purposes, data from natural grassland from Moreno and Cáceres (2016).
The crop component module in Yield-SAFE needed to integrate a maintenance respiration cost to allow the reduction of biomass during the year. The integration was made using the equation proposed by Thornley (1970):
𝑅𝑘 = 𝑚𝑊𝑘−1+ 𝑔𝑊𝑎𝑐𝑡𝑘−1
While the equation of the daily actual growth in YieldSAFE was updated to consider this cost: 𝛿𝑊𝑎𝑐𝑡𝑘 = 𝑓𝑊𝑟𝑒𝑑∗ 𝛿𝑊𝑝𝑜𝑡𝑘− 𝑅𝑘
Where Rk is the maintenance respiration (g m-2) in day k, m is the maintenance coefficient
representing the amount of carbon respired to maintain existing biomass (g g-1 d-1), g is the amount of carbon respired per unit of carbon used in growth (g g-1), W is the biomass of the crop (g m -2),Wact is the actual biomass growth (g m-2 d-1), fWred is the modifier for water reduced growth
(ratio) and Wpot is the potential growth (g m-2 d-1). Values of m = 0.037 g g-1 d-1 and g = 0.54 g g-1 were used as suggested by Reekie and Redmann (1987).
For the estimation of carrying capacity we considered 13765 MJ Mg-1 of metabolizable energy in ryegrass as suggested by Milford and Minson (1965) with a livestock unit needing a yearly value of 37668 MJ (Hodgson 1990).
To evaluate the efficiency of resource use, the land equivalent ratio (LER) was calculated as:
𝐿𝐸𝑅 = 𝑐𝑟𝑜𝑝 𝑏𝑖𝑜𝑚𝑎𝑠𝑠 𝑖𝑛 𝑎𝑔𝑟𝑜𝑓𝑜𝑟𝑒𝑠𝑡𝑟𝑦 𝑐𝑟𝑜𝑝 𝑏𝑖𝑜𝑚𝑎𝑠𝑠 𝑚𝑜𝑛𝑜𝑐𝑟𝑜𝑝𝑝𝑖𝑛𝑔 +
𝑠𝑡𝑎𝑛𝑑 𝑏𝑖𝑜𝑚𝑎𝑠𝑠 𝑖𝑛 𝑎𝑔𝑟𝑜𝑓𝑜𝑟𝑒𝑠𝑡𝑟𝑦 𝑠𝑡𝑎𝑛𝑑 𝑏𝑖𝑜𝑚𝑎𝑠𝑠 𝑖𝑛 𝑓𝑜𝑟𝑒𝑠𝑡𝑟𝑦 6.3 Results and discussion
The tree calibration result was obtained using parameter values present in the literature, matching the observed values of the potential yield experiment. The model was able to capture the yield range variability by assuming climate and soil characteristics from two measurement areas (Figure 6.1 – top). The parameter set used for the ryegrass allowed the simulation of the yields indicated from farmer knowledge and literature.
The model was able to incorporate the maintenance respiration in the crop component. Not only was the model able to predict the ryegrass yield but also the characteristic fluctuations of grassland biomass throughout the year (Figure 6.1 – top right).
These first simulation results suggest that using irrigation on a design similar to a forest might increase growth up to 6 times (from about 100 kg tree-1 to 600 kg tree-1 at 12 years). This yield seems even higher than the yield obtained after 10 years in the potential calibration site (about 450 kg tree -1
). However, the average yearly radiation (not shown) received in Coruche (5401 MJ m-2) was greater than that (4899 MJ m-2) in the experimental plot and this could explain the higher yields in the Coruche simulation.
Moving further into unknown ground, the model estimates a tree size of about 1200 kg in an agroforestry system with a density of 52 trees ha-1, which is twice the size of the trees in the density of 1000 trees ha-1. Although a two-fold increase seems high, relations of this magnitude have been previously found in other temperate agroforestry systems (Balandier and Dupraz 1999; Cabanettes et al. 1999) and in other Eucalyptus species density trials, even at earlier ages (Cockerham 2004; Stape and Binkley 2010). This relationship suggests that with 203 trees ha-1 under irrigation, the stand volume after 10 years could be about 400 m3 ha-1. The equivalent volume at a stand density of 1000 irrigated trees ha-1 would be 1000 m3 ha-1 after 10 years. The model also suggests that with about 200 trees ha-1, the grass yield under the trees is still higher than the yield of a rain-fed grass without trees.
Under a rain-fed system, with 203 trees ha-1, the model predicts about 60% grass yield reduction at the end of the 10 year rotation. Graves et al. (2010) predicted a 40% reduction in crop yield after 10 years but for a density of 113 poplar trees ha-1. With 50 trees ha-1, the farmer could have about 20% reduction while harvesting about 50 m3 ha-1 of wood after 10 years.
The carrying capacity of the grassland (not shown) without trees yielded an average of 2.7 LU ha-1 and 1.0 LU ha-1 for irrigated and rain-fed systems respectively. After 10 years, the systems with 52, 203 and 1000 trees ha-1, had a carrying capacity of 2.4, 1.7 and 0.4 LU ha-1 for irrigated systems, while the rain-fed systems had a carrying capacity of 0.8, 0.5, and 0.1 LU ha-1 for the three tree densities. The carrying capacity in the Mediterranean grassland ranges between 0.15 and 0.74 LU ha -1
(Reis et al. 2014). Therefore the model suggests that although the yields of rain-fed ryegrass under a forest system may be low, the agroforestry systems with 52 and 203 trees ha-1 could maintain a carrying capacity similar to natural Mediterranean grassland. Furthermore it is noticed in the simulation that irrigated systems not only increase the grass yield, but also increase the duration of grass production (Figure 6.1 – top right), which is important in livestock management. Although it is known that higher water availability can lead to longer growing seasons, the model can be used to explore the effect of trees on radiation interception, temperature, wind speed and evapotranspiration (see Palma et al. in this book of abstracts).
In terms of resource use efficiency, the predicted land equivalent ratios (not shown) were 1.2 and 1.1 for the rain-fed systems with 203 and 52 trees ha-1 respectively and 1.1 and 1.0 for the corresponding irrigated systems. Although these ratios are not as high as other agroforestry systems, there is a tendency to have higher efficiency in water limited systems, where lower soil evaporation due to the presence of trees might play an important role in water balance and availability to plants.
C ali bra ti on S imul a ti on i rr iga ted S imul a ti on ra infed
Figure 6.1. Yield-SAFE calibration results for Eucalyptus globulus (top-left) and ryegrass yields for irrigated, rain-fed and reference yields for natural grassland from Moreno and Caceres (2016). Simulated yields under irrigated and rain-fed regimes for grassland without trees (G0), grassland with 52, 203 and 1000 trees ha-1 with tree biomass (TB) for reference, and stand volumes.
6.4 Conclusions and further research
Yield-SAFE has been calibrated for the first time for eucalyptus in Portugal, and it predicts yields within the limits of existing observations and it seems to respond appropriately to the changes in soil and climate inputs. However the tree yields in the agroforestry systems seem high and, in the
absence of an agroforestry trial, these results cannot be verified. However existing literature on eucalyptus forest trials, with densities similar to agroforestry, support the results of this work.
Eucalyptus globulus agroforestry systems are not currently practiced in Portugal but models such as
Yield-SAFE can provide insights and increase our knowledge on relationships between trees and crops in terms of resource use.
Further tree and crop calibrations and model improvements are being developed under the modelling tasks of AGFORWARD project. The modelling of economic and provisioning of additional ecosystems services are currently being linked to Yield-SAFE with the aim of providing a consistent analysis of agroforestry systems and innovations throughout Europe.
6.5 Acknowledgements
We acknowledge support of ALTRI for providing access to eucalyptus data and the European Commission through the AGFORWARD FP7 research project (contract 613520). The views and opinions expressed in this report are purely those of the writers and may not in any circumstances be regarded as stating an official position of the European Commission.
6.6 References
AIFF (2013). Estudo prospetivo para o setor florestal. Associação Para a Competitividade da Indústria da Fileira Florestal, 295 pp.
Balandier P, Dupraz C (1999). Growth of widely spaced trees: A case study from young agroforestry plantations in France. Agroforestry Systems 43:151–167.
Cabanettes A, Auclair D, Imam W (1999). Diameter and height growth curves for widely-spaced trees in European agroforestry. Agroforestry Systems 43:169–181.
Cockerham ST (2004). Irrigation and planting density affect river red gum growth. California Agriculture 58:40–43.
Graves AR, Burgess PJ, Palma J, Keesman, K, van der Werf W, Dupraz C, van Keulen H, Herzog F, Mayus M (2010). Implementation and calibration of the parameter-sparse Yield-SAFE model to predict production and land equivalent ratio in mixed tree and crop systems under two contrasting production situations in Europe. Ecological Modelling 221:1744–1756.
Hodgson J (1990). Grazing Management: Science into Practice. Wiley
ICNF (2013). 6o Inventario Florestal Nacional - Áreas dos usos do solo e das espécies florestais de Portugal continental. Resultados Preliminares. ICNF, 34pp.
Milford R, Minson J (1965). The energy value of ryegrass and cocksfoot assessed by a slaughter technique with lambs. British Journal of Nutrition 19:373–382.
Moreno GM, Cáceres Y (2016). System report: Iberian Dehesa, Spain. EU AGFORWARD project (GA 613520). 53pp.
http://www.agforward.eu/index.php/en/dehesa-farms-in-spain.html
Palma J (2015). CliPick : Project Database of Pan-European Simulated Climate Data for Default Model Use. Milestone 6.1 report. AGFORWARD EU project (GA 613520). Instituto Superior de Agronomia, Lisboa, 22pp.,
http://www.agforward.eu/index.php/en/clipick-project-database-of-pan-european-simulated-climate-data-for-default-model-use.html
Paula RR, Reis GG, Reis MGF, Oliveira Neto SN, Leite HG, Melido RCN, Lopes HNS, Souza FC (2013). Eucalypt growth in monoculture and silvopastoral systems with varied tree initial densities and spatial arrangements. Agroforestry Systems 87:1295–1307.
Reekie EG, Redmann RE (1987). Growth and maintenance respiration of perennial root systems in a dry grassland dominated by Agropyron dasystachyum (hook.) scribn. New Phytologist 105:595– 603.
Reis P, Rolo J, Coelho IS, Belo CC (2014). Sistemas agroflorestais em Portugal continental. Parte I: economia e distribuição geográfica. Rev Ciências Agrárias 37:113–121.
Souza ÁN De, Ângelo H, Joaquim MS, et al (2000). Economic feasibility of an Eucalyptus agroforestry system in Brazil. In: Global Perspectives on Sustainable Forest Management. Okia CA (Ed). InTech Europe.
Stape JL, Binkley D (2010). Insights from full-rotation Nelder spacing trials with Eucalyptus in São Paulo, Brazil Southern Forests: a Journal of Forest Science 72:91–98. doi: 10.2989/20702620.2010.507031
Thornley JH (1970). Respiration, growth and maintenance in plants. Nature 227:304–305.
van der Werf W, Keesman K, Burgess P, Graves AR, Pilbeam D, Incoll LD, Metselaar K, Mayus M, Stappers R, van Keulen H. Palma J, Dupraz C (2007). Yield-SAFE: A parameter-sparse, process-based dynamic model for predicting resource capture, growth, and production in agroforestry systems. Ecological Engineering 29:419–433.
7 Assessing the environmental externalities of arable, forestry, and
silvoarable systems: new developments in Farm-SAFE
Copy of the paper : Garcia de Jalon S, Graves A, Kaske KJ, Palma J, Crous-Duran J, Burgess PJ (2016). Assessing the environmental externalities of arable, forestry, and silvoarable systems: new developments in Farm-SAFE. In: 3rd European Agroforestry Conference Book of Abstracts, pp. 363-366 (Eds. Gosme M et al.). Montpellier, France, 23-25 May 2016.
7.1 Introduction
From the 1960s to the beginning of the twenty-first century, increased crop yields per unit area in Western Europe have occurred as a result of plant breeding, the use of external inputs such as agrochemicals and fertilizers, and the use of specialised field machinery (Burgess and Morris, 2009). However this has also led to negative environmental impacts such as nonpoint-source pollution from agrochemicals, soil degradation, and greenhouse gas (GHG) emissions.
In the SAFE project (Dupraz et al. 2005), a Microsoft Excel-based spreadsheet model called Farm-SAFE (Graves et al. 2007; 2011) was developed to evaluate the financial costs and benefits of arable, forestry and silvoarable systems in Europe (with and without grants). The model was used to determine some of the environmental impacts (Palma et al. 2007) but these were not valued. Within the AGFORWARD project (Burgess et al. 2015), the Farm-SAFE model has been developed to assess and compare the environmental externalities of carbon emissions and sequestration, soil erosion, and nonpoint-source pollution from fertilisers in arable, forestry and silvoarable systems.
7.2 Methods
The Farm-SAFE financial and economic model of arable, forestry, and silvoarable agroforestry systems has been adapted to include the following environmental externalities:
GHG emissions: In order to incorporate negative externalities of GHG emissions life-cycle based data
were used. The model was adapted for the analysis of GHG emissions and sequestration in aboveground biomass. In doing so, the resources and energy used in the production system (input) and the emissions released into the environment (output) were measured and included in the economic analysis.
Soil erosion: The Revised Universal Soil Loss Equation (RUSLE) (Equation 1) was used to calculate the
annual soil loss in the different production systems.
A = R * K * LS * C * P [Equation 1]
Where A is the estimated average soil loss in tons per acre per year; R is the rainfall-runoff erosivity factor; K is the soil erodibility factor; L is the slope length factor; S is the slope steepness factor; C is the cover-management factor; P is the support practice factor. When comparing soil loss in arable, forestry and silvoarable systems in the same geographical area, the factors R, K, LS and P were considered constant and only changes in the C-factor were used to assess the differences among the systems.
Nonpoint-source pollution from fertiliser use: The emissions of Nitrogen (N) and Phosphorus (P) were
considered in the analysis. The differences among arable, forestry and silvoarable systems were calculated as a function of the N and P fertilizer rates and the N and P leaching rates of each system. 7.3 Results and discussion
The results presented in this paper are only for the GHG emissions. Further develop of this paper will include soil degradation and nitrogen and phosphorus loss as additional environmental externalities. In order to include the GHG emissions in the assessment a ‘cradle-to-farm gate’ perspective was used. Figure 7.1 shows the Life Cycle Assessment (LCA) system boundary for the operations of an arable system. Operations assumed to take place outside the farm gate such as cooling, drying, crop storage, and further processing of the outputs were not taken into consideration. The establishment of the farm itself, the construction of the infrastructure and transportation were also excluded from the analysis.
Figure 7.1. System diagram for the Life Cycle Assessment (LCA) of arable cropping, showing the system boundary and which inputs were included in the analysis of GHG emissions. Source: Kaske (2015).
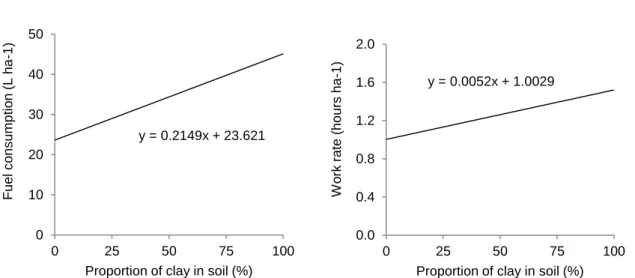
One of the model innovations developed in this work was the flexibility for the user to change the tractor size and soil type. For some field operations, these factors are associated with the fuel consumption and work rate which affects the GHG emissions. Equations of these relationships were calculated and used to interpolate values. Figure 7.2 shows an example of the equation used for the relationship between the clay content of the soil and a) fuel consumption and b) work rate. As shown, in both cases the higher the clay content percentage in the soil the higher fuel consumption and work rate. Furthermore the model allows the user to select three different cultivation methods: plough based cultivation, reduced tillage and direct drilling. The results presented in this study include the field operations for reduced tillage.
Cultivation Direct drilling Reduced tillage Ploughing Sub-soiling Pesticide application Fertiliser application Chemical application Baling Harvest Harvest Vehicle and machinery operations
Manufacture and delivery of machinery and buildings Fuel for farm machinery Pesticides Fertilisers
Manufacture and delivery of fertilisers and pesticides
Seeds
Crop production
Straw
Grains, seeds and
a) Ploughing with four furrows b) Subsoiling of tramlines (3 leg sub-soiler)
Figure 7.2. Assumed relationship of the effect on the proportional clay content of the soil on a) fuel consumption for ploughing, and b) the work rate of sub-soiling.
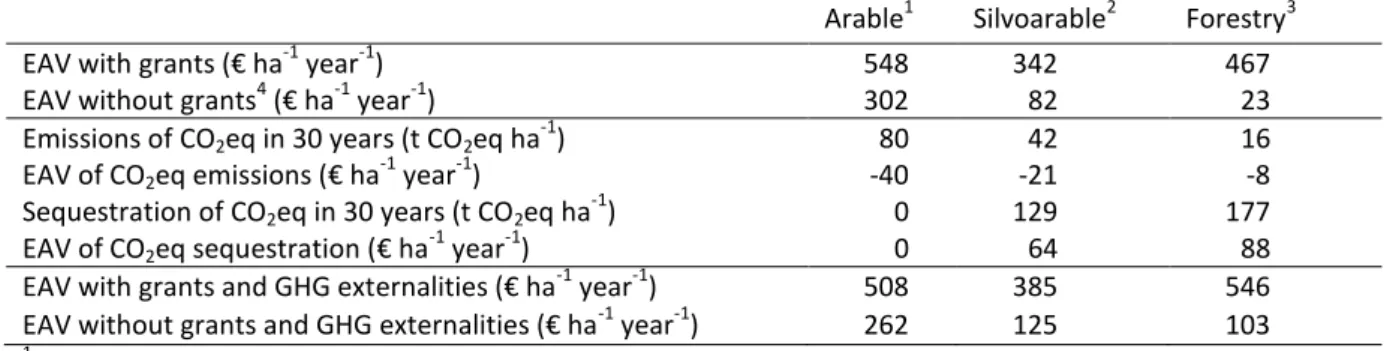
Using such values, the equivalent annual value (EAV) of an arable, forestry and silvoarable system was calculated for a location in Bedfordshire in the United Kingdom (Table 7.1). The arable system is a four year crop rotation of wheat, wheat, barley and oilseed; the forestry system is a poplar tree plantation; and the silvoarable system is poplar tree with cropped alleys with the same rotation of the arable system. The EAV was estimated for a time horizon of 30 years at a 5% discount rate with and without grants as well as with and without including the externality of GHG emissions. The carbon price used for the calculations was 7.63 € per tonne of CO2 which is being achieved in the UK (UK Forestry Commission, available at: www.forestry.goc.uk/carboncode).
The analysis indicated that the EAV, with grants, for the arable system (548 € ha-1) was more profitable for the farmer than the silvoarable (342 € ha-1) and forest systems (467 € ha-1). Without grants, the profitability of the silvoarable system (82 € ha-1) was between that for the arable (302 € ha-1) and forest systems (23 € ha-1). Since grants are paid by society it can be argued that the societal benefits of the system are based considered without the inclusion of grants.
Starting from the assumption of not including the grants, the inclusion of the societal cost of GHG emissions reduced the difference between the EAV of the arable and the silvoarable system from 220 € ha-1 to 137 € ha-1 (Table 7.1). These results highlight how including environmental costs can change the relative societal advantage of different land uses.
y = 0.2149x + 23.621 0 10 20 30 40 50 0 25 50 75 100 Fu e l c o n s u m p ti o n (L h a -1)
Proportion of clay in soil (%)
y = 0.0052x + 1.0029 0.0 0.4 0.8 1.2 1.6 2.0 0 25 50 75 100 W o rk ra te (h o u rs h a -1)
Table 7.1. Equivalent Annual Value (EAV) of an arable, forestry and silvoarable system in Bedfordshire in the United Kingdom. Results shown for a time horizon of 30 years at a 5% discount rate.
Arable1 Silvoarable2 Forestry3
EAV with grants (€ ha-1 year-1) 548 342 467
EAV without grants4 (€ ha-1 year-1) 302 82 23
Emissions of CO2eq in 30 years (t CO2eq ha-1) 80 42 16
EAV of CO2eq emissions (€ ha-1 year-1) -40 -21 -8
Sequestration of CO2eq in 30 years (t CO2eq ha-1) 0 129 177
EAV of CO2eq sequestration (€ ha-1 year-1) 0 64 88
EAV with grants and GHG externalities (€ ha-1 year-1) 508 385 546
EAV without grants and GHG externalities (€ ha-1 year-1) 262 125 103
1
: the arable system was a rotation of wheat, wheat, barley and oilseed rape
2: the silvoarable system was the same rotation as the arable system with poplar hybrids planted at 113 trees
per hectare.
3
: the forestry system was hybrid poplars planted at a density of 156 trees per hectare.
4: The grant values are based on the grant arrangements in 2013 (UK Agro Business Consultants, 2013). These
are different from current grant values in 2016 7.4 Conclusions
Financial analyses can quantify the benefits and costs of different land management practices from a farmer’s perspective, but this does not necessarily reflect the full benefits and costs to society. Including environmental externalities in the assessment helps highlight the most appropriate land use decisions from a societal perspective. This work presents some model improvements developed in Farm-SAFE in order to include key environmental externalities from agricultural and forestry activities. Including carbon sequestration and GHG costs in the example selected from the UK reduced the relative value of a conventional arable system compared to silvoarable agroforestry and forestry. It is anticipated that inclusion of environmental costs such as soil degradation and nitrogen and phosphorus loss would further enhance the relative societal benefit from the silvoarable or forestry system.
7.5 Acknowledgements
We acknowledge support of the European Commission through the AGFORWARD FP7 research project (contract 613520). The views and opinions expressed in this report are purely those of the writers and may not in any circumstances be regarded as stating an official position of the European Commission.
7.6 References
Agro Business Consultants (2013). The Agricultural Budgeting & Costing Book. 80th Edition. Melton Mowbray: Agro Business Consultants.
Burgess PJ, Morris J (2009). Agricultural technology and land use futures: the UK case. Land Use Policy 26S: S222-S229.
Burgess PJ, Crous-Duran J, den Herder M, Dupraz C, Fagerholm N, Freese D, Garnett K, Graves AR, Hermansen JE, Liagre F, Mirck J, Moreno G, Mosquera-Losada MR, Palma JHN, Pantera A, Plieninger T, Upson M (2015). AGFORWARD Project Periodic Report: January to December 2014. Cranfield University: AGFORWARD. 95 pp.
Dupraz C, Burgess P, Gavaland A, Graves A, Herzog F, Incoll LD, Jackson N, Keesman K, Lawson G, Lecomte I, Liagre F, Mantzanas K, Mayus M, Moreno G, Palma J, Papanastasis V, Paris P, Pilbeam DJ, Reisner Y, van Noordwijk M, Vincent G, van der Werf W (2005). SAFE final report-Synthesis of the Silvoarable Agroforestry For Europe project. INRA-UMR System Editions, European Union.
Graves AR, Burgess PJ, Liagre F, Terreaux J-P, Borrel T, Dupraz C, Palma J, Herzog F (2011). Farm-SAFE: the process of developing a plot- and farmscale model of arable, forestry, and silvoarable economics. Agroforestry Systems 81: 93–108.
Graves AR, Burgess PJ, Palma JHN, Herzog F, Moreno G, Bertomeu M, Dupraz C, Liagre F, Keesman K, van der Werf W, de Nooy aK, van den Briel JP (2007). Development and application of bioeconomic modelling to compare silvoarable, arable, and forestry systems in three European countries. Ecological Engineering 29(4): 434–449.
Kaske KJ (2015). Development of an integrated economic model for the assessment of the environmental burden of arable, forestry and silvoarable systems. Master Thesis. School of Energy, Environment and Agrifood, Cranfield University, UK.
Palma JHN, Graves AR, Bunce RGH, Burgess PJ, de Filippi R, Keesman KJ, van Keulen H, Liagre F, Mayus M, Moreno G, Reisner Y, Herzog F (2007). Modeling environmental benefits of silvoarable agroforestry in Europe. Agriculture, Ecosystems & Environment 119(3-4): 320–334.