Eco 225
–
Monetary Economics (Macro VI)
Spring 2014/Mello
The Phillips Curve and the U.S. Disinflation of 1979-1985
1. The Phillips curve
Central bankers typically dislike inflation and unemployment. They would like to set both variables at very low levels. Unfortunately, most economists believe that there is a short-run trade-off between inflation and unemployment. If the monetary authorities wish to have low inflation, they will have to put up with higher unemployment, and vice-versa.
According to the AD-AS model, if the economy is initially at its medium run equilibrium where output is at its full-employment level, that is, where ̅, and assuming that there are no supply shocks, continuous increases in output (which implies falling unemployment) are associated with continuous increases in the price level (which implies inflation). Simply put, as we move up in the AS curve unemployment is reduced but the price level rises.
We can represent the inflation-unemployment trade-off implicit in the AS curve by the so-called Phillips curve. The Phillips curve represents the inflation-unemployment trade-off directly in terms of unemployment rate and the inflation rate, instead of the levels of output and the price as in the AS curve. It is useful to represent the inflation-unemployment trade-off in terms of the Phillips curve because policymakers typically look at inflation and unemployment as measures of economic performance, rather than the levels of price and output. The Phillips curve can be written as follows:
( ) (1)
Where is the inflation rate, is expected inflation, , is the deviation of unemployment from its natural rate (called cyclical unemployment), is a parameter that measures the response of the inflation rate to cyclical unemployment, and is a supply shock.
Assuming that there are no supply shocks, that is, , if , the we must have that . That is, if expected inflation equals the actual inflation rate, a condition that is met in the long-run, unemployment is at its natural level. This suggests that in the long-run there is no trade-off between inflation and unemployment. That is a very important observation. Departures between inflation and inflation expectations only occur in the short-run, therefore, the inflation-unemployment tradeoff represented by the Phillips curve is a temporary one.
Inflation expectations
We say that individuals have adaptive expectations if expected inflation equals
last period’s inflation rate, that is if . In this case, the Phillips curve can be written as
( ) (2)
When the Phillips curve is written as in equation (2) the natural rate of unemployment, , is called the NAIRU – the non-accelerating inflation rate of unemployment. Note that if individuals have adaptive expectations the inflation rate has an inertial component given by past inflation . The inertia in inflation rate arises because past inflation has been embedded in the wages and prices contracts. Therefore, even if the unemployment rate is at the NAIRU level and there are no supply shocks the inflation rate in the economy is non-zero; In this case, the inflation rate equals its level at the previous period.
We say that individuals have rational expectations if , that is,
individuals’ inflation expectations equals the actual inflation rate. This assumption might seem strong but when correctly interpreted we will see that it seems quite reasonable. Assume that individuals take all the relevant information in the economy (e.g., they learn about monetary and fiscal policy, they assess the probabilities of supply shocks, etc.), when forecasting the inflation rate. For instance, they base their inflation expectations on the mathematical expectation of the inflation rate conditional on all the relevant economic information, that is, something like ( | ), where ( ) is the conditional expectation, and is the individuals’ information set. If this is how individuals form expectations about inflation, is it not completely absurd to think that they will come really close to the actual inflation rate.
they are subject to systematic mistakes in their forecasts, while when expectations are formed rationally they are not. Adaptive expectations imply that individuals are backward-looking (and therefore subject to systematic mistakes in their forecasts), while rational expectations imply that individuals are forward-looking (and therefore make random errors in their forecasts). The modern research in macroeconomics typically assumes that individuals have rational expectations.
If expectations are formed rationally, then from equation (1), we have that the unemployment rate is always at its natural level. This raises some interesting possibilities. For instance, suppose that the Fed wants to disinflate the economy and announces that its target inflation rate is zero. Then if individuals have rational expectations and the Fed’s announcement is credible (as we will see later, credibility is an essential ingredient for the Fed’s policy to work) then inflation expectations adjust immediately to the level announced by the Fed, that is, , and the economy transits to the new inflation rate without experiencing cyclical unemployment. That is, the Fed can achieve lower inflation levels without enduring above-the-natural-rate levels of unemployment. This result is quite amazing. To get a flavor of why this is such a big deal the reader is referred to exercise solved at the end of this note. (The exercise, taken from Blanchard’s Macroeconomics text, #6 on page 183, shows that if expectations are formed adaptively the cost of the disinflation in terms of cyclical unemployment can be substantial. Once individuals become somewhat forward-looking the cost of the disinflation is substantially reduced; if individuals have rational expectations the disinflation is costless.)
On section 2, in this note, we analyze an important episode of disinflation in the U.S. economy in the early 1980s. We shall see that, according to the data, the U.S. disinflation in the 1980s was quite costly, which casts some doubt on whether individuals have rational expectations or whether the announcement of the disinflation policy by the Fed was credible.
2. Paul Volcker
’
s disinflation
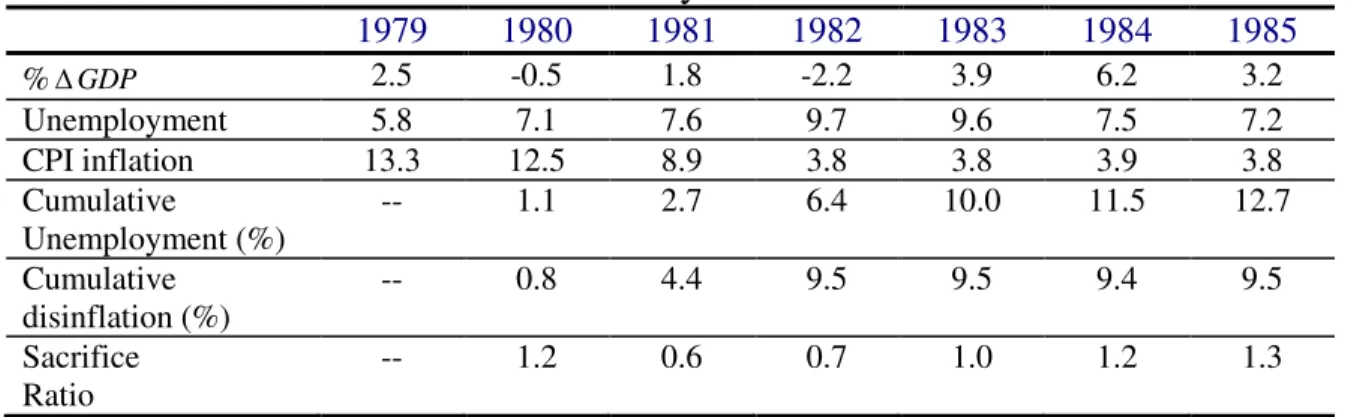
In August 1979, President Carter appointed Paul Volcker as the Chairman of the Federal Reserve. At that time, the annual CPI inflation rate was running at 13.3%. Volcker was appointed to end the high U.S. inflation rate. Table 1 displays the relevant data for the 1979-1985 disinflation years.
Table 1: The Paul Volcker disinflation years
1979 1980 1981 1982 1983 1984 1985
%GDP 2.5 -0.5 1.8 -2.2 3.9 6.2 3.2
Unemployment 5.8 7.1 7.6 9.7 9.6 7.5 7.2
CPI inflation 13.3 12.5 8.9 3.8 3.8 3.9 3.8
Cumulative
Unemployment (%)
-- 1.1 2.7 6.4 10.0 11.5 12.7
Cumulative disinflation (%)
-- 0.8 4.4 9.5 9.5 9.4 9.5
Sacrifice Ratio
-- 1.2 0.6 0.7 1.0 1.2 1.3
Notes: Source: Blanchard (2003).
Exercise
1. (Blanchard, #6, p. 183) Suppose that the Phillips curve is given by
%) 5 ( t e t
t u
And suppose that inflation expectations are given by
1 t e t
a. What is the sacrifice ratio in this economy? Answer: The sacrifice ratio is 1.
b. Suppose that unemployment is initially at its natural rate, and that the inflation rate is at 12%. The central bank decides that, starting at time t, it will keep the unemployment rate 1% above its natural rate until the inflation rate reaches 2%. Compute the inflation
rate for the periods t, t+1, t+2, …
Answer: b. πt = 11%; πt+1 = 10%; πt+2 = 9%; πt+3 = 8%; πt+4 = 7%, …
c. For how many years the policymaker has to keep the unemployment rate above the natural rate of unemployment? Is your answer consistent with the sacrifice ratio you have found in [a]?
Answer: 10 years; sacrifice ratio=(10 point years of excess unemployment)/(10 percentage point reduction in inflation)=1.
d. Now suppose that individuals know that the central bank wishes to reduce the inflation rate to 2%, but are unsure about the willingness of the central bank in accepting an unemployment rate above the natural rate. Therefore, individuals’ expectations are a weighed average of the 2% inflation target, and previous’ year inflation rate. That is,
1
) 1 ( %
2
t
e
t
, where λ is the weight individuals attribute to the 2% target.
Let λ=0.25. How long it would take until the inflation rate reaches 2%? What is
the sacrifice ratio? Why is the answer different from c?
Answer: πt = 8.5%; πt+1 = 5.875%; πt+2 = 3.906%; πt+3 = 2.430%; πt+4 = 1.322%. Less than
e. Suppose that after one year of the implementation of this disinflation policy,
individuals believe that the central bank is committed to bringing inflation down to 2%. Now their expectations are given by t2 2%. At what year could the central bank let
the unemployment rate return to its natural rate level? What is the sacrifice ratio now? Answer: The central bank can let the unemployment rate return to the natural rate beginning at time t+1. The ex-post sacrifice ratio from this scenario = (1 point year of excess unemployment)/(10 point reduction inflation) = 0.1.
f. Which advice would you give to a central bank interested in reducing the inflation rate exploring the inflation-unemployment trade-off?