Plankton in waters adjacent to the Laje de Santos state marine conservation
park, Brazil: spatio-temporal distribution surveys*
R
esumo
O plâncton marinho costeiro é uma peça
fundamen-tal no funcionamento do ecossistema, conectando os
ambientes pelágico e bentônico em fluxos de mate
-rial e energia. A dinâmica dos organismos
planctô-nicos, ou seja, suas composições e abundâncias no
tempo e espaço, é uma ferramenta importante para
práticas de conservação e manejo. Em quatro
oca-siões entre 2013 e 2015, amostragens discretas de
plâncton foram realizadas em dez pontos em e ao
re-dor do PEMLS, com o objetivo de identificar grupos
importantes e estabelecer protocolos para
monitora-mento a longo prazo. Foram encontrados 90 táxons
zooplanctônicos, sendo copépodes e cladóceros os
grupos dominantes, como esperado. A biomassa,
mortalidade e composição taxonômica do zooplânc
-ton variaram entre os locais e entre as amostragens.
As concentrações de clorofila-a superficial também
variaram espaço-temporalmente e ilustram a
limi-tação de amostragens discretas para algumas das
variáveis testadas. Os resultados sugerem um
pro-tocolo de monitoramento do plâncton do PEMLS
baseado na biomassa e mortalidade do zooplâncton.
Já a biomassa do fitoplâncton pode ser estimada por
análises in vivo de amostras de água do mar e
ima-gens de satélite.
Descritores: Área de Proteção Marinha,
Composi-ção de Plâncton, ConservaComposi-ção, Laje de Santos,
Mo-nitoramento.
Marília Bueno
1, Samantha Fernandes Alberto
2, Renan de Carvalho
3, Tânia Marcia Costa
3,
Áurea Maria Ciotti
4, Ronaldo Adriano Christofoletti
21Universidade Estadual de Campinas - Instituto de Biologia Campinas – SP - 13083970 – Brazil
2Universidade Federal de São Paulo - Instituto do Mar
(Rua Dr. Carvalho de Mendonça, 144 – Santos – SP – 11010-700 –Brazil 3Universidade Estadual Paulista - Instituto de Biociências,
(Campus do Litoral Paulista - São Vicente – SP - 11380-972- Brazil 4Centro de Biologia Marinha da Universidade de São Paulo
(Rodovia Manoel Hipólito do Rego, Km 131,5, São Sebastião – SP - 11600-000 – Brazil)
**Corresponding author: [email protected]
A
bstRAct
The coastal marine plankton plays a major role in
ecosystem functioning by linking pelagic and
ben-thonic environments through energy fluxes. Under
-standing the dynamic of planktonic organisms is also
crucial for conservation and management purposes.
Plankton was sampled at ten sites in the waters of
the PEMLS and the adjacent area, on four different
occasions through 2013 and 2015 in order to
iden-tify key planktonic groups and protocols for
long-term monitoring. Ninety taxa of zooplanktonic or
-ganisms were found with holoplanktonic copepods
and cladocerans dominating samples. Zooplankton
biomass, mortality and taxonomic composition var
-ied both in space and time. Surface chlorophyll-a
concentrations varied spatio-temporally. A protocol
for monitoring the plankton of the waters in and
ad-jacent to the PEMLS is suggested based on biomass
and mortality of zooplankton and biomass of
phyto-plankton using periodically in situ calibrated ocean
color satellite imagery.
DESCRIPTORS: Marine Protected Area,
Plank-ton Composition, Conservation, Laje de Santos,
Monitoring.
Received: June 22, 2016 Approved: August 19, 2017
INTRODUCTION
Marine Protected Areas (MPAs) are important conser-vational tools for maintaining marine ecosystems, which are being crescent altered by human impacts. The ultimate goal in designing and implementing MPAs is to create a network of protected areas that are connected through the active and passive dispersal of the organisms inhabiting those areas (GRORUD-COLVERT et al., 2014). Planktonic communities can affect biogeochemical cycles and the coupling of the benthic-pelagic system (KAMBURSKA; FONDA-UMANI, 2009). Changes in abundance and or composition of plankton (i.e., their dynamics) will im-pact pelagic production and affect the material and energy fluxes to nektonic and benthonic species (LESLIE et al., 2005; ROOHI et al., 2010). In addition, the drift of plank-tonic larvae may supply invasive species to both benthic and pelagic systems (WONHAM et al., 2001; OLENINA et al., 2010). Plankton is, therefore, a fundamental model group for multidisciplinary projects on ecosystem func-tioning, with important implications for the management and conservation of marine habitats. Recently, the scien-tific community started using whole plankton approaches to better describe temporal change in pelagic systems (e.g. ROMAGNAN et. al, 2015). Nonetheless, it is necessary to define key species and groups for a given environment. Plankton communities are important to a better under-stand of bioinvasion, the benthic-pelagic coupling and the influence on benthic communities, as environmental bioin -dicators and for fisheries resources from local to regional scales. Previous oceanographic studies undertaken on the southeastern Brazilian coast have provided some infor-mation leading to an initial understanding of plankton by explaining circulation patterns and water mass distribution (MIRANDA; CASTRO-FILHO, 1989). Some studies have focused on how oceanographic processes can affect the pelagic food web through distribution patterns, composi-tion and abundance of phytoplankton (BRANDINI, 1988), zooplankton (LOPES et al., 2006) and fishes (ANSANO et al., 1991; KATSURAGAWA; MATSUURA, 1992; KATSURAGAWA; EKAU, 2003), showing that physi-cal oceanic features are responsible for structuring pelagic and benthonic communities. This region is affected by cold fronts, meteorological systems that change the physical forcings, wave height and larval transport on scales varying from days to weeks (MAZZUCO et al., 2015).
The understanding of plankton community and dy-namics is a valuable tool for a link among scientific
knowledge, management and conservation. Here, a pre-liminary multidisciplinar observation was undertaken in the Laje de Santos Marine State Park (PEMLS) region, located in the southeastern Brazilian coast to aid on the design of future protocols and observations for improv-ing the management and conservation of the park. The PEMLS is located near the port of Santos, the biggest in South America and which thus plays a central role in propagating bioinvasion. Despite the economic, social and environmental importance of this region, the biodiversity and spatial-temporal planktonic dynamic is still poorly known, as studies on the plankton of this region focused on specific taxons (e.g. MATSUURA et al., 1980, LUIZ et al., 2009). There are no systematic studies on plankton composition and dynamics in the PEMLS providing bio-logical data for investigation into the link between plank-ton and the benthic, pelagic, physical or chemical environ-ments, nor that serve to support management decisions. In this study, we sampled the plankton in the waters in and adjacent to the PEMLS on four different occasions in order to identify key groups and protocols for long-term monitoring. We intend to present a first set of data regard-ing composition, mortality, biomass of zooplankton and composition and biomass of phytoplankton such as will help managers and analysts to create standard conserva-tion protocols.
MATERIAL AND METHODS
Study area
Sampling
Four sampling cruises were conducted during spring/2013, summer/2014, winter/2014 and sum-mer/2015 at 10 sites in waters both inside and adjacent to the PEMLS. For zooplankton samples for density and di-versity, three horizontal plankton tows were run at the sur-face and the bottom for each area, during 3 minutes using a 200μm-mesh net with an attached flowmeter (Sea-gear Corporation, model MF315). Samples were preserved in alcohol 70% and aliquots (1/8) were analyzed under the stereomicroscope. Zooplankton was identified to the low-est taxonomic level. Zooplankton density was calculated based on filtered sea water volume during tows.
Zooplankton total biomass and mortality were investi-gated from qualitative vertical tows with 3 tows per site for
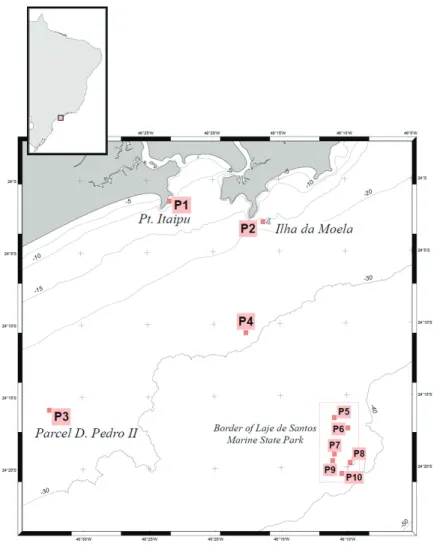
Figure 1.Map of the study area. Sites 1 to 10 are highlighted.
each variable. Total zooplankton biomass was evaluated by sample volume displacement after 48h of decantation. Mortality was estimated by adding 1.5 ml of neutral red per 1L of concentrated zooplankton sample. Neutral red is a vital stain that stains bright red the live zooplankton whereas dead ones are unstained. Samples were stained for 15 min and preserved in formalin 4% in the fridge.
Phytoplanktonic biomass was estimated by collect-ing water at the surface, mid water and bottom uscollect-ing Van Dorn bottles at the 10 sites in waters in and adjacent to the PEMLS, with three replicates at each site. Two repli-cates were used for in vivo fluorescence analyses, the other
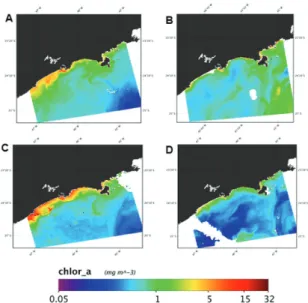
Spatial distribution of surface chlorophyll-a was inves-tigated with ocean color images derived from the MODIS/ Aqua sensor and ocean color algorithm OC3 (O’REILLY et al., 1998). Images from October 10, 2013; January 28, 2014; June 30, 2014 and January 17, 2015 were processed for level zero (L0) to level L2, using SEADAS version 7 and the atmospheric correction MUMM proposed by RUDDICK et al. (2000). The absolute chlorophyll values observed in the images should not be considered quantita-tively (see CARVALHO et al., 2014) but help illustrate the large spatial variability of phytoplankton biomass in the region at a given time. It is important to keep in mind that these images are snap shots of minutes when the satellites pass over a given area.
In addition, phytoplankton diversity for organisms larger than 20 µm was evaluated from sites 7, 8 and 10 of spring/2013 through vertical tows with 20 μm mesh size. Total filtered volume was estimated from net mouth area and tow depth. Organisms were counted and identified to the lowest taxonomic level under an Olympus (mod. CKX41) inverted microscope. Harmful species were identified using the UNESCO Taxonomic Reference List (http://www.marinespecies.org/hab/index.php). Uthermol chambers were used to settle 2 ml of sample and cells were counted under an inverted microscope up to 400 individu-als to normalize the occurrence of species.
Statistical analyses
Zooplankton density, biomass and mortality data were analyzed according to a two-way analysis of variance with factors “time” (fixed, 4 levels: spring/2013, summer/2014, winter/2014 and summer/2015) and “site” (fixed, sites 1 to 10). Depth was not considered for these analyses, sum-ming up 6 replicates for each factor combination. Data were transformed to natural log of (x+1) when homosce-dasticity was not achieved. A posteriori comparisons were run using the SNK (Student–Newman–Keuls) test.
A PERMANOVA was run to investigate zooplankton composition using the same factors described above. The Bray-Curtis distance after 999 permutations was used. The taxonomic level used was class, since it was highly repre -sented in our samples (16 classes). Classes found in only one sample (Tentaculata and Crinoidea) were removed from the analyses. The SIMPER test was used to detect the main classes underlying the formation of clusters and data were plotted on an nMDS. Box plots were used to show phytoplankton the biomass variation on each cruise.
RESULTS
Zooplankton
Zooplankton biomass and mortality varied spatial and temporally (Table 1). Biomass was lowest in spring/2013 and highest in summer/2015. Considering the spatial varia-tion within the area covered by each cruise, no variavaria-tion in biomass was observed among sites in spring/2013 and winter/2014. During the summer/2014, the highest values of biomass were observed at sites 5 and 8 and during sum-mer/2015, the lowest value was obtained at site 3 (SNK test, p < 0.05). Large temporal variation in biomass of zoo-plankton was detected in each site (Figure 2). Mortality was highest on both summer periods (2014 and 2015) with simi-lar patterns among sites. Lower mortality values were de-tected in spring/2013 and winter/2014 (SNK test, p < 0.05). Similar to biomass fluctuation, mortality of zooplankton also varied through time within sampling sites (Figure 2).
We found 90 taxa of zooplanktonic organisms belong-ing to Phyla Annelida, Arthropoda, Briozoa, Chaetognatha, Chordata, Cnidaria, Ctenophora, Echinodermata, Mollusca, Nematoda, Heliozoa, Ciliophora, Myzozoa, Radiozoa and Foraminifera (Appendix 1). In general, all development stages, including eggs, larvae and adults, were found. The holoplanktonic copepods and cladocer-ans dominated all samples.
Figure 2. - Mean biomass and mortality of zooplankton at sites du-ring the sampling events. Error bars represent standard error.
Table 1. ANOVA results for zooplankton biomass and mortality during the four cruises at the 10 sampling sites in or near the PEMLS. Significant values in bold.
Source of variation Biomass Mortality
M.S. d.f. F p M.S. d.f. F p
Cruise 2619.7 3 37.66 <0.001 17506.8 3 54.70 <0.001
Site 201.5 9 2.90 0.005 1326.1 9 4.14 <0.001
Cr x Si 135.4 27 1.95 0.012 876.2 27 2.74 <0.001
Error 69.6 80 320.1 80
C = 0.1776; p < 0.05 C = 0.2509; p < 0.01
Table 2. ANOVA results for copepods and Penilia avirostris densities during the four cruises at the 10 sampling sites in or near the PEMLS. Significant values in bold.
Source of variation Copepods
Penilia avirostris
M.S. d.f. F p M.S. d.f. F p
Cruise 151.20 3 94.47 <0.001 156.77 3 146.56 <0.001
Site 4.83 9 3.02 0.002 9.47 9 8.85 <0.001
Cr x Si 9.84 27 6.15 <0.001 9.15 27 8.55 <0.001
Error 1.60 200 1.07 200
C = 0.1035; p < 0.05 C = 0.1223; p < 0.01 2). They occurred in all areas during the four sampling events,
but the densities observed spring/2013 and summer/2014 were lower than those in winter/2014 and summer/2015. No differences were found among sites in spring/2013, but great variability in copepod density was detected during the other sampling events (Figure 3, (SNK test, p < 0.05).
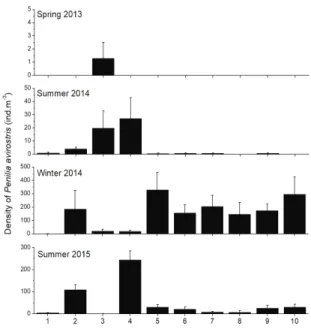
Cladocerans occurred on all the cruises with relative abundances corresponding to 5, 5, 19 and 21% for the four sampling events, respectively. The most abundant species was Penilia avirostris (Crustacea: Branchiopoda), with varying spatial and temporal distribution (Table 2). The highest density of P. avirostris occurred in winter/2014 and the lowest during spring/2013 (SNK test, p < 0.05). Summer periods showed higher densities in sites outside the PEMLS (sites 1 to 4) while lower values were ob-served in the remaining sites (5 to 10). During the winter of 2014, when higher densities of P. avirostris were de-tected, these cladocerans dominated sites in the PELMS (sites 5 to 10; Figure 4).
A boom of heliozoans was observed in summer/2014, corresponding to 55% of sampled planktonic organisms concentrated at sites 6, 7, 9 and 10. They were absent in spring/2013 and summer/2015 and appeared in low rela-tive abundance (0.6%) in winter/2014 (Appendix 1).
Appendix 1. Relative abundance of zooplankton sampled at the 10 sites in the adjacent waters to the PEMLS on the four sampling events (C1: spring/2013; C2: summer/2014; C3: winter/2014 and C4: summer/2015).
% of individuals
Kingdom Phylum Class Order Family Genus Species C1 C2 C3 C4
A
nim
ali
a
Annelida
0,052 0,000 0,000 0,035
Polychaeta
0,001 0,000 0,002 0,000
Syllidae 0,001 0,000 0,000 0,000
Larva 0,002 0,044 0,011 0,000
Branchiopoda
1,122 0,000 0,189 0,000
Podonidae Pseudevadne P. tergestina 3,692 0,000 0,000 0,000
Diplostraca Pleopis 0,000 0,029 8,896 2,295
(Cladocera) P. polyphaemoides 0,000 0,023 0,034 0,000
Daphniidae Daphnia 0,556 0,202 0,000 0,000
Sididae Penilia
P. avirostris 0,008 0,000 0,000 0,000
0,000 5,230 10,039 18,789
Malacostraca
Amphipoda
0,850 0,000 0,000 0,000
Hyperiidae Hyperia 0,000 0,000 0,065 0,024
Caprellidae 0,000 0,009 0,000 0,000
Gammaridae Gammarus 0,000 0,000 0,036 0,016
Isopoda 0,008 0,000 0,000 0,004
Decapoda (Anomura)
Larva 0,000 0,000 0,005 0,000
Porcellanidae Larva 0,029 0,000 0,005 0,000
Decapoda Luciferidae Lucifer 0,000 0,085 0,009 0,000
L. typus 0,000 0,167 0,138 0,016
Mysida Mysidae 0,065 0,003 0,000 0,035
40,183 13,012 3,524 1,945
Calanoida 37,330 20,674 38,554 60,248
Maxillopoda
Poecilos-tomatoida Corycaeidae Corycaeus 0,000 0,325 7,466 4,633
(Copepoda) Clausidiidae Hemicyclops 0,000 0,000 0,144 0,000
Harpacti-coida 0,029 0,000 1,141 0,531
Peltidiidae Clytemnestra C. scutellata 0,573 0,000 0,000 0,000
Cyclopoida 1,273 0,000 0,092 0,000
Maxillopoda Nauplii 0,0162 0 0,568 0,110
(Cirripedia) Cypris 0,016 0,067 0,142 0,483
Ostracoda 0,023 1,057 0,086 0,000
Halocyprida 0,006 0,000 0,000 0,000
Zoea 0,296 0,727 0,336 0,725
Nauplii 3,171 0,094 0,916 0,534
Other larvae 0,307 0,003 0,000 0,008
Egg 0,787 0,164 0,000 0,000
Briozoa Cyphonauta 0,009 0,000 0,000 0,000
Kingdom Phylum Class Order Family Genus Species C1 C2 C3 C4
A
nim
ali
a
Chordata (Tunicata)
Appendicularia 1,356 0,000 0,000 0,000
Oikopleuridae Oikopleura 0,518 0,006 12,470 3,886
Thaliacea Doliolida Doliolidae Doliolum 0,000 0,012 0,000 0,000
Salpida Salpidae 0,004 0,998 0,000 0,024
Thalia T. democratica 0,000 0,006 4,995 1,128
Chordata (Cephalochordata) Larva 0,012 0,000 0,000 0,000
Chordata
(Vertebrata) Pisces
Egg 1,225 0,140 0,147 1,513
Larva 0,006 0,064 0,018 0,071
Juvenile 0,000 0,000 0,002 0,000
Cnidaria 0,001 0,023 0,000 0,000
Hydrozoa
0,008 0,530 0,002 0,000
Abylidae
0,002 0,009 0,025 0,000
Abylopsis A. eschscholtzi 0,000 0,000 0,041 0,012
Bassia B. bassensis 0,000 0,000 0,032 0,000
Sipho-nophorae 0,002 0,000 0,007 0,000
(Calycopho-rae)
Diphyidae
0,000 0,000 0,009 0,000
Chelophyes 0,000 0,000 0,005 0,000 C. appendiculata 0,005 0,000 0,523 0,151
Trachyme-dusae
Rhopalone-matidae
0,000 0,000 0,047 0,000
Aglaura A. hemistoma 0,000 0,000 0,020 0,000
Geryoniidae Liriope L. tetraphylla 0,000 0,000 1,578 0,035
Leptothecata 0,000 0,307 0,000 0,004
Phialellidae 0,001 0,000 0,000 0,000
Narcome-dusae Aeginidae Solmundella S. bitentaculata 0,000 0,000 0,016 0,000
Anthoathe-cata
Hydractinii-dae Podocoryne 0,000 0,000 0,235 0,000
Cladonema-tidae 0,000 0,000 0,023 0,000
Actinula larva 0,030 0,000 0,000 0,000
Ctenophora Tentaculata Lobata Bolinopsidae Mnemiopsis 0,000 0,000 0,009 0,000
Echinodermata
Crinoidea 0,000 0,000 0,005 0,000
Asteroidea Bipinnaria larva 0,000 0,000 0,000 0,020
Pluteus larva 0,140 0,000 0,000 0,024
Mollusca
Bivalvia 0,073 0,088 0,271 0,397
Mytilidae 1,263 0,000 0,000 0,000
Gastropoda
0,000 0,243 0,000 0,000
0,002 0,000 0,000 0,000
Thecoso-mata
Creseidae Creseis 0,000 0,009 0,000 0,000
Creseidae Creseis C. acicula 0,000 0,000 1,610 0,063
Limacinidae Limacina 0,000 0,006 0,016 0,000
Caenogas-tropoda Janthinidae 0,000 0,000 0,007 0,020
Pteropoda 0,001 0,000 0,000 0,000
Phytoplankton
The survey during spring/2013 on sites 7, 8 and 10 for organisms larger than 20 µm, reveled a total of 139 phy-toplanktonic taxa were Diatomacea dominated samples (Appendix 2). In general, the abundance of phytoplankton
Kingdom Phylum Class Order Family Genus Species C1 C2 C3 C4
Nematoda 0,000 0,006 0,000 0,000
Chromista
Heliozoa 0,000 54,569 0,571 0,000
Ciliophora Oligotrichea
Chore-otrichida Strobilidiidae Strobilidium 0,000 0,000 0,000 0,020
Tintinnina 2,387 0,000 0,000 0,000
Chromista
Ciliophora
Oligohymeno-phorea Sessilida Zoothamniidae Zoothamnium 0,000 0,003 0,007 0,004
Myzozoa (Dinoflagellata)
0,494 0,000 0,000 0,000
Dinophyceae
Gonyaula-cales Ceratiaceae Ceratium 0,066 0,000 0,000 0,000
Radiozoa Acantharia 0,002 0,000 0,005 0,000
(Rhizaria) Foraminifera
0,172 0,015 0,000 0,000
Globoth-alamea Rotaliida Globigerinidae Globigerina 0,000 0,000 0,014 0,000
Others 0,051 0,398 0,049 0,000
Figure 3. Mean density of copepods at sites during the sampling events. Error bars represent standard error.
Figure 4. Mean density of Penilia avirostris at sites during the four sampling events. Error bars represent standard error.
cells per sample volume was higher at sites 7 (n = 597) and 10 (n = 412) than at site 8 (n = 148). Coscinodiscos
was dominant at site 7, while at site 8 Coscinodiscos and
Taxa 7 8 10
Leptocylindrus minimus 97
Lioloma pacificum 161 33
Meuniera membranaceae 661 363 24
Navicula cf septentrionalis 97
Nitzschia cf lorenziana 16 16
Nitzschia membranaceae 16 16
Odontela sinensis 32
Palmeria sp01 32
Paralia sulcata 32 148
Pennate ni01 32
Pleurosigma sp01 32 49
Pleurosigma sp02 33
Pseudo-nitzschia sp01 49
Pseudoeunotia doliolos 121
Rhizosolenia cf fragilissima 115
Rhizosolenia cf pugens 115
Rhizosolenia cf setigera 81
Rhizosolenia robusta 48 115
Rhizosolenia sp01 82
Rhizosolenia sp02 24
Stephanopyxis turris 16
Thalassionema nitzschoides 419 412 146
Diatom
Thalassionema sp01 32
Thalassionema sp02 32
Thalassionema sp03 32
Thalassionemataceae 16
Thalassiosira cf deliculata 16
Thalassiosira concaviuscula 677 379
Thalassiosira rotula 24
Thalassiosira sp02 113 428 315
Thalassiosira sp03 532 66 170
Thalassiosira sp04 16
Thalassiothrix frauenfeldi 49
Dinoflagellate
Alexandrium cf fraterculus 267
Alexandrium sp01 113
Alexandrium sp02 49
Ceratium azoricum 97 33
Ceratium cf horridum 33
Ceratium cf vultur 16
Ceratium furca 355 82 146
Ceratium fusus 16 73
Ceratium horridum 65 73
Ceratium inflatum 32
Ceratium macroceros 16
Ceratium sp01 48
Ceratium teres 16
Ceratium trichocercos 32
Ceratium tripos 194 33
cf Gambierdiscus toxicus 24
cf Prorocentrum 01 32
cf Prorocentrum 02 16
cf Pyrophacus 01 81
Appendix 2. Abundance of phytoplankton (cells.L-1) sampled at the sites 7, 8 and 10 in the adjacent waters to the PEMLS in the spring of 2013.
Taxa 7 8 10
Cyanobacteria
Anabaena sp01 774
Trichodesmium sp01 6524
Coccolithophore
Coccolithophore ni 16
Diatoms
Actinoptychos senarius 32
Asteromphalus sp01 16
Bacteriastrum delicatulum 346
Bacteriastrum hyalinum 165
Bacteriastrum sp01 48
cf Grammatophora 01 16
cf Pleurosigma 01 48
cf Pseudo-nitzschia 01 66
cf Schröderella 01 48
cf Skeletonema 01 330
cf Thalassiosira 01 1097
cf Thalassiosira 01 315
Chaetoceros cf decipiens 214
Chaetoceros cf didymus 1219
Chaetoceros coarctatus 49
Chaetoceros messanensis 791
Chaetoceros sp01 16 82
Chaetoceros sp02 49
Chaetoceros sp03 33
Climacodium frauenfeldianum 16
Coscinodiscus cf alboranii 24
Coscinodiscus cf centralis 33
Coscinodiscus cf concinnus 24
Coscinodiscus gigas 161 16
Coscinodiscus sp01 5612 1203 388
Cyclotella sp01 16
Delphineis sp01 1677 115
Detonula sp01 274 49
Diploneis sp01 65 99 24
Diatom
Fragilariopsis doliolos 919 313
Grammatophora cf adriatica 65
Grammatophora sp01 97
Guinardia flacida 32 132
Guinardia sp01 16
Guinardia striata 214
Haslea sp01 16 24
Hemiaulus hauckii 16
Hemiaulus membranaceae 355 66
Hemiaulus sinensis 145 16 243
Hemiaulus sp01 16
Hemidiscus cuneiformis 24
Taxa 7 8 10
cf Triposolenia 01 24
Cyst 161
Dinophysis acuminata 16
Dinophysis caudata 48 49 73
Dinoflagellate
Gonyaulax sp01 49
Gonyaulax sp02 24
Gymnodiniales 32 16
Ornithocercos sp01 16
Peridiniales 226 33
Peridinium cf quarnerense 121
Peridinium cf steinii 210 16 170
Phalacroma rotundatum 49
Podolampas bipes 24
Podolampas sp01 81 33
Prorocentrum cf balticum 113 33
Prorocentrum cf ermaginatum 16
Prorocentrum cf magnum 16
Prorocentrum cf minimum 16
Prorocentrum compressum 403 33 146
Prorocentrum micans 49
Prorocentrum sp01 16
Protoperidinium cf oblongum 113
Protoperidinium cf obtusum 16
Protoperidinium cf pentagonum 65
Protoperidinium crassipens 48
Protoperidinium divergens 16 73
Protoperidinium grande 24
Protoperidinium oblongum 33
Protoperidinium ovatum 24
Protoperidinium pentagonum 16
Protoperidinium steinii 145
Protoperidnium sp01 16
Pyrocystis lunula 48 16 24
Pyrophacus sp01 49
Scrippsiella cf trochoidea 49
Protozooplankton
Ebria sp01 24
Hermesinium sp01 258 99 315
Vorticella sp01 274
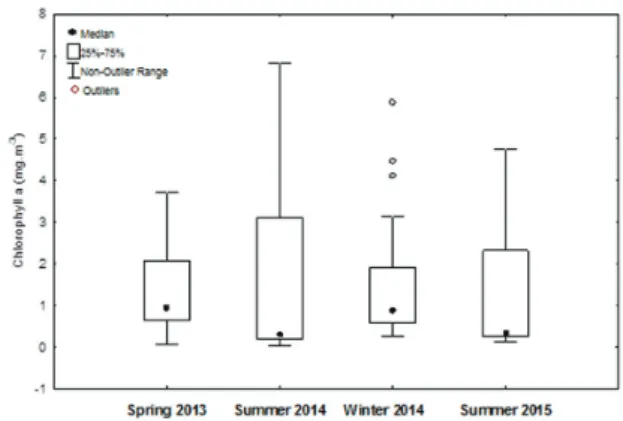
Phytoplanktonic biomass varied among sampling events and the highest variation was observed during summer/2014 (Figure 5). The surface chlorophyll-a con-centration attained higher values close to the shore, and the concentration decreased with distance from the coast (Figure 6), as expected. We observed relatively high val-ues of chlorophyll-a (above 5mg.m-3) in October 2013 and June 2014, coinciding with the first (spring/2013) and the third (winter/2014) sampling events, respectively.
Figure 5. Variation in chlorophyll a from phytoplankton of the PEMLS during the sampling events.
DISCUSSION
Plankton in the PEMLS showed high diversity and spatio-temporal variability. Spatially, much variation was observed in biomass and mortality rates and no local in-terferences seem to affect these variables. Considering the importance of a wide monitoring programme for a MPA with a protocol with fast results in case of environmental impact, the biomass and mortality of zooplankton served as good indicators for monitoring temporal plankton dy-namics, due to the easy feasibility and temporal changes being higher during the summer sampling events (2014 and 2015). Although it is unclear which drivers would be influencing such variation, we can notice that the higher variability in the summer occurred at the same time of the highest variability in the phytoplanktonic biomass. Here we present initial data for this MPA, and it is important to indicate as a support for the design of a specific long term programme to understand the dynamics and integration of the planktonic system and environmental drivers factors.
important indicator of physical conditions in areas in and adjacent to the PEMLS. Cladocerans distribution, specifi-cally, can indicate the role of water masses (as stated, e.g., by MUXAGATA; MONTÚ, 1999) as important factors in zooplankton distribution for management questions. Among the cladocerans, Penilia avirostris dominated in the samples. Peaks during summer and autumn have been reported for this species in temperate areas (CALBET et al., 2001). However, we found higher densities during the winter/2014. As the main components of zooplankton, Copepods and Cladocerans are potential indicators for the zooplankton dynamics and the focus on their population dynamics will be an important tool for monitoring the pe-lagic system at this region.
Figure 6. Spatial distribution of surface chlorophyll in the inner and middle continental shelf off São Paulo State (A) October 10, 2013; (B) January 28, 2014; (C) June 30, 2014 and (D) January 17, 2015.
However, it is important to highlight the importance of the less abundant groups and those with larger variability. In this case, such groups would indicate changes in the pelagic system that deserves attention of the management of the area. Here, we presented initial data to start to un-derstand such dynamics. The bloom observed for helio-zoans may be explained by the existence of an intermit -tent planktonic stage for these organisms, forming blooms during the hotter months (GIERE, 2009). Their restricted spatial and temporal distributions, encompassing just four sites during one sampling event (summer/2014), reinforce
the bloom explanation. A new bloom was expected in the following summer (2015), but we did not observe it. Based on the first observations, it is indicated for the further long term programme to monitors this group in order to evalu-ated their link with climatic drivers or also, changes in food web dynamics.
There is great spatial heterogeneity in the pelagic en-vironment, seeing that organisms are patchily distributed (VALIELA, 1995). Patches are formed by both physical processes in the water column, such as Langmuir circula-tion cells or internal waves (SHANKS, 1995), and biologi-cal processes like synchronized larval release (EPIFANIO, 2003; STEVENS, 2003; PETRONE et al., 2005), vertical migration, predator avoidance, feeding and reproduction (FOLT; BURNS, 1999). In this way, even frequently rep-licated sampling may not answer specific questions, but general patterns can be found.
Marine plankton has been suggested as a key to iden-tifying changes in marine ecosystems, especially those related to climate issues (HAYS et al., 2005). We pres-ent here specific data on the spatio-temporal dynamics of plankton in this MPA as a preliminary basis for the draw-ing up of plans for the monitordraw-ing and management of this area. Based on this first evaluation, we suggest a simple and quick protocol for the monitoring based on the bio-mass and mortality of zooplankton and the biobio-mass of phytoplankton using periodically in situ calibrated ocean color satellite imagery.
ACKNOWLEDGEMENTS
We thank Carolina C.C. Barbosa, Gabriel T. Tavares, André L. Pardal-Souza, Gabriel I. Mendes and André F. Bucci for their helping during field and laboratory work. A.M. Ciotti, R.A. Christofoletti and T.M. Costa were sup-ported by The Brazilian Research Council (CNPq) and PETROBRAS (Mapelms Monitoramento ambiental do Parque Marinho da Laje de Santos).
REFERENCES
ANSANO, K.; MATSUURA, Y.; KATURAGAWA, M. Daily egg production of the Brazilian Anchovy, Engraulis anchoita.
Bull. Fac. Bioresources, Mie Univ., n. 6, p. 47-55, 1991. BRANDINI, F. P. Composição e distribuição do fitoplâncton da
região Sudeste do Brasil e suas relações com as massas de água (Operação Sueste – julho/agosto 1982). Ciência e Cul-tura, v. 40, n. 4, p. 334-341, 1988.
MAZZUCO, A. C. A.; CHRISTOFOLETTI, R. A.; PINEDA, J.; STARCZAK, V. R.; CIOTTI, A. M. Temporal variation in intertidal community recruitment and its relationships to physical forcings, chlorophyll-a concentration and sea sur-face temperature. Mar. Biol., v. 162, n. 9, p. 1705-1725, 2015. MIRANDA, L. B.; CASTRO-FILHO, B. M. Estudos oceanográ-ficos na região sudeste nas três últimas décadas e projeções futuras. Boletim IG-USP, n. 06, p. 23-31, 1989.
MUXAGATA, E.; MONTÚ, M. A. Os cladoceros da plataforma continetal sudeste brasileira: Distribuição, densidade e bio-massa (Inverno de 1995). Nauplius, v. 7, p. 151-172, 1999. O’REILLY, J. E.; MARITORENA, S.; MITCHELL, B. G.;
SIE-GEL, D. A.; CARDER, K. L.; GARVER, S. A.; KAHRU, M.; MCCLAIN, C. Ocean color chlorophyll algorithms for SeaWiFS, J. Geophys. Res., v. 103, p .24937–24953, 1998.
OLENINA, I.; WASMUND, N.; HAJDU, S.; JURGENSONE, I.; GROMISZ, S.; KOWNACKA, J.; TOMING, K.; VAICIUTE, D.; OLENIN, S. Assessing impacts of invasive phytoplank-ton: The Baltic Sea case. Mar. Poll. Bull., v. 60, n. 10, p. 1691-1700, 2010.
PETRONE, C.; JANCAITIS, L.B.; JONES, M. B.; NATUNE-WICZ, C. C.; TILBURG, C. E.; EPIFANIO, C. E. Dynamics of larval patches: spatial distribution of fiddler crab larvae in Delaware Bay and adjacent waters. Mar. Ecol. Progr. Ser., v. 293, p. 177-190, 2005.
RESGALLA JR., C. The holoplankton of the Santa Catarina coast, southern Brazil. An. Acad. Bras. Cienc., v. 83, n. 2, p. 575-588, 2011.
ROMAGNAN, J.B.; LEGENDRE, L.; GUIDI, L.; JAMET, J.L.; JAMET, D.; MOUSSEAU, L.; PEDROTTI, M.L.; PICH-ERAL, M.; GORSKY, G.; SARDET, C.; STEMMANN, L. Comprehensive model of annual plankton succession based on the whole-plankton time series approach. PLoS ONE.
10(3): e0119219, 2015.
ROOHI, A.; KIDEYS, A. E.; SAJJADI, A.; HASHEMIAN, A.; POURGHOLAM, R.; FAZLI, H.; KHANARI, A. G.; EKER-DEVELI, E. Changes in biodiversity of phytoplankton, zoo-plankton, fishes and macrobenthos in the Southern Caspian Sea after the invasion of the ctenophore Mnemiopsis leidyi.
Biol. Invasions, v. 12, p. 2343-2361, 2010.
RUDDICK, K.G.; OVIDIO, F.; RIJKEBOER, M. Atmospheric correction of SeaWiFS imagery for turbid coastal and inland waters. Appl. Optics, v. 39, p. 897912, 2000.
SHANKS, A. L. Mechanisms of cross-shelf dispersal of larval in-vertebrates and fish. In: McEdward, L. Ecology of Marine In-vertebrate Larvae. Boca Raton: CRC Press, p. 323-359, 1995. STEVENS, B. G. Timing of aggregation and larval release by
Tanner crabs, Chionoecetes bairdi, in relation to tidal current patterns. Fish. Res., v. 65, p. 201–216, 2003.
VALIELA, I. Spatial structure: Patchiness. In: Marine Ecologi-cal Processes. 2 Ed. New York: Springer-Verlag, p. 325-347, 1995.
WELSCHMEYER, N. A. Fluorometric analysis of chlorophyll a in the presence of chlorophyll b and pheopigments. Limnol. Oceanogr., v. 39, n. 8, p. 1985-1992, 1994.
WONHAM, M. J.; WALTON, W. C.; RUIZ, G. M.; FRESE, A. M.; GALIL, B. S. Going to the source: role of the invasion pathway in determining potential invaders. Mar. Ecol. Progr. Ser., v. 215, p. 1-12, 2001.
Mediterranean waters: the importance of the smaller size fractions. J. Plankton Res., v. 23, n. 3, p. 319–331, 2001.
CARVALHO, M.; CIOTTI, A. M.; GIANESELLA, S. M. F.; CORRÊA, F. M. P. S.; PERINOTTO, R. R. C. Bio-Optical Properties of the Inner Continental Shelf off Santos Estuarine System, Southeastern Brazil, and their Implications for Ocean Color Algorithm Performance. Braz. J. Oceanogr., v. 62, n. 2, p. 71-87, 2014.
DOMINGOS-NUNES, R.; RESGALLA JR., C. The zooplankton of Santa Catarina continental shelf in southern Brazil with emphasis on Copepoda and Cladocera and their relationship with physical coastal processes. Lat. Am. J. Aquat. Res., v. 40, n. 4, p. 893-913, 2012.
EPIFANIO, C. E. Spawning behavior and larval ecology: a brief summary. Bull. Mar. Sci., v. 72, n. 2, p. 325-330, 2003.
FOLT, C. L.; BURNS, C.W. Biological drivers of zooplankton patchiness. Trends Ecol. Evol., v. 14, n. 8, p. 300-305, 1999.
GIERE, O. Meiobenthology: the microscopic motile fauna of aquatic sediments. Springer-Verlag Berlin Heidelberg, 2nd. Ed., 2009.
GRORUD-COLVERT, K.; CLAUDET, J.; TISSOT, B. N.; CA-SELLE, J. E.; CARR, M. H.; DAY, J. C.; FRIEDLANDER, A. M.; LESTER, S. E.; DE LOMA, T. L.; MALONE, D.; WALSH, W. J. Marine Protected Area Networks: assessing whether the whole is greater than the sum of its parts. PLoS ONE, v. 9, n. 8, p. e102298, 2014.
HAYS, G. C.; RICHARDSON, A. J.; ROBINSON, C. Climate change and marine plankton. Trends Ecol. Evol., v. 20, n. 6, p. 337-344, 2005.
KAMBURSKA, L.; FONDA-UMANI, S. From seasonal to decadal inter-annual variability of mesozooplankton biomass in the northern Adriatic Sea (Gulf of Trieste). J. Marine Syst., v. 78, n. 4, p. 490-504, 2009.
KATSURAGAWA, M.; EKAU, W. Distribution, growth and mortality of young rough scad, Trachurus lathami, in the south-eastern Brazilian Bight. J. Appl. Ichtyol., v. 19, p. 21-28, 2003.
KATSURAGAWA, M.; MATSUURA, Y. Distribution and abun-dance of carangid larvae in the southeastern Brazilian Bight during 1975-1981. Bolm. Inst. Oceanogr. S. Paulo, v. 40, n. 1/2, p. 55-78, 1992.
LESLIE, H. M.; BRECK, E. N.; CHAN, F.; LUBCHENCO, J.; MENGE, B. A. Barnacle reproductive hotspots linked to nearshore ocean conditions.Proc. Natl. Acad. Sci. USA, v. 102, p. 10534-10539, 2005.
LOPES, R. M., KATSURAGAWA, M., DIAS, J. F., MONTÚ, M. A., MUELBERT, J. H., GORRI, C., BRANDINI, F. P. Zoo-plankton and ichthyoZoo-plankton distribution on the southern Brazilian shelf: an overview. Sci. Mar., v. 70, n. 2, p. 189-202, 2006.
LOPES, R. M. Marine zooplankton studies in Brazil - a brief evaluation and perspectives. An. Acad. Bras. Cienc., v. 79, n. 3, p. 369-379, 2007.
LUIZ, O.J.; BALBONI, A.P.; KODJA, G.; ANDRADE, M.; MARUM, H. Seasonal occurrences of Manta birostris
(Chondrichthyes: Mobulidae) in southeastern Brazil.
Ichthyol. Res., v. 56, p. 96-99, 2009.