Currents on the continental shelf adjacent to the Laje de Santos (SP, Brazil)*
A análise de dados correntográficos coletados em
esforços observacionais recentes permitiu a descri
-ção das características hidrodinâmicas da platafor
-ma continental adjacente à Laje de Santos, situada
na parte interna da Plataforma Continental de São
Paulo (PCSP). As correntes nessa região são força
-das em primeira aproximação pelos ventos sinóticos,
apresentando-se como movimentos bidirecionais
quase paralelos às isóbatas em todos os níveis, de
-pendentes da direção dos ventos, mas com predo
-minância daqueles que deixam a isóbata à esquerda.
As correntes de maré nessa parte da PCSP têm mais
energia na direção perpendicular à isóbata, com pre
-dominância das oscilações semidiurnas.
Descritores: Correntes, Plataforma Continental, Laje
de Santos, Plataforma Continental Sudeste.
A
bstrAct
A
bstrAct
Roberto Fioravanti Carelli Fontes
1**, Belmiro Mendes de Castro
21Instituto de Biociências – Universidade Estadual Paulista
(Praça Infante Dom Henrique, s/n - Parque Bitaru - São Vicente - SP - 11330900 – Brazil) 2Instituto Oceanográfico – Universidade de São Paulo
(Praça do Oceanográfico, 191 – Butantã – São Paulo – SP – 05508120 – Brazil)
** Corresponding author: [email protected]
Analysis of current meter data permitted the elabo
-ration of a description of the hydrodynamic charac
-teristics of the continental shelf adjacent to Laje de
Santos, a rocky islet located in the inner part of the
São Paulo Continental Shelf (SPCS). The currents in
the region are mainly driven by the synoptic winds,
presenting bidirectional motions approximately par
-allel to the local isobaths at all levels, depending
on the wind direction but with the predominance of
those that leave the isobaths to the left. The tidal cur
-rents in this sector of the SPCS are more energetic in
the direction perpendicular to the isobaths in com
-parison with the along isobath component and have
the predominance of the semidiurnal oscillations.
Descriptors: Currents, Continental Shelf, Laje de
Santos, Southeast Brazil Continental Shelf.
r
esumo
r
esumo
Received: June 29, 2016 Approved: September 3, 2017
* Reference article of the Project MAPELMS - Environmental Monitoring of the State Marine Park of Laje de Santos
INTRODUCTION
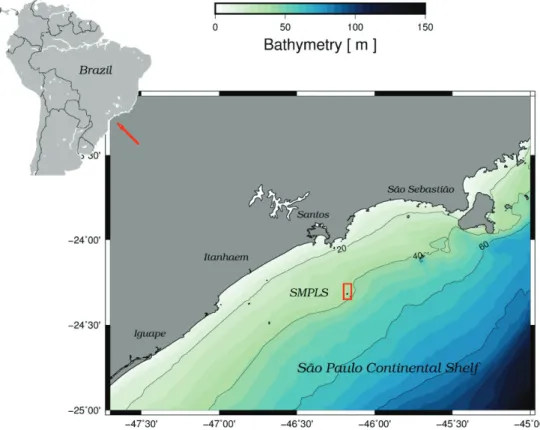
The Lage de Santos (24.36°S, 46.17°W) is a rocky is
-let situated on the São Paulo Continental Shelf (SPCS), near the 35 m isobath, off the municipalities of the Baixada Santista (Figure 1). Due to the importance of this region
to the marine ecosystem, the State Marine Park of Laje de Santos (SMPLS) was created on September 27, 1993 (Decree nº 37.537) to assure the total protection of these ecosystems. The SMPLS covers an area of approximately 50 km2, including not only the Laje de Santos but also
several submerged rock formations.
Figure 1. São Paulo Continental Shelf, highlighting the area of the State Marine Park of Laje de Santos (red rectangle).
Bathymetry expressed in meters
The SPCS is part of the central region of the Southeast Continental Shelf (SECS), which is classified by LODER et al. (1998) as a wide shelf with a shelf-edge western boundary current. In the case of the SECS, the western boundary current is the Brazil Current (BC). The BC flows mainly over the continental slope along the shelf break
BC (CASTRO; MIRANDA, 1998; SOUZA, 2000). On the ICS, even in the absence of large rivers, estuarine discharg
western part of the anticyclonic gyre of the South Atlantic Subtropical High (SASH). These winds drive currents flowing south- southwestwards with the coast to their right.
Weather frontal systems (cold fronts) are the factor primarily responsible for the synoptic variability of the wind field over the SPCS. These systems come from the south of the continent and move to the NW-NE along the SECS, bringing winds that blow from the S-SW towards the N-NE over the SPCS. The SPCS response to these winds is currents that flow north-northeastwards, leaving the coast to the left (DOTTORI; CASTRO, 2009).
On the supra-inertial motion scale, tides on the wide SPCS occur essentially as a co-oscillating response to tides from the adjacent deep sea (PEREIRA et al., 2007). The alignment between the co-phase lines of the more energetic tidal components (semidiurnal) and the coastal lines indicates that tidal currents on the SPCS flow perpen
-dicularly to the isobaths and the coast. However, typical tidal currents on the SPCS have intensities of the order of centimeters per second while currents forced by the wind have intensities of the order of tens of centimeters per second.
Following the regionalization of the SPCS proposed by CASTRO (2014), the SMPLS is situated on the ICS (ICS-SP) mainly during autumn and winter, but can be lo
-cated on the MCS (MCS-SP) during summer and spring. This regionalization is a function of the acting hydro-ther
-modynamic processes and is not associated with geomor
-phological features.
According to studies previously mentioned, the cur -rents in the continental shelf are prevalently parallel to
the coast, bidirectional and mainly driven by seasonal and synoptic winds, leaving the coast to the right in the former case and the left in the latter. Particularly in the SMPLS region, we find strong influences of current alignment due to isobaths distortions. Tidal currents have less kinetic en
-ergy than those generated by the wind and occur mostly
perpendicularly to the coast. The analysis of current series also shows no dynamic influence of the BC in the SMPLS region.
Water masses found in the SMPLS area are a mixture of the already mentioned TW, characterized by high salin
-ity (S > 36), the SACW, characterized by low tempera
-tures (T < 18°C), and the Coastal Water (CW), that typi
-cally presents low salinities (CERDA; CASTRO, 2014; CASTRO, 2014).
Subsurface intrusions of the SACW towards the coast on the SPCS are common in summer and spring. During these seasons, the water mass is located closer to the coast and in contact with the ocean floor, leading to the forma
-tion of an acute seasonal thermocline in the SMPLS re
-gion. During winter and autumn, the SACW moves away from the coast, virtually suppressing the vertical stratifica
-tion of density.
In this study, records from two ADCP moorings at distinct sites in SMPLS aim to explain the variability of local current direction and magnitude, as well as the typi
-cal time s-cales and its relationships with driving forces. The data was collected during the MAPEM-LS project (Environmental Monitoring of State Marine Park of Laje de Santos).
MATERIAL AND METHODS
Two acoustic Döppler current profilers (ADCP) were moored at LS1 and LS2, two different locations in the
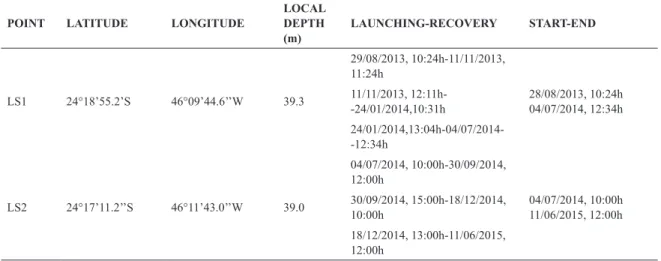
Table 1. Location and duration of the experiments to collect current meter data at the two sampling points, LS1 and LS2
(see Figure 1), of the MAPEM-LS project. Date format: dd/mm/yyyy; hour format: hh:mm.
POINT LATITUDE LONGITUDE
LOCAL DEPTH (m)
LAUNCHING-RECOVERY START-END
LS1 24°18’55.2’S 46°09’44.6’’W 39.3
29/08/2013, 10:24h-11/11/2013, 11:24h
28/08/2013, 10:24h 04/07/2014, 12:34h 11/11/2013,
12:11h--24/01/2014,10:31h
24/01/2014,13:04h-04/07/2014--12:34h
LS2 24°17’11.2’’S 46°11’43.0’’W 39.0
04/07/2014, 10:00h-30/09/2014, 12:00h
04/07/2014, 10:00h 11/06/2015, 12:00h 30/09/2014, 15:00h-18/12/2014,
10:00h
18/12/2014, 13:00h-11/06/2015, 12:00h
After correcting for the magnetic declination, current speed vectors were decomposed in alignment with the lo
-cal reference isobaths, namely -45° and 90°, respectively to LS1 and LS2 moorings. Angles are in degree from North, and plus sign meaning clockwise.
The components of the speed vectors, obtained after the rotation of the coordinated axes, are designated as u
(almost perpendicular to the local isobaths, u > 0 in the
offshore direction) and v (almost parallel to the isobaths, v
> 0 towards the left of u > 0). Hereinafter, the components u and v will be referred to as the perpendicular and paral
-lel components, respectively. It is important to note that the 30 m and 40 m isobaths bend, where moorings were deployed. They have a N-S direction on a small scale. One must notice that LS1 were deployed between the Laje de Santos and a rocky formation (Figure 2). These are dif
A time series of surface winds was provided by NCEP/ DOE Reanalysis-2 (KANAMITSU et al., 2002). These
data have a sampling interval of 6h and original spatial resolution of 2.125°, which was later interpolated to a 0.5° resolution. The location of the NCEP/DOE point used is in Figure 2. The time series of the surface winds was ana
-lyzed from 08/29/2013 to 06/11/2016 and segmented ac
-cording to the length of the time series of the current data obtained at LS1 and LS2. Since the synoptic winds have
a spatial scale substantially larger than the scale of the bathymetric effects that occur at the LS1 and LS2 points,
the wind speed vector was decomposed in the direction of maximum variance. MAZZINI (2009), who previ
-ously analyzed meteorological data collected on the Laje de Santos Isle, obtained the decomposition value of 54°, clockwise from the geographical north. A low-pass filter, Quadratic Lanczos type, with a cutoff frequency associ
-ated with a period of 33h, was applied to the “u” and “v” components of the current and wind time series. This pro
-cedure removes tidal oscillations and other high frequen
-cies (WALTERS; HESTON, 1981) and therefore obtains sub-inertial (or subtidal) currents and winds. The inertial period in the region is approximately 29.1 h. The complex correlations between the wind and the current filtered time series were calculated following the method proposed by KUNDU (1976).
The energy spectra of the currents were obtained us
-ing the Welch method, which estimates the spectral energy density separating the time series into partially overlap
-ping segments. Later, the method computes a modified periodogram for each segment and then calculates its av
-erage. The parameters used were: sampling frequency = 1h; segment length = 512; and attenuation coefficient of the Chebyshev spectral window = 50 dB.
Results
Currents measured at LS1 (Figure 3) and LS2 (Figures
4 an 5) visually exhibit an essentially barotropic behavior, i.e., the intensities and directions of the velocity vectors show a small variation throughout the water column (small vertical shear of the velocity vectors). From comparing the variance of their rotated components we find they are bet
-ter aligned with local isobaths than the overall continental shelf orientation. Though currents were measured at several layers, only surface, intermediate and deep ones are shown.
Figure 3. Time series of the current vectors measured at
LS1, 24 January, 2014 to 4 July, 2014. The scale is indi
-cated in the upper left corner. Vector direction is according to the wind rose in the upper right corner. Abscissa axis: time (mm/dd/yy). Ordinate axis: depth (m).
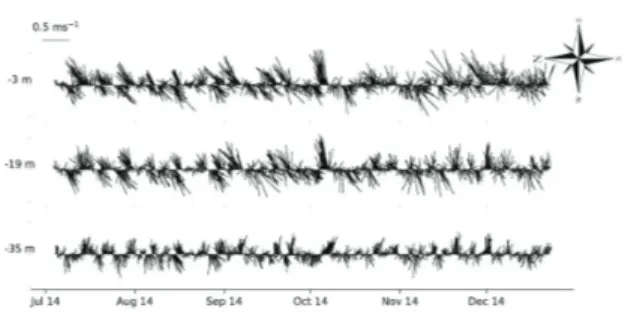
Figure 4. Time series of the current vectors measured at
LS2 (July to December, 2014). The scale is indicated in the upper left corner. Vector direction is according to the wind rose in the upper right corner. Abscissa axis: time (mm/dd/yy). Ordinate axis: depth (m).
Figure 5. Time series of the current vectors measured at
LS2 (January to June, 2015). The scale is indicated in the
The results of the statistical moments are in Tables 2 and 3.The average value of the “u” and “v” components at LS1 and
LS2 are small when compared to the extreme values measured. These differences, along with the relatively large standard de
-viations of the averages, indicate the high temporal variability of both velocity components.
The average perpendicular currents converge towards the coast at LS1 and diverge at LS2. On the other hand, the cur
-rents parallel to the coast (Table 3) have a preferred direction that leaves the isobaths to the left at all levels at both sampling points, though the average was also small compared to the standard deviation. These differences between the two velocity components, combined with the fact that in general the paral
-lel components have extreme values and standard deviations, higher in magnitude than the perpendicular ones, suggest that the average advection measured occurs preferentially in the direction almost parallel to the coast, but with a convergence signal to the coast at LS1 and a divergence signal at LS2.
Table 2. First statistical moments of the component perpendic
-ular to the isobaths (u) of the current speed vector at LS1 and LS2. Level = L (m); Minimum = Min (ms-1); Maximum = Max
(ms-1); Average = Avg (ms-1); Standard Deviation = SD (ms-1).
LS1 LS2
L Min Max Avg SD Min Max Avg SD
-3.0 - - - - -0.60 0.67 0.04 0.16
-8.0 -0.72 0.61 -0.03 0.14 - - -
--19.0 - - - - -0.37 0.49 0.01 0.10
-23.0 -0.60 0.33 -0.04 0.10 - - -
--35.0 -0.46 0.45 -0.02 0.09 -0.22 0.25 0.01 0.06
Table 3. First statistical moments of the component parallel to the
isobaths (v) of the current speed vector at LS1 and LS2. Level = L (m); Minimum = Min (ms-1); Maximum = Max (ms-1); Average
= Avg (ms-1); Standard Deviation = SD (ms-1).
LS1 LS2
L Min Max Avg SD Min Max Avg SD
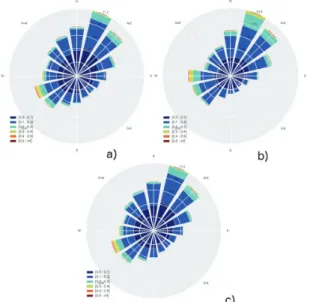
5). Currents that flow in the SE-S direction, leaving the coast to the right, are also frequent at LS1. At LS2, the cur
-rents also exhibit great polarization in the direction paral
-lel to the coast (Figure 6 and 7). Overall, Figures 6 and 7 support the understanding that the advection is almost parallel to the local isobaths at LS1 and LS2.
Figure 6. Directional histograms of the currents at LS1 on
three levels: near the surface (-8 m; upper left panel - a), midwater (-23 m; upper right panel - b) and near the bot
-tom (-35 m; lowest panel - c). Intensity (m.s-1); direction
The variance of total perpendicular currents at LS1 and LS2 did not show substantial differences (Table 4). The same is observed for the filtered currents (sub-inertial).
Generally, the supra-inertial energy oscillations of the cur
-rents at the two sampling points are greater than the sub-inertial oscillation in the perpendicular direction.
Table 4. Variances of the components perpendicular to the isobaths (u) of the current speed vector at LS1 and LS2 on the
levels: near the surface (S), midwater (M) and near the bottom (B). Variance-Total was estimated from the original series and the Variance-Filtered was estimated from the filtered series (sub-inertial). Variance-Explained is the percentage ratio between Variance-Filtered and Variance-Total.
VARIANCE - TOTAL (m2 s-2)
VARIANCE - FILTERED (m2 s-2)
VARIANCE- EXPLAINED (%)
LS1 – S 0.0188 0.0064 34.1
LS1 – M 0.0110 0.0052 47.0
LS1 – B 0.0077 0.0034 43.4
LS2 – S 0.0253 0.0142 56.0
LS2 – M 0.0096 0.0048 49.6
LS2 – B 0.0037 0.0015 40.9
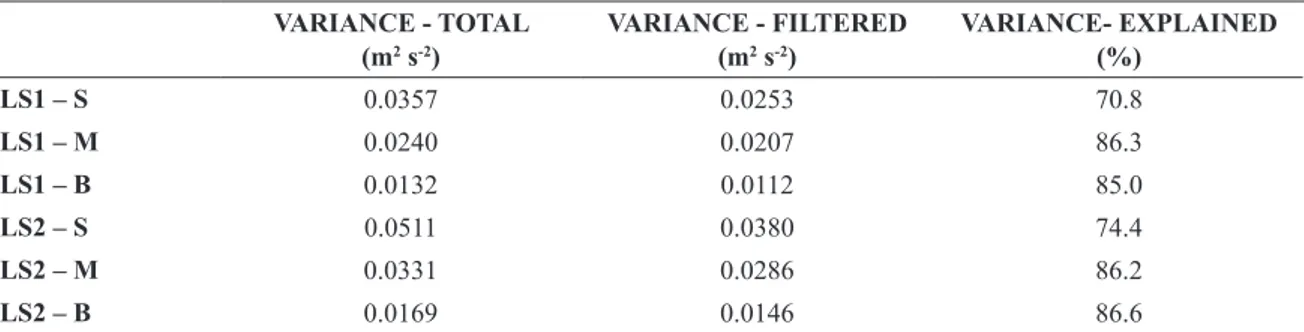
The variances of total parallel currents (Table 5) in
-dicate that the values at LS2 are higher than those at LS2.
For these parallel components, the sub-inertial oscillations explain most of the total variance (more than 70%) at both sampling points. The variance of the parallel components are greater than the perpendicular ones (Tables 4 and 5),
for both gross (total) and filtered series, in agreement with previous results that indicate currents are almost parallel to the isobaths. Furthermore, while the variability of the currents in the perpendicular direction is basically supra-inertial, in the parallel direction this variability is highly sub-inertial.
Table 5. Variances of the components parallel to the isobaths (v) of the current speed vector at LS1 and LS2 on the levels:
near the surface (S), midwater (M) and near the bottom (B). Variance-Total was estimated for the original series and the Variance-Filtered was estimated for the filtered series (sub-inertial). Variance-Explained is the percentage ratio between Variance-Filtered and Variance-Total.
VARIANCE - TOTAL (m2 s-2)
VARIANCE - FILTERED (m2 s-2)
VARIANCE- EXPLAINED (%)
LS1 – S 0.0357 0.0253 70.8
LS1 – M 0.0240 0.0207 86.3
LS1 – B 0.0132 0.0112 85.0
LS2 – S 0.0511 0.0380 74.4
LS2 – M 0.0331 0.0286 86.2
LS2 – B 0.0169 0.0146 86.6
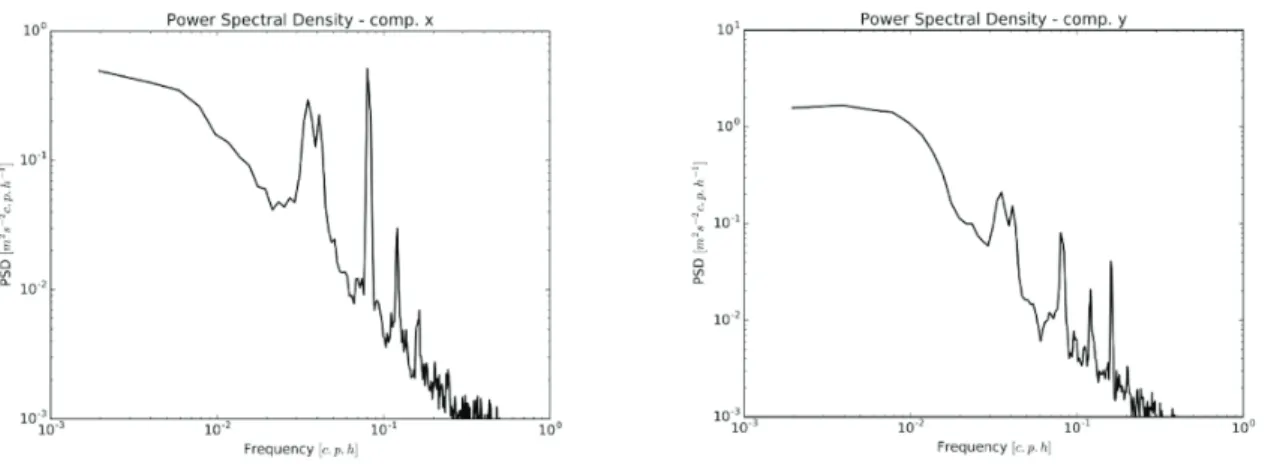
The relative energy contained in the sub and supra-inertial oscillations can be compared by estimating the energy spectra from the current data series measured at approximately midwater (intermediate position between the surface and the bottom, Figures 8 and 9). These figures confirm that the parallel components contain more energy in the sub-inertial band than the perpendicular compo
-nents, at both LS1 and LS2. In this band, higher energies
appeared in the frequency range from 0.004 to 0.007 cph that correspond to periods between 6 and 10 days.
The frequencies associated with the semidiurnal tides (frequency of approximately 0.08 cph) are the most ener
-getic for the parallel components of the speed vector in the supra-inertial band (Figures 8 and 9). An energy accumula
Figure 8. Energy spectrum (m2 s-2 cph-1) of the speed vector components normal (u, upper panel) and parallel (v, lower
panel) to the isobaths observed at midwater at LS1.
Figure 9. Energy spectrum (m2 s-2 cph-1) of the speed vector components normal (u, upper panel) and parallel (v, lower
panel) to the isobaths observed at midwater at LS2.
Especially on wide continental shelves like the SPCS, the sub-inertial variability of the currents is mostly driven by synoptic oscillations of the surface wind stress. This stress is proportional to the square of the wind speed. The directional histogram of the wind speed during the experi
Correlations between wind and current were calculat
-ed using the filter-ed series. Small-scale bathymetric fea
-tures around the LS1 and LS2 points hinder the estimation
of these correlations. Both the SASH and synoptic system winds have a much larger spatial scale and are not affected by the ocean bathymetry. Therefore, the correlations were estimated considering the wind and current vector series at both sampling points resulting in 0.40 and 0.54, respec
-tively to LS1 and LS2. The amplitude of the correlations
indicates statistically significant values, confirming the cause-effect relationship between the synoptic wind and the sub-inertial currents. Phase angles were 97° and -65° and reflect the preferential almost parallel to the isobath orientation of the currents, since the prevailing winds oc
-cur in the E-W direction.
Tidal variability of the currents can be better evalu
-ated in the light of the results of a harmonic analysis, ex
-emplified in Table 7 for the LS1 mooring. In general, the
semidiurnal components are the most energetic, with the predominance of the principal lunar (M2). Of the diurnal
components, K1 has more energy than O1, on all levels,
and S2, near the surface. Considering the semidiurnal com
-ponents, it is noteworthy that they have more energy in the perpendicular (u) direction to the isobaths than in the
parallel direction (v).
Table 6. Amplitude (10-2 ms-1) of the components per
-pendicular (u) and parallel (v) to the isobaths of the tidal current speed vector at LS1 on the levels: near the surface (S), midwater (M) and near the bottom (B). The tidal com
-ponents M2, S2, K1, O1 and M4 are the most energetic ones.
COMP. M2 S2 K1 O1 M4
U-S 4.72 3.22 3.97 0.31 0.12
U-M 5.25 3.24 1.16 1.16 0.36
U-B 4.87 3.07 0.83 0.84 0.37
V-S 1.80 1.57 2.88 0.82 1.10
V-M 1.66 1.32 1.30 0.61 1.39
V-B 1.48 1.26 0.84 0.04 1.14
DISCUSSION
The SMPLS region is situated on a wide continental shelf (SPCS) that presents a western boundary current at its edge. Continental shelf of this type has been classi
-fied and discussed by LODER et al. (1998). In general, western boundary currents have significant influence in its outer portion, transferring mechanical energy to the
currents and mixing the water masses in it. In the case of the SPCS, the western boundary current is the Brazilian Current (BC). However, in the inner and middle portions of these continental shelves, such as the SMPLS, the hydro-thermodynamic influence of the western boundary currents is usually small. In these two regions, there is the dominance of responses of the continental shelf to winds, tides, and fluvial discharge stress forces.
The current results obtained at LS1 and LS2 confirm
the appropriate classification by LODER et al. (1998) of the study region. The sub-inertial currents explained more than 70% of the observed variance in the parallel direction and less than 50% in the perpendicular direction (Tables 5 and 6). This means that the area in which LS1 and LS2 are
set (on the ICS) exhibits responses typical of wide con
-tinental shelves to the wind and tidal forces. The synop
-tic variability of winds forces sub-inertial oscillations of currents in the parallel direction and the tidal co-oscilla
-tions dominate the currents in the perpendicular direction (Tables 5 and 6).
This different behavior between the two components of the velocity vector has also been observed by other au
-thors on the ICS near the PEMSL (Mazzini, 1999). The author mentioned above also observed the high temporal variability of the sub-inertial parallel currents, with the
preference for those leaving the isobaths to the left and
regular periods between 6 and 11 days.
The preponderance of semidiurnal tidal currents in both directions, though with more energy in the perpendic
-ular direction, has previously been observed by PEREIRA et al. (2007), when analyzing current meter data from the ICS of the SPCS.
The sub-inertial currents, substantially parallel to the isobaths, are driven by synoptic winds, as correlation re
-sults between currents and winds. This response, typical of inner portions of wide continental shelves, has previously been described in other regions of the SPCS (DOTTORI; CASTRO, 2009; MAZZINI, 2009).
CONCLUSIONS
The SMPLS region behaves hydrodynamically in agreement with the classification of LODER et al. (1998) in the inner and middle portions of wide continental shelves. Sub-inertial currents flow essentially parallel to the coast, driven by synoptic winds, bidirectional, oriented in such a way that the isobaths lie to their left. This di
existing topographical features at LS1 and LS2, is from SW
to NE. Supra-inertial tidal currents are more energetic in the direction perpendicular to the isobaths (than orthogo
-nal), with the dominance of the semidiurnal components M2 and S2. The prevailing currents in LS1 were 0.1 to 0.2
ms-1 N-NE and 0.1 to 0.2 ms-1 NE-E in LS2. We found
strong influences of current alignment caused by the 30-40 m isobaths retraction, towards the coast. Also, very local bathymetric nuances cause misalignment of cur
-rents, mostly in LS1 and due to passages amongst rocky
formations.
REFERENCES
CASTRO, B. M. Summer/winter stratification variability in the central part of the South Brazil Bight. Cont. Shelf Res., 89:
15-23, 2014.
CASTRO, B. M.; Miranda, L. B. Physical Oceanography of the Western Atlantic Continental Shelf Located Between 4°N and 34°S. In: Robinson, A.L., Brink, K.H. (Org). The Sea, vol.
11. Oxford: John Wiley and Sons: 209-251, 1998.
CERDA, C.; Castro, B. M. Hydrographic climatology of South Brazil Bight shelf Waters between São Sebastião (24°S) and Cabo São Tomé (22°S). Cont. Shelf Res., 89: 5-14, 2014.
COELHO, A. L. Resposta da Plataforma Continental Sudeste a ventos sazonais e sinóticos de verão: estudos numéricos. 2008. Doctoral Thesis (Doutorado em Oceanografia Física) - Instituto Oceanográfico, Universidade de São Paulo, São Paulo, 2008. Available through <doi:10.11606/T.21.2008.tde-24062008-162856> [Accessed 10-14-2016, in Portuguese].
DOTTORI, M.; Castro, B. M. The response of the São Paulo con-tinental shelf, Brazil, to synoptic winds. Ocean Dynamics, 59:
603-614, 2009
KANAMITSU, M.; EBISUZAKI, W.; WOOLLEN, J.; YANG, S–K.; HNILO, J. J.; FIORINO, M.; POTTER, G. L. NCEP-DOE AMIP-II Reanalysis (R-2). Bull. Amer. Meteor. Soc., v.
83, p. 1631-1643, 2002.
KUNDU, P.K. Ekman veering observed near the ocean bottom. J. Phys. Oceanogr., 6: 238-242, 1976.
LODER, J.W.; Boicourt, W. C.; Simpson, J.H. Western ocean boundary shelves: Coastal segment (W). In: In: Robinson, A.L., Brink, K.H. (Org). The Sea, vol. 11. Oxford: John Wiley and Sons: 3-27, 1998.
MAZZINI, P. L. F. Correntes subinerciais na Plataforma Conti-nental interna entre Peruíbe e São Sebastião: observações. 2009. MSc. Dissertation (Mestrado em Oceanografia Física) - Instituto Oceanográfico, Universidade de São Paulo, São Paulo, 2009. Available through <doi:10.11606/D.21.2009.tde-22092009-154153> [Accessed 10-14-2016, in Portuguese]. PEREIRA, A. F.; Castro, B. M.; Calado, L.; Silveira, I. C. A.
Nu-merical simulation of M2 internal tides in the South Brazil Bight and their interaction with the Brazil Current. J. Geo-phys. Res., 112: C04009, doi:10.1029/2006JC003673, 2007.
SOUZA, M. C. de ARRUDA. A Corrente do Brasil ao largo de Santos: medições diretas. 2000. MSc. Dissertation (Mestrado em Oceanografia Física) - Instituto Oceanográfico, Univer-sidade de São Paulo, São Paulo, 2000. Available through <doi:10.11606/D.21.2000.tde-10092003-094250> [Accessed 10-14-2016, in Portuguese].