The Formation and Dynamic Evolution of Antiphase Domain Boundary in FeAl Alloy:
Computational Simulation in Atomic Scale
Kun Wanga* , Yongxin Wanga, Yanfeng Chenga
Received: November 29, 2017; Revised: June 27, 2018; Accepted: July 11, 2018
The main objective of the present work is to build a model and analyze the dynamic evolution process of antiphase domain boundary (APDB) in FeAl alloy. The formation, evolution of APDB, long range order (LRO), the crystal structure transition, impact of temperature on LRO, are investigated. Comparisons with experiments proves that the model is competent for the dynamic investigation of APDB in microscopic scale and able to predict different boundary-types and their corresponding atoms distribution. The dynamic process shows that the initial distribution of premier micro domains determine the morphology of APDB. The morphological evolution of APDB significantly affects the quantity of APDB. The in situ observation shows that the crystal structure of a micro domain is altered by the APDB movement. The calculated LRO revealed that the atoms in Al-sublattice mainly contribute to the low order degree of FeAl at different temperatures.
Keywords: Antiphase domain boundary, Dynamic evolution, Phase field simulation, FeAl.
*e-mail: [email protected]
1. Introduction
In recent years, due to the development of modern industry the demand for structural materials is growing1. The
intermetallic compounds have attracted a lot of attention due to their peculiar properties. Among various compounds, the B2-FeAl has been considered as an important high-temperature structural candidate. Which has increasingly attracted the interest of materials scientists. In addition to its excellent moderate to high-temperature property, FeAl compound also has other extraordinary properties2-7, including: high specific strength/weight ratio, excellent corrosion and oxidation resistance as well as sulfidation resistance, low raw material costs, retaining LRO up to critical temperature of A2 ⇌ B2 phase transformation, stress anomaly, wear resistance.
In view of the attractive properties, a series of investigations on the FeAl or FeAl-based alloys are performed. Among these works, some studies have been carried out in theories, such as effects of doping elements8, slip9,10, point defects11,12,
strengthening mechanisms13, hydrogen-effect14-16, basic
theory calculation17-19 and so on. Other investigations are implemented in experiments. And many of those investigations concentrate on the same subject of theoretical studies, such as point defects20-24, hydrogen effect25-27, and strengthening28-30. In addition, compared with the theoretical studies, the experimental investigations particularly focus on chemical and physical properties, such as oxidation and corrosion resistance7,31,32.
In spite of numerous studies, researches referring to APDB in FeAl are seldom paid attention33,34. To our knowledge, the
APDB has a share in influencing the magnetic35, mechanical36
and plastic37 properties of the alloy. The microscopic structures
determine the macroscopic properties. To get a better control on the microscopic structures, it is important to understand the specific evolution process of microscopic structures. So investigations on APD and APDB are needful and significative. However, for the solid to solid phase transformation, due to the spatial and temporal restrictions it is difficult and expensive to accomplish an instantaneous tracking on the whole transformation process. Fortunately, the phase field method which is a powerful tool for materials research, make it available for the investigation on the whole phase transformation process38-40. Therefore, the main objective of this work is to build a model for the investigation of the APDB in FeAl alloy. And make it possible to clearly capture the formation process of APDB in atomic scale, predict the motion as well as evolution of APDB during the order-disorder solid phase transformation. It is believed that the model is helpful in having a further and comprehensive understanding about the FeAl-based alloy and meaningful for the material design.
2. Theoretical Method
2.1. The MPF model
Based on Ginzburg-Landau theory, Khachaturyan firstly introduced the microscopic phase field (MPF) theory41. Then,
Chen et al. built MPF model for two types of face-centered cubic (f.c.c) alloys: the Al-Li alloy and Ni-Al-V alloy42-46. In the model, the instantaneous crystal cell configuration and temporal morphology are described by a distribution function: ρ(r,t) The function expresses a probability of
a State Key Laboratory of Solidification Processing, Northwestern Polytechnical University, Xi’an,
finding an atom at the lattice site r at time t. For the binary alloys, the function can be written as
(1)
c0 is solute composition of the alloy, kB is Boltzmann constant, Tis temperature, L0(r-r')denotes the matrix of kinetic coefficients
related to probabilities of elementary diffusional jumps from site r to r' of a Bravais lattice during a unit time. φ is the
total energy of the system. It can be written as
(2)
w(r-r') is the effective interchange energy between two atoms
at lattice sites r and r'. It consists of two parts: the chemical interaction energy wch(r-r’) and the strain-induced elastic interaction energy wel(r-r'). The more detailed descriptions of the MPF can be referred to references 42 to 46.
2.2. The application of MPF model to the bcc
alloy
The FeAl’s structure is CsCl-type (Pm m3 , Tm = 1423 K,
. A
a = b = c =2 89c). The Al atom occupies the body center and the Fe atoms occupy the corner sites (Figure 1). Thus, the FeAl unit cell can be described as two interpenetrating simple cubic sublattices Fe and Al. In the structure, each atom has a nearest coordination sphere containing eight atoms of the other type. So, for an atom in the perfect B2 unit cell, its first-nearest vector is r1=12Qa+b+cV and
the second-nearest is r2=a.
In the Fourier space, wch(r-r') and L0(r-r') are indicated as wch(k) and L0(k), respectively. And the two parameters are correlated with the crystal lattice site
(3)
(4)
The Vi(i=1,2,3) is the nearest neighbor effective interchange
energy from the first coordination sphere to the last. L is a constant. k=2π(ha*, kb*, lc*) is the vector in reciprocal
lattice space of FeAl. (a*, b*, a*) are the reciprocal unit
vectors corresponding to (a, b, c). In Figure 1, a random r
is written as r=(ma, nb) in a (x, y) Cartesian coordinate, and
,
n m n m
r=R! - $al! + $blW is the form of r in (x′, y′)
Cartesian coordinate (Figure 1). a′ and b′ are new unit vector of the new coordinate. The reciprocal lattice vector for the new coordinate is k 2 h a**,k b**
r
= R m m W, a** and
a** are reciprocal unit vectors corresponding to a′ and b′.
Therefore, according to the relationship between two Cartesian coordinates and their reciprocal coordinates, a random k
vector in new coordinate may be displayed as
(5)
With vector (5), the expressions of wch(r-r') and L0(r-r')
in reciprocal space are expressed as
(6)
(7)
The strain-induced elastic interaction energy wch(r-r')
in reciprocal space is in form of
(8)
In Fourier space, u=Qu ux, yV=k k , ux and uy are constitutive vector of u along x and y directions. ε results
from crystal lattice misfit between solid solution lattice and precipitated phase lattice. c11, c12, c44 are the three independent elastic anisotropic constants of b.c.c alloys.
According to (2), the Fourier transformation of ,t
r
2{ 2tQ l V is deduced as
(9)
And equation (1) is expressed through (6), (7), (8), (9) in Fourier space
,
,
t r t
k T
L c c
t
r r r
r 1
B
0 0 0
2 2 2 2 t t {
= l - l
-l
Q
Q QQ
V
V VV
/
ln ln
k T r
w
r r r r
r r r r
1 1
2 1 B
rr
{ t t t t
t t
= + -
-+ - - l l
l Q Q Q Q R Q
Q R Q
V V
V
V V
VW VW
" %
/ /
Figure 1. The projection of 2×2 super FeAl cell along <001> direction.
cos
cos
cos
cos
cos
cos
cos
cos
cos
cos
cos
cos
w
V
h
k
l
V
h
k
l
V
h
k
h
l
h
l
k
8
2
2
2
2
2
4
2
2
2
2
2
2
ch 1 2 3$
$
$
$
$
r
r
r
r
r
r
r
r
r
r
r
r
=
+
+
+
+
+
+
Q
Q
Q
Q
Q
Q
Q
Q
Q
Q
Q
Q
Q
V
V
V
V
V
V
V
V
V
V
V
V
V
!
#
$
&
cos cos cos
L0 k =8L rh $ rk $ rl -1
+
Q V ! Q V Q V Q V $
,
,
h
k
h
k
h
k
k
2
a
**b
**2
a
*b
*r
r
=
=
+
-+
m
m
m
m
m
R W R
!
$
!
$
Wcos
cos
cos
cos
w
V
h
k
h
k
V
h
k
h
k
k
8
2
2
2
ch 1 2
$
r
r
r
r
=
+
-+
+
+
-+
m
m
m
m
m
m
m
m
R
Q
Q
Q
Q
W
V
V
V
V
!
!
$
$
!
!
$
$
F I
cos cos
L0 k =8L rh +rk $ rh -rk -1
+ m m m m
R W
!
Q V Q V$
.
w
c c c c
c c c c c
u u u
2
4 2 2
0 125
el x y
11 11 12 44 2
11 1122 11 12 44 2 2
f
=
+ +
+ -
-Q
V
Q
Q
V
Q
V
V
Q
V
, , ,
, ln t
w t k
t t
k k k k
k 1 B 2 2 t { t t t = + -+ + + + +
(10)
The solution of atomic distribution function (ADF) ρ(k, t) is by means of the iterative approach
(11)
2.3. The parameters for the model
In this paper, the parameters are: ∆t=0.00001; ε=0.00692; c11=219.2GPa, c12=123.2GPa, c44=127.7GPa47; V
1=0.0922eV,
V2=-0.32eV48; T = 973K, C
0=0.351. The simulation work
was performed in a matrix (square lattice) containing 512×512lattice points, where the periodic boundary conditions were implemented along both directions. In the temperatural and compositional ranges, a B2-FeAl single phase exists1.
3. Result and Discussion
3.1. The formation of FeAl APDB
The micrographs of formation and dynamic evolution of APDB reproduced by MPF simulation for Fe-35at. % Al at T = 973K are presented in Figure 2. In the initial stage, the alloy system is a disordered solid solution which is generated by assigning the average compositions of Fe and Al to the respective distribution functions at each lattice site. As visually depicted by pure color existed in Fig. 2(a), the solute Al occupies each sublattice site with a probability equal to Al solute concentration 0.35. When t = 950, the micro domains form in the solid solution. Because of the random thermal noise, the micro domains possess different LRO degrees (the thermal noise is removed at
t = 200). It is found that the formation process is very fast,
,
,
, , ln
t t
k T
L k c c
w t k
t t
k
k k
k k
1
1
B B
0 0 0
2 2t
t
t t
= - +
- +
+ +
+ +
+
R R Q R R R
S
W W V W W W
X
#
&
,t ,t t,t t
k k 0 2k
2
t t
t
D
= +
+ +
+
R W R W R W
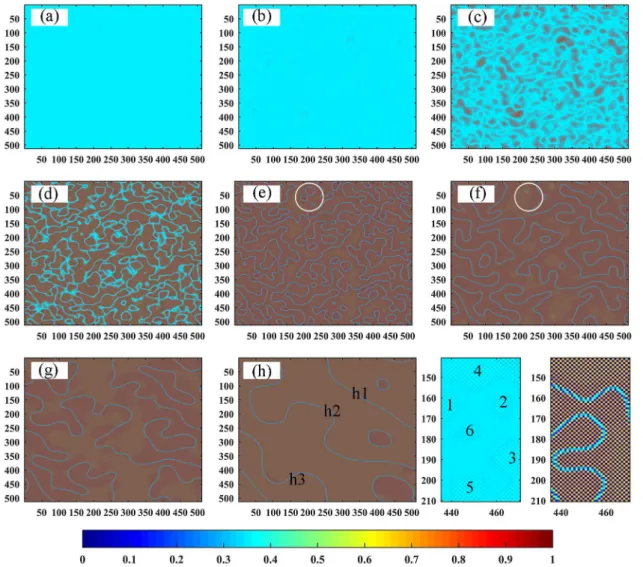
Figure 2. The morphological evolution of B2-FeAl ordered domains in Fe-35at. % Al, T = 973 K. (a)-(h) represent the instantaneous
photographs corresponding to t = 50, 950, 1000, 1050, 2200, 8950, 25050, 100000. The lowest bar is the color schematic diagram for
which can be illustrated by the comparison of Figure 2b, 2c, 2d. Figure 2d shows the complete formation of B2 APDB. Before this time, accompany with the precipitations of new ordered micro domains, the existed micro domains hold their growing. There are two evolutional possibilities for all micro domains during the formation process: coalescence and collision. Micro domains increasingly grow into one larger domain when they coalesce with each other. In this case, APDB does not form. In the second circumstance, the conflict of micro domains generates an APDB in the contact area. The micro domains of smallest bulk firstly disappear. Examples can be given by the marked part in Figure 2e. For the coalescence, only the micro domains having the same sublattice configurations in their junction crystal lattice sites can coalesce to produce a larger domain. In the right bottom of Figure 2, an instance of coalescence is clearly displayed. The left image is extracted from Figure 2b. Its location in Figure 2b is realizingly identified by its coordinate numbers. The right is the in situ photograph extracted at time t = 1150. In the selected region, six ordered micro domains precipitate from the parent phase, it is clearly seen that they are separated by disordered solid solution when the ordering starts. During the ordering process, the micro domains marked with 1, 2 and 3 coalesce with each other; meanwhile, the 5th and 6th
micro domains also merge into one domain. After a check in atomic scale, it is certified that the 1st, 2nd and 3rd micro
domains completely overlap their same elementary sublattice in the connecting lattice sites. However, an APDB generates when the 4th micro domain encounters with the 1st and 2nd
micro domains. Which can be observed in the right imagine, another longer APDB is the conflicting result of a coalesced domain (6th and 5th) against the coalesced domain (1st, 2nd and
3rd). As illustrated in the Figure 2. The face-to-face contact
of colliding micro domain sublattices produces an area that the thickness is several atomic layers. The atomic ordered arrangement of this area is not consistent with the periodic arrangement of any micro domains. This misfit accounts for the reason of APDB formation: a result of collision between competitive growths of micro domains.
3.2. The dynamic evolution of FeAl APDB
Competitive growths of micro domains lead to the morphological change of B2 APDB. Initially, numerous micro domains occur randomly with various irregular shapes in the matrix, which determines that the APDB have multifarious winding forms and distribute in a high density. As is shown in Figure 2d-2h, when the time t increases, the density of APDB decreases. The APDB is one type of defects that have a higher free energy, which is less stable than the perfect structure and makes the system more unstable. Thus, the decrease of APDB volume derives from the improvement of systematic stability. For the very same reason, the APDB likewise adjusts its shape toward reducing the total system energy. Hence, the closed APDB gradually modulates its
shape from an anomalous closed shape to an approximately circular pattern and, simultaneously, shrinks its boundary length. However, as for the dynamic evolution, unlike the closed APDB, the unclosed APDB regulates its form by transforming a straight shape, such as the marked APDB: h1, h2 and h3 in Figure 2h. Deleting windings is the common feature for different typed APDB though they present different dynamic evolution routes. The dynamic evolution of APDB can be expressed as a function of time. In view of numerous production of micro APDB in the early stage, the dynamic evolution of APDB can impact the total APDB quantity.
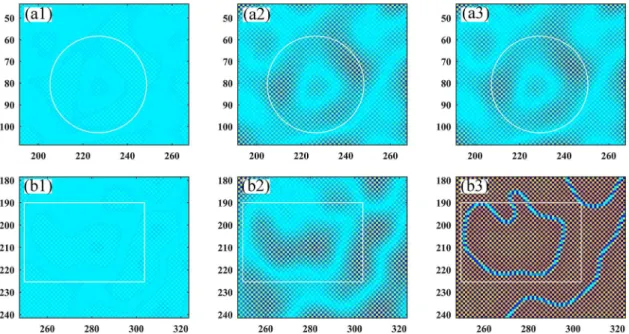
It is clearly presented that in the Figure 2, lots of closed APDB appear during the ordering transformation process. The APDB is an important factor affecting the material properties. Therefore, it is needful to study its formation process. In order to explicitly depict the formation of closed APDB, its early formation process is listed in Figure 3. To date, there is no work related to the formation process of B2-FeAl APDB in atomic scale. The MPF provides the formation process in the present work. Based on the theoretical results, it is found that the formation mechanism of closed APDB includes two types. The first type is presented in Figure 3a1 to 3a3. As displayed, the island micro domain (in the white circle) generates in a disordered region of the ordered domain. In fact, this case is rare in contrast with the second. According to the Ostwald Ripening, the island micro domain tends to dissolve. However, its wrapping domain mainly grows at expense of consuming the Al solute of the outside solid solution. The island micro domain can compete in depleting solute with the wrapping domain until the solid solution completely disappears. The second type is indicated in Figure 3 b1 to 3b3, the island micro domain (in white box) is separated with its neighbor island micro domains by solid solution. In the next competitive growth stage, its neighbor micro domains merge into a larger domain that completely wraps the island micro domain. This case is the main formation route for the closed APDB.
3.3. Impact of moving APDB on the crystal
sublattice configuration
The moving APDB has an impact on the crystal sublattice. The influence of moving APDB on the sublattice is exhibited in Figure 4.
Figure 3. Micrographs displaying the formation process of closed APDB. (a1-a3) t = 50, 950, 1000, respectively; (b1-b3) t = 50, 950,
1000, respectively.
Figure 4. The changes of Fe- and Al-distribution functions versus time t. (a) No APDB pass. (b) Single APDB passes one time. (c) Two
APDB totally pass two times. (d1-d2) The in situ FeAl crystal structure transformation in condition of (a), corresponding times t = 50,
1150, respectively; (e1-e3) The in situ FeAl crystal structure transformation in condition of (b), corresponding times t = 50, 1150, 5950,
respectively; (f1-f4) The in situ FeAl crystal structure transformation in condition of (c), corresponding times t = 50, 1150, 8350, 72250,
have any changes, this means no structural transformation occurs. Figure 4d1 is extracted from the morphological evolution figures. It is only existed cell structure before
t = 1000. And the structure showed in Figure 4d2 is the solely existed structure after t = 1150. Associated with Figure 4a, it is concluded that without the APDB movement, only one structural transformation occurs. Secondly, a region where only one APDB goes through is studied (the APDB reaches the investigated sublattice at t = 4000). Figure 4e2 to 4e3 shows the existed structures, respectively, corresponding to the second (t = 1150-4000) and third (t = 6000-100000) equilibrium period of distribution functions in Figure 4b. In this condition, comparison of Figure 4e2 and 4e3 demonstrates that after the APDB leaves, the left region has an inverse sublattice arrangement. Also, the phenomenon appears in the third condition. Two APDB successively pass the investigated area during the whole ordering process. Structures presented in Figure 4f1 to Figure 4f4 and the corresponding changes of curves exhibited in Figure 4c explicitly illustrate that APDB movement alters the crystal lattice for two times. In a word, during the moving process once the APDB passes a position, the crystal lattice of this area is influenced to alter once.
3.4. Impact of temperature on the LRO
In the case of intermetallic compound alloys, as a fundamental parameter reflecting the materials' properties, the LRO has an important contribution to its characteristics, such as the mechanical properties. Aiming at obtaining a further comprehension of the ordering behaviors under various temperatures, it is necessary to consider the LRO changes under different temperatures and know its variation rule. This information is profound for the design, improvement, doping and control of related materials, which motivates the present interest in the influence of temperature on the LRO of B2-FeAl.
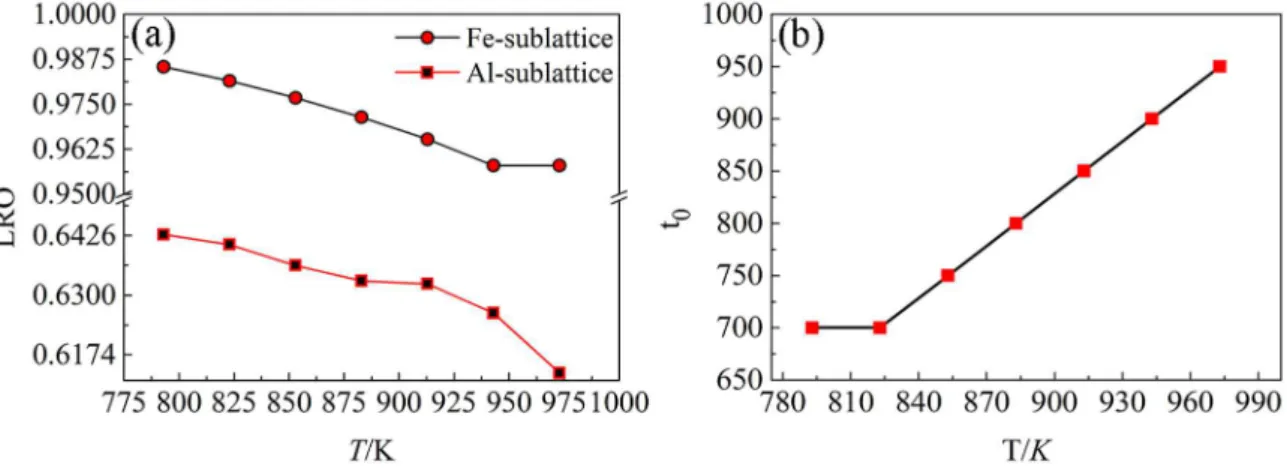
Figure 5(a) exhibits the LRO degree variation as a function of different sublattices at different temperatures for the Fe-35 at. % Al alloy. In Figure 5(a) the Fe- and Al- sublattice
are particularly differentiated which is very different from the traditional method. To some extent, this distinction can characterize the antisite defects of different sublattices. Graphically, it manifests that both the LRO degrees of Fe- and Al-sublattice decrease with temperature rise. The reason for this variation tendency is that as the temperature increase all atoms simultaneously vibrate more intensively and frequently. So it becomes more difficult to sustain its perfect structure. However, it is found that the Fe-sublattice is consistently in a higher order than Al-sublattice. This is because the formation of Fe-antisite needs much higher energy than the Al-antisite. Thus, the Fe-sublattice retains a better LRO degree than the Al-sublattice, which is consistent with other investigations1,15,49. So, the current work can act as a prediction for future researches.
3.5. Impact of temperature on the ordering
Figure 5(b) depicts the starting time of ordering as a function of temperature. For the control of phase transformation, the information about the relationship between time and process is necessary. What showed in Figure 5(b) reveals that the B2 structure domain precipitates earlier at low temperatures than at high temperatures. According to equation (2), compared with high temperature, the reduction of total free energy Δφ, which is the phase change driving force, has a larger value. This means that the ordering transformation is more likely to occur despite the fact that the atoms diffusion are more likely to be restricted duo to the slowed thermodynamic crystal vibration at low temperature.3.6. Comparison with the experiment results>
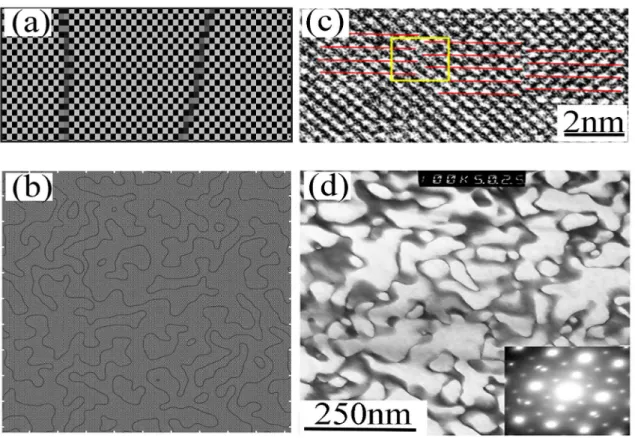
Figure 6 is the comparison between the simulation results and the experiment results. Figure 6a is the theoretical micro APD which is in the same size as Figure 6c. Figure 6c is the atomic micrograph obtained through the HTEM. Here, it should be pointed out that the Figure 6d is the show of Fe3Al APDB instead of FeAl. Because observations in nano-sized level on FeAl are so few. (Namely, this work firstlyFigure 5. (a) Change of LRO degree under the influence of various temperatures for Fe-35 at. % Al alloy. (b) The starting times of ordering
displays an atomic observation in nano-sized level.) But it does not hamper us to give a visual comparison between the simulation and experiment. It is proper because both the FeAl and Fe3Al compound are both based on the body centered cubic structure. From the comparison, we can find that the simulation results and experiment results are very similar, which proves that the simulation results are true.
4. Conclusion
Through the comparisons between the computational results and experimental results, it is found that the computational results agree well with the experimental results. In contrast to the previous phase field models based on a function of concentration-field, in the present work results in atomic level resolution are obtained. The present model provides a method for the investigations on the formation process, dynamic evolution routes of APDB in FeAl-based alloy. The theoretical formation process can be used as a supplement and reference for the experimental investigations of APDB in early stage, because the instantaneous observation in experimental solid phase transitions is a hard field. Meanwhile, dynamic evolution routes provide explicit information on the moving direction especially clear atoms configurations of different boundary-types which is one of most interesting
topics for material researchers. In this present work, it is found that: (i) the formation process shows that two ways account for the formation of closed APDB; the ordered domain grows through depleting micro APDB. (ii) The in situ research on crystal lattice shows that the movement of APDB thoroughly changes the crystal lattice configurations of the area where it passes by; and the change frequency of crystal lattice is determined by APDB migration times. (iii) The obtained LRO exhibits an inverse relationship with temperature increasing. With increasing temperature, the LRO degrees at Fe-sublattice and Al-sublattice decrease. However, differentiation in LRO exists in Fe- and Al-sublattice, which demonstrates that the Al-sublattice has a major contribution to the low order of FeAl domain.
5. Acknowledgments
This work is supported by the National Natural Science Foundation of China [Grant Number 51475378, 51575452, 51474176]. The computational facilities are supported by resources supplied by the State Key Laboratory of Solidification Processing, Northwestern Polytechnical University, Xi’an.
6. References
Figure 6. (a) The exhibition of B2-FeAl APD(B) of nano-scaled size in MPF simulation. (b) The map of APDBs morphology obtained
1. Hadef F. Synthesis and disordering of B2 TM-Al (TM = Fe, Ni, Co) intermetallic alloys by high energy ball milling: A review. Powder Technology. 2017;311:556-578.
2. Li DQ, Zhou LX, Xi YP, Liu L, Liu Z, Si JJ, et al. Phase transformation behavior of alumina grown on FeAl alloys with reactive element dopants at 1273 K. Journal of Alloys
and Compounds. 2017;692:427-433.
3. Mondal D, Banik S, Kamal C, Nand M, Jha SN, Phase DM, et al. Electronic structure of FeAl alloy studied by resonant photoemission spectroscopy and Ab initio calculations. Journal
of Alloys and Compounds. 2016;688(Pt B):187-194.
4. Zhao M, Yoshimi K, Maruyama K, Yubuta K. Thermal vacancy behavior analysis through thermal expansion, lattice parameter and elastic modulus measurements of B2-type FeAl. Acta
Materialia. 2014;64:382-390.
5. Morris DG, Muñoz-Morris MA. A re-examination of the pinning mechanisms responsible for the stress anomaly in FeAl intermetallics. Intermetallics. 2010;18(7):1279-1284.
6. Wu G, Baker I, Munroe PR, George EP. The yield strength anomaly of single-slip-oriented Fe-Al single crystals. Intermetallics. 2007;15(2):103-107.
7. Kant R, Prakash U, Agarwala V, Satya Prasad VV. Wear behaviour of a FeAl intermetallic alloy containing carbon and titanium. Intermetallics. 2015;61:21-26.
8. Zheng YB, Wang F, Ai TT, Li C. Structural, elastic and electronic properties of B2-type modified by ternary additions FeAl-based intermetallics: First-principles study. Journal of Alloys and
Compounds. 2017;710:581-588.
9. Paidar V, Lin YS, Cak M, Vitek V. Why is the slip direction in CuZn and FeAl different than in CoTi? Intermetallics. 2010;18(7):1285-1287.
10. Ren QQ, Gong HR. Ground state of stoichiometric B2 FeAl. Solid State Communications. 2013;169:57-61.
11. Semenova O, Krachler R, Ipser H. A generalized defect correlation model for B2 compounds. Solid State Sciences. 2008;10(9):1236-1244.
12. Fuks D, Strutz A, Kiv A. Influence of alloying on the thermodynamic stability of FeAl B2 phase. Intermetallics. 2006;14(10-11):1245-1251.
13. Palm M. Concepts derived from phase diagram studies for the strengthening of Fe-Al-based alloys. Intermetallics. 2005;13(12):1286-1295.
14. Gonzalez EA, Jasen PV, Luna R, Bechthold P, Juan A, Brizuela G. The changes in the electronic structure of B2 FeAl alloy with a Fe antisite and absorbed hydrogen. Physica B: Condensed Matter. 2009;404(21):4216-4220.
15. Gallouze M, Kellou A, Hamoutene D, Grosdidier T, Drir M. Absorption and adsorption of hydrogen in B2-FeAl: ab initio study. Physica B: Condensed Matter. 2013;416:1-7.
16. Jasen PV, González EA, Luna R, Brizuela G, Juan A. The hydrogen effect in the electronic structure and bonding of the B2 FeAl alloy with a Fe vacancy. International Journal of Hydrogen Energy. 2009;34(23):9591-9595.
17. Ouyang YF, Tong XF, Li C, Chen HM, Tao XM, Hickel T, et al. Thermodynamic and physical properties of FeAl and Fe3Al: an atomistic study by EAM simulation. Physica B: Condensed Matter. 2012;407(23):4530-4536.
18. Golovin IS, Balagurov AM, Bobrikov IA, Cifre J. Structure induced anelasticity in Fe3Me (Me = Al, Ga, Ge) alloys. Journal
of Alloys and Compounds. 2016;688(Pt A):310-319. 19. Zienert T, Leineweber A, Fabrichnaya O. Heat capacity of Fe-Al
intermetallics: B2-FeAl, FeAl2, Fe2Al5 and Fe4Al13. Journal of Alloys and Compounds. 2017;725:848-859.
20. Yamauchi A, Tsunekane M, Kurokawa K, Hanada S, Yoshimi K. Influence of vacuum annealing conditions on the surface oxidation and vacancy condensation in the surface of an FeAl single crystal. Intermetallics. 2010;18(4):412-416.
21. Yoshimi K, Tsunekane M, Maruyama K. Differential scanning calorimetry study on annihilation behavior of supersaturated thermal vacancies in B2-type FeAl. Intermetallics. 2010;18(7):1265-1272.
22. de Diego N, Plazaola F, Jiménez JA, Serna J, del Rio J. A positron study of the defect structures in the D03 and B2 phases in the Fe-Al system. Acta Materialia. 2005;53(1):163-172. 23. Kupka M, Stepien K, Kulak K. Effect of hydrogen on
room-temperature plasticity of B2 iron aluminides. Corrosion Science. 2011;53(4):1209-1213.
24. Haraguchi T, Yoshimi K, Yoo MH, Kato H, Hanada S, Inoue A. Vacancy clustering and relaxation behavior in rapidly solidified B2 FeAl ribbons. Acta Materialia. 2005;53(13):3751-3764.
25. Stepien K, Kupka M. Effect of hydrogen on room-temperature hardness of B2 FeAl alloys. Scripta Materialia. 2008;59(9):999-1001.
26. Stepien K, Kupka M. Diffusivity of hydrogen in B2 iron aluminides. Scripta Materialia. 2006;55(7):585-588. 27. Komagata S, Kawasuso A, Yabuuchi A, Maekawa M, Batchulun
C, Yasuda K, et al. Study on Defects in H+ ion implanted B2 type Fe-Al alloy using Slow Positron Beam. Physics Procedia. 2012;35:75-79.
28. Eumann M, Palm M, Sauthoff G. Alloys based on Fe3Al or FeAl with strengthening Mo3Al precipitates. Intermetallics. 2004;12(6):625-633.
29. Kupka M. High temperature strengthening of the FeAl intermetallic phase-based alloy. Intermetallics. 2006;14(2):149-155. 30. Colas D, Fraczkiewicz A, Louchet F. Nickel-induced strengthening
of boron-doped FeAl (B2) alloys. Intermetallics. 2007;15(1):85-92.
31. Nowak K, Kupka M. High-temperature oxidation behaviour of B2 FeAl based alloy with Cr, Zr and B additions. Materials Chemistry and Physics. 2012;132(2-3):902-908.
32. Kowalski K, Losiewicz B, Budniok A, Kupka M. Effect of alloying on corrosion resistance of B2 FeAl alloy in aqueous solution of sulfuric acid. Materials Chemistry and Physics. 2011;126(1-2):314-318.
33. Gammer C, Mangler C, Karnthaler HP, Rentenberger C. Growth of nanosized chemically ordered domains in intermetallic FeAl made nanocrystalline by severe plastic deformation. Scripta
34. Gammer C, Karnthaler HP, Rentenberger C. Reordering a deformation disordered intermetallic compound by antiphase boundary movement. Journal of Alloys and Compounds. 2017;713:148-155.
35. Mangler C, Gammer C, Hiebl K, Karnthaler HP, Rentenberger V. Thermally induced transition from a ferromagnetic to a paramagnetic state in nanocrystalline FeAl processed by high-pressure torsion. Journal of Alloys and Compounds. 2011;509(Suppl 1):S389-S392.
36. Viguier B, Martinez M, Lacaze J. Characterization of complex planar faults in FeAl(B) alloys. Intermetallics. 2017;83:64-69. 37. Koizumi Y, Allen SM, Minamino Y. Solute and vacancy
segregation to a/4<111> and a/2<100> antiphase domain boundaries in Fe3Al. Acta Materialia. 2008;56(19):5861-5874.
38. Ferreira AF, Paradela KG, Felipe Junior P, Alcântara Junior Z, Garcia A. Phase-Field Simulation of Microsegregation and Dendritic Growth During Solidification of Hypoeutectic Al-Cu alloys. Materials Research. 2017;20(2):423-429.
39. Furtado HS, Bernardes AT, Machado RF, Silva CA. The effect of adding boron in solidification microstructure of dilute iron-carbon alloy as assessed by phase-field modeling. Materials Research. 2011;14(2):195-205.
40. Lezama-Alvarez S, Avila-Davila EO, Lopez-Hirata VM, Gonzalez-Velazquez JL. Numerical analysis of phase decomposition in A-B binary alloys using Cahn-Hilliard equations. Materials Research. 2013;16(5):975-981.
41. Khachaturyan AG. Theory of Structural Transformation in
Solids. Mineola: Dover Publications; 2008.
42. Chen LQ, Wang YZ, Khachaturyan AG. Transformation-induced elastic strain effect on the precipitation kinetics of ordered intermetallics. Philosophical Magazine Letters. 1991;64(5):241-251.
43. Chen LQ, Khachaturyan AG. Computer simulation of structural transformations during precipitation of an ordered intermetallic phase. Acta Metallurgica et Materialia. 1991;39(11):2533-2551.
44. Wang YZ, Chen LQ, Khachaturyan AG. Strain-induced modulated structures in two-phase cubic alloys. Scripta Metallurgica et Materialia. 1991;25(8):1969-1974.
45. Poduri R, Chen LQ. Computer simulation of atomic ordering and compositional clustering in the pseudobinary Ni3Al-Ni3V system. Acta Materialia. 1998;46(5):1719-1729.
46. Poduri R, Chen LQ. Computer simulation of morphological evolution and coarsening kinetics of δ' (Al3Li) precipitates in Al-Li alloys. Acta Materialia. 1998;46(11):3915-3928.
47. Liu LL, Wu XZ, Wang R, Li WG, Liu Q. First principle study on the temperature dependent elastic constants, anisotropy, generalized stacking fault energy and dislocation core of NiAl and FeAl. Computational Materials Science. 2015;103:116-125.
48. Yasuda HY, Nakajima T, Nakano K, Yamaoka K, Ueda M, Umakoshi Y. Effect of Al concentration on pseudoelasticity in Fe3Al single crystals. Acta Materialia. 2005;53(20):5343-5351.
49. Hanc A, Kansy J, Dercz G, Jendrzejewska I. Point defect structure in B2-ordered Fe-Al alloys. Journal of Alloys and