UNIVERSIDADE DO ALGARVE
E
PIGENETICS AND ALTERNATIVE SPLICING
Soraia Vanessa Guerreiro da Silva
Dissertação de Mestrado em
Oncobiologia – Mecanismos moleculares do Cancro
Trabalho efectuado sob a orientação de:
Maria Carmo-Fonseca, MD PhD
Noélia Custódio, PhD
Ana Teresa Maia, PhD
Dissertação de Mestrado em Oncobiologia – Mecanismos Moleculares do Cancro
Epigenetics and alternative splicing
Declaro ser a autora deste trabalho, que é original e inédito. Autores e trabalhos consultados estão devidamente citados no texto e constam da listagem de referências incluída.
___________________________________________
Direitos de autor. A Universidade do Algarve tem o direito, perpétuo e sem limites geográficos, de arquivar e
publicitar este trabalho através de exemplares impressos reproduzidos em papel ou de forma digital, ou por qualquer outro meio conhecido ou que venha a ser inventado, de o divulgar através de repositórios científicos e de admitir a sua cópia e distribuição com objectivos educacionais ou de investigação, não comerciais, desde que seja dado crédito ao autor e editor.
AGRADECIMENTOS
O percurso que conduziu ao termo da presente investigação foi marcado por inumeráveis vivências ao nível pessoal e profissional. Representa um processo de amadurecimento nestes dois domínios, o qual não teria o mesmo valor sem a amizade, apoio e dedicação de todas as pessoas que fizeram e fazem parte da minha vida. Assim, quero expressar a minha profunda gratidão a todos aqueles que tornaram este relatório possível, em especial:
Às minhas orientadoras, a Professora Carmo, pela sua inspiração, atenção e disponibilidade em receber-me no seu laboratório; à Noélia, por ter sido tão prestável, por me ter ajudado e incentivado o meu trabalho no laboratório; e à professora Ana Teresa que apesar de não ter estado tão presente na parte prática, esteve presente na minha formação e ajudou-me a que não “caísse de pára-quedas” no laboratório.
À Rita Drago que me ensinou muitas das experiências que realizei neste trabalho e que esteve sempre presente.
À Joana Tavares que me deu uma ajuda preciosa na análise bioinformática.
Às minhas companheiras de mestrado, Sara e Vanessa, que viveram comigo esta experiência maravilhosa.
A todas as outra pessoas do laboratório, que me ajudaram sempre que precisei.
A todos os meus amigos, namorado e familiares que me acompanharam e me apoiaram nesta jornada da minha vida.
R
ESUMOEpigenética é a área da genética que se foca no estudo das alterações biológicas da célula que não envolvem alterações na sequência de nucleótidos do DNA. Um dos componentes da epigenética que tem vindo a ganhar interesse na comunidade científica são os RNAs longos não codificantes (do inglês long noncoding RNAs - lncRNAs) que são transcritos que contém mais de 200 nucleótidos. Estes não possuem quadros de leitura abertos (do inglês open reading frames – ORFs) e desempenham papéis biológicos importantes em diferenciação celular, pluripotência, regulação da transcrição, processamento e tradução de moléculas de RNAs. Têm sido também muito associados ao desenvolvimento de cancro, nomeadamente, na progressão tumoral e desenvolvimento de metáteses. Várias classes de lncRNAs têm sido descritas tendo em conta, maioritariamente, a localização destes transcritos no genoma em relação a transcritos com potencial codificante, os RNAs mensageiros (mRNAs). Uma classe de lncRNAs com interesse neste projecto é a dos transcritos anti-direccionais naturais (do inglês natural antisense transcripts – NAT). Estes transcritos têm a particularidade de serem codificados na cadeia anti-direccional de genes que codificam mRNAs, podendo haver sobreposição parcial com a região promotora ou com intrões. Pensa-se que poderão estar implicados na regulação da transcrição dos genes codificantes de mRNA ou na regulação da remoção dos intrões (splicing).
O presente trabalho é parte de um projecto que tem como objectivo principal investigar a biologia dos lncRNAs no contexto do desenvolvimento de leucemia. Embora já exista evidências recentes que destacam a importância de lncRNAs na regulação da expressão genética, pouco se sabe sobre o seu papel na diferenciação das células T e na transformação leucémica. O objectivo final do projecto em si, é encontrar possíveis alvos para terapias direccionadas a moléculas de RNA em células cancerígenas de Leucemia Linfoblástica Aguda de células T (do inglês T-cell Acute
Lymphoblastic Leukaemia - T-ALL). A metodologia proposta neste projecto combina
técnicas de alta resolução de epigenómica, transcriptómica e biologia molecular com abordagens para monitorizar a síntese, tempos de semi-vida e localização sub-celular de lncRNAs. A análise está focada em precursores de células T primárias purificadas a
partir de tumores do timo de ratinho e em modelos celulares de T-ALL de ratinho. O factor que diferencia e dá o carácter leucémico a estas células é a sobreexpressão do oncogene TLX3 que é considerando um dos genes mais mutados neste tipo de leucemias. No entanto, estudos anteriores mostraram que, por si só, esta sobreexpressão do oncogene não é suficiente para induzir a T-ALL, deste modo, poderão existir outros factores, tais como lncRNA, que estejam envolvidos no desenvolvimento da T-ALL. No âmbito deste estudo, foi seleccionado a partir da literatura uma lista de lncRNAs que são expressos em células T e podem ser relevantes no contexto da leucemia.
Para monitorizar o tempo de semi-vida de lncRNAs realizou-se marcação do RNA nascente nas células com um pulso de incorporação (do inglês, pulse labelling) do análogo do uracilo, 4-thioridine (4sU), que é incorporado em todo o RNA sintetizado na célula durante esse pulso de marcação. Segue-se a extracção de todo o RNA da célula e purificação dos RNAs nascente marcados com 4sU, e dos pré-existentes e dos não marcados. A quantificação por RT-qPCR dos lncRNAs de interesse nas diferentes populações de RNA permite o cálculo da semi-vida desses lncRNA. Os resultados obtidos neste trabalho corroboram os dados já conhecidos de outras investigações dando validade e eficácia da técnica experimental executada.
Para determinar a localização sub-celular de lncRNAs foi desenvolvido um ensaio de hibridação in situ de fluorescência com base em sondas de LNA e amplificação do sinal de hibridação das sondas com base em sistemas que utilizam métodos enzimáticos associados a fluorescência. Neste caso, os resultados não foram conclusivos, precisando esta técnica experimental ser melhorada e optimizada.
Os lncRNAs que serão analisados por estes ensaios, no futuro, serão fornecidos por meio de análise bioinformática do transcritoma de células T em diferentes fases de transformação leucémica. No final deste estudo iniciou-se esta análise bioinformática com dados de sequenciação de RNA (RNA-seq) obtidos de células T não transformadas e de células T em diferentes fases de transformação leucémica Nesta análise pretendeu-se ter uma ideia geral dos lncRNAs e mRNAs que pretendeu-se encontram diferencialmente expressos entre fases diferentes de transformação leucémica. Os resultados preliminares desta análise sugerem que existe uma percentagem maior de mRNAs diferencialmente expressos do que lncRNAs, quando se comparam células não transformadas com células em diferentes fases de transformação leucémica. O objectivo é identificar entre
os lncRNAs diferencialmente expressos aqueles que poderão ser relevantes na transformação leucémica. Estes serão alvo de estudos funcionais utilizando as técnicas optimizadas neste estudo, de modo a que se perceba o seu mecanismo de acção e se possa avaliar se têm potencial para ser alvos para terapias direccionadas.
A
BSTRACTEpigenetics is the field of genetics that studies the alterations in the transcriptional potential of a cell without interfering with the DNA sequence. One of its component is the long noncoding RNAs (lncRNAs) which are transcripts with more than 200 nucleotides and no evident open reading frames (ORFs) that play important biological roles like transcription and splicing regulation and have been associated with carcinogenesis. Several classes of lncRNAs have been described according to their genomic location in relation to protein‐coding genes.
The present work is part of a project aiming at gaining novel insights into the biology of lncRNAs in the context of leukemogenesis. Although recent evidence highlights the importance of lncRNAs in regulation of gene expression, little is known about their role in T-cell differentiation and leukaemic transformation. The ultimate goal of the project is finding possible targets for RNA therapeutics in T-cell Acute Lymphoblastic Leukaemia (T-ALL). The proposed methodology combines high-throughput epigenomics, transcriptomics and systems biology approaches with techniques to monitor synthesis, lifetime and sub-cellular localization of lncRNAs. The analysis is focused on primary T-cell precursors purified from the mouse thymus and on cellular mouse models of T-ALL.
The present study aims to develop functional assays to monitor lifetime and sub-cellular localization of lncRNAs in a sub-cellular mouse model of T-ALL. To monitor the lifetime of lncRNAs we carried out pulse labeling with the uridine analogue 4-thioridine (4sU) followed by purification of labeled nascent, pre-existing unlabeled and total cellular RNAs. RT-qPCR quantification of the RNA subsets allows the estimation of the lncRNA’s half-life. To determine the sub-cellular localization of lncRNAs we developed a fluorescence in situ hybridization assay based on LNA probes and enzyme-based signal amplification. In this study we selected from the literature a list of lncRNAs that are expressed in T‐cells and may be relevant in leukemogenisis. The candidate lncRNAs that will be analysed by these assays in the future will be provided by genome-wide transcriptomic analysis of different stages of T-cell leukemic transformation.
C
ONTENTSAGRADECIMENTOS ... iii
RESUMO ... iv
ABSTRACT ... vii
FIGURES INDEX ... xi
TABLES INDEX ... xiii
ABBREVIATIONS ... xiv
1. INTRODUCTION ... 1
1.1. The “new” RNA world – Long noncoding RNAs ... 1
1.1.1. Classification of lncRNAs ... 2
1.1.2. Function of lncRNAs ... 3
1.2. Long noncoding RNAs in Cancer ... 6
1.2.1. T-cell differentiation and Leukemogenisis ... 6
1.2.2. T-cell Acute Lymphoblastic Leukemia ... 8
1.2.3. Genetic alteration related to T-ALL ... 9
1.2.1. LncRNA expression during T-cell development and differentiation ... 11
1.3. Genome research of long noncoding RNAs ... 12
1.3.1. Expression of lncRNA ... 13
1.3.2. Stability of lncRNA ... 14
1.3.3. Subcellular localization and single molecule quantification of lncRNA . 15 1.4. Aims of the Study ... 16
2. METHODOLOGY ... 17
2.1. Cell culture ... 17
2.2. RNA extraction, purification and quantification ... 18
2.3. DNA extraction, purification and sequencing ... 18
2.4. Labelling with 4sU-tagging ... 19
2.5. LNA-RNA single-molecule FISH ... 20
2.5.1. Tyramine Signal Amplification (TSA) system ... 21
2.6. Imaging acquisition and analysis ... 23
2.7. RNA-seq libraries ... 23
2.8. Data analysis ... 23
3. RESULTS AND DISCUSSION... 25
3.1. Analysis of lncRNA stability in a T-ALL cellular model ... 25
3.1.1. Searching the literature for lncRNAs with a potential role in T-ALL... 26
3.1.2. Determining lncRNAs/mRNA expression levels by quantitative RT-qPCR ………...29
3.1.3. Measuring lncRNA/mRNA half-lives by metabolic labelling with 4-Thiouridine ... 30
3.2. In situ detection of individual lncRNA/mRNA molecules using LNA-modified oligonucleotides ... 32
3.2.1. Design of LNA-modified FISH probes ... 33
3.2.2. Detection of lncRNA/mRNA transcripts using single molecule LNA-FISH ………...36
3.3. Genome-wide analysis of lncRNAs and protein-coding genes in T-cell leukemic transformation ... 43
4. CONCLUSIONS AND FUTURE WORK ... 48
5. REFERENCES ... 50
F
IGURESI
NDEXFigure 1. 1 – Overview of the coding vs noncoding RNAs in the human genome. ... 2
Figure 1. 2 – Example models of lncRNA functions. ... 4
Figure 1. 3 – T-cell differentiation process. ... 8
Figure 1. 4 – TLX-Mediated Repression of the TCRa Enhancer. ... 11
Figure 1. 5 – Several types of diseases associated with lncRNAs. ... 13
Figure 2. 1 – Scheme of the T-ALL cell culture model developed by Dadi et al. 2012. ... 17
Figure 2. 2 – Scheme of the technique of Pulse labeling with 4sU-tagging... 19
Figure 2. 3 – Mathematical equation used to determine the transcript half-life developed by Rädle et al. 2013. ... 20
Figure 2. 4 – Representation of the chemical structures of DNA, RNA and locked nucleic acid (LNA) nucleotide units. ... 20
Figure 2. 5 – Simplified scheme of TSA system for RNA detection. ... 22
Figure 3. 1 – Relative expression levels of selected lncRNAs and mRNAs in TAP cells. ... 29
Figure 3. 2 – LncRNA and mRNA half-lives determined based on newly transcribed RNA/total RNA ratios. ... 31
Figure 3. 3 – Relative expression levels of selected exons present in the pairs mRNA/NAT (Nup214/Ens87 and Zeb2/Zeb2NAT) in TAP cells. ... 34
Figure 3. 4 – Simple scheme representing the regions were the LNA probes bind to the mRNA of Nup214 or Zeb2 and its antisense lncRNAs Ens87 or Zeb2NAT, respectively. ... 35
Figure 3. 5 – LNA-RNA smFISH in TAP cells, using TSA amplification: Hybridization with β-Actin LNA probe. ... 37
Figure 3. 6 – LNA-RNA smFISH in TAP cells, using TSA amplification:
Hybridization with Ens87 and Zeb2NAT LNA probes. ... 38 Figure 3. 7 – LNA-RNA smFISH in TAP cells, using TSA amplification:
Hybridization with Nup214 and Zeb2 LNA probes. ... 39 Figure 3. 8 – LNA-RNA smFISH in TAP cells, using TSA amplification:
Hybridization with Nup214/Ens87 and Zeb2/Zeb2NAT LNA probes. ... 41 Figure 3. 9 – Pie charts of the differential expression of lncRNAs and
protein-coding genes. ... 44 Figure 3. 10 – Differential expression of selected lncRNAs and protein-coding genes. ... 45
T
ABLESI
NDEXTable 1. 1 – Classes of long noncoding RNA with their representation and description. ... Erro! Marcador não definido.
Table 3. 1 – Genes involved in T-ALL and the the presence of nearby lncRNA. ... 27
Table 3. 2 – LncRNA candidates... 28
Table 6. 1 – Primers used in RT-qPCR.. ... 55
Table 6. 2 – Relative expression levels of selected lncRNAs and mRNAs in TAP cells.. ... 56
Table 6. 3 – LncRNA half-lives determined based on newly transcribed RNA/total RNA ratios.. ... 56
Table 6. 4 – Relative expression levels of the pair mRNA/NAT in TAP cells. ... 57
Table 6. 5 – Primers used in standard PCR and DNA sequencing.. ... 57
Table 6. 6 - DNA Sequences for smRNA-LNA FSH probe design.. ... 58
Table 6. 7 – LNA probes for smFISH. ... 59
Table 6. 8 –Differential expression of lncRNAs between different samples. ... 59
Table 6. 9 – Differential expression of protein-coding genes between different samples.. ... 60
Table 6. 10 – Differential expression of selected lncRNAs between different samples. ... 60
Table 6. 11 – Differential expression of selected protein-coding genes between different samples... 61
A
BBREVIATIONS4sU Uridine analogue 4-thioridine
α-Am α-amanitin
ABL1 Abelson Murine Leukemia Viral Oncogene Homolog 1
ActD Actinomycin D
Airn Antisense of IGF2R Non-Protein Coding RNA
ALL Acute Myeloid Leukemia
AML1 Acute Myeloid Leukemia 1 Protein
AP Alkaline Phosphatase
Bio Biotin
BSA Bovine Serum Albumin
CD1a Cluster of Differentiation 1a
CD3 Cluster of Differentiation 3
CD34 Cluster of Differentiation 34
CD4 Cluster of Differentiation 4
CD5 Cluster of Differentiation 5
CD8 Cluster of Differentiation 8
CLP Common Lymphoid Progenitor
Daxx Death Domain-associated Protein
Dig Digoxigenin
DN Double Negative
DNA Deoxyribonucleic Acid
DRB 5,6-dichloro-1–D-ribofurano-syl-benzimidazole
DP Double Positive
ELF Enzyme-Labelled Florescence
Ens87 ENSMUST00000156387
Ens91 ENSMUST00000130391
ErbAα2 Thyroid Hormone receptor
eRNA Enhancer RNA
ETP-ALL Early T-cell Precursor – Acute Lymphoblastic Leukaemia
ETS1 Protein C-ets-1
Eα Enhancer alpha
Fadd Fas-Associated Protein with Death Domain
FBXW7 F-box/WD Repeat-containing Protein 7
FISH Fluorescent In Situ Hybridization
FPKM Fragments Per Kilobase of transcript per Million
Gas5 Growth Arrest-specific 5
H2O2 Hydrogen Peroxide
HCl Hydrogen Chloride
HD Homeodomain
Hotair HOX Transcript Antisense RNA
HOX Family of Homeobox proteins
HRP Horseradish Peroxidase
Igf2r Insulin-like Growth Factor 2 Receptor
JAK/STAT Janus Kinase/Signal Transducer and Activator of Transcription
LEF1 Lymphoid Enhancer-binding Factor 1
LincRNA Long Intergenic Noncoding RNA
LNA Locked Nucleic Acid
LncRNA Long Noncoding RNA
LMO1 Rhombotin 1
MALAT1 Metastasis Associated Lung Adenocarcinoma Transcript 1
MHC Major Histocompatibility Complex
mRNA Menssenger RNA
NaCl Sodium chloride
NAT Natural Antisense Transcript
ncRNA Noncoding RNA
NEAT1 Nuclear Enriched Abundant Transcript 1
NKL Natural Killer Lymphocyte
NOTCH1 Notch Homolog 1, Translocation-associated
NPC Nuclear Pore Complex
Nup214 Nucleoporin 214
ORF Open Reading Frame
PBS Phosphate Buffer Saline
PCR Polymerase Chain Reaction
PFA Paraformaldehyde
qPCR Quantitative Real-Time PCR
RNA Ribonucleic Acid
RNA-seq RNA Sequencing
RT Room Temperature
RT-qPCR Retro Transcription – qPCR
RUNX1 Runt-related Transcription Factor 1
Ser/Arg Serine/Arginine Aminoacids
smRNA-FISH Single Molecule RNA – FISH
SP Single Positive
SSC Buffer Solutions with Citrate
T-ALL T-cell Acute Lymphoblastic Leukemia
TCRα T-cell Receptor Alpha
TCRβ T-cell Receptor Beta
TCRγ T-cell Receptor Gamma
TCRδ T-cell Receptor Delta
TF Transcription Factor
TLX1 T-cell Leukemia Homeobox Protein 1
TLX3 T-cell Leukemia Homeobox Protein 3
TSA Tyramine Signal Amplification
TUG1 Taurine Upregulated Gene 1
VRC Variable Resin Chemistry
XIST X-inactive Specific Transcript
ZEB2 Zinc Finger E-box-binding Homeobox 2
1. Introduction
1.1. The “new” RNA world – Long noncoding RNAs
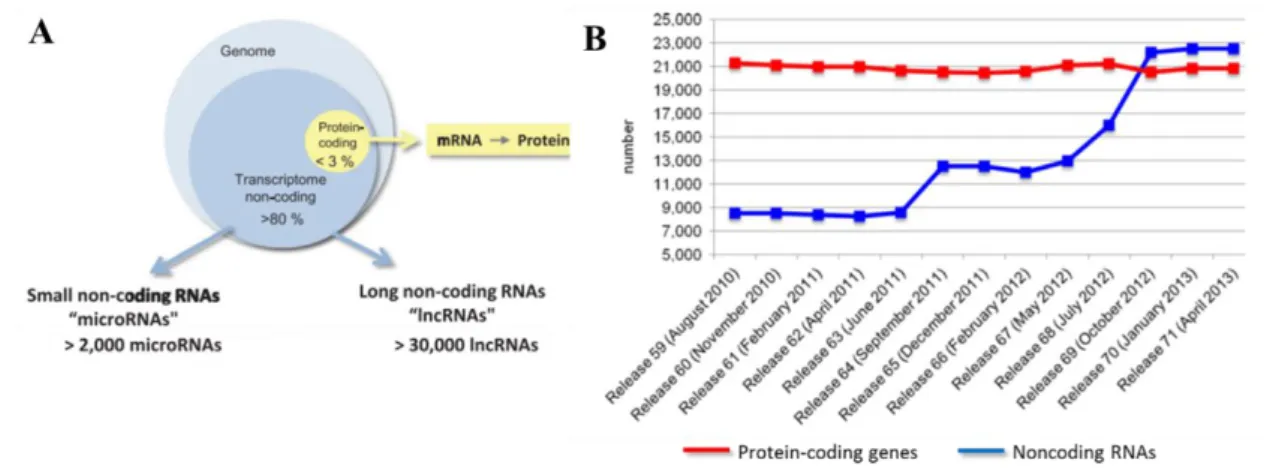
The general view of the genome and gene regulation in biology has been essential centred in protein-coding genes via the central dogma enunciated by Francis Crick in 1958: RNA is transcribed from DNA and translated into protein (Crick 1970). Since then, studies have pointed to the presence of large amounts of RNA that was transcribed but did not encode proteins which represents about 80% of the whole genome (Figure 1.1, A). The characterisation of these noncoding RNAs (ncRNAs) was restricted to a few housekeeping genes (including ribosomal RNAs, transfer RNAs and small nucleolar RNAs) and to a small number of regulatory RNAs (Rinn & Chang 2012). Currently, the number of novel ncRNAs has increased drastically and more is known about their function, biogenesis, length, structural and sequence features. According to their size, ncRNAs are divided into two major groups: small noncoding RNAs, including microRNAs, and long noncoding RNAs (lncRNAs) (Figure 1.1, A and B), that are a large and diverse class of transcribed RNA molecules with a length of more than 200 nucleotides that resemble messenger RNA in structure and size, but do not encode proteins. Only a relatively small fraction of lncRNAs have been so far characterised and we can’t start to classify different types of lncRNA according to their functions because we are still far from being able to predict the function of new lncRNAs. Nevertheless, from what has already been unravelled they are thought to carry out important regulatory functions, adding yet another layer of complexity to our understanding of genomic regulation.
Figure 1. 1 – Overview of the coding vs noncoding RNAs in the human genome. (A) Representation of the
relative percentage of protein-coding and noncoding. (Adapted from Uchida & Dimmeler, 2015) (B) Number of noncoding (blue line) and protein coding (red line) annotated on Ensembl until 2013. The x-axis indicates the number and the date of the release (Adapted from Bussotti et al., 2013).
1.1.1. Classification of lncRNAs
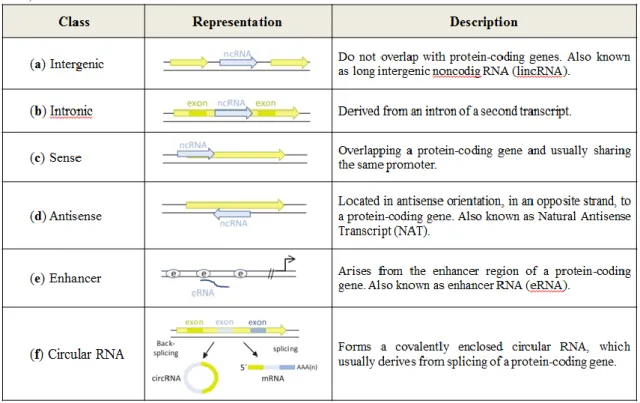
Long noncoding RNAs (lncRNAs) are generally transcribed by RNA polymerase II and undergo co-transcriptional modifications such as capping, polyadenylation and pre-RNA splicing. They harbour standard canonical splice site signals, but have less exons and are generally shorter than mRNAs (Derrien et al. 2012). The predicted open reading frames (ORFs) have a poor start codon and ORF contexts, therefore, the translation of lncRNAs is not likely to happen (Li & Chen 2013). As such, lncRNAs are defined as endogenous cellular noncoding RNA molecules longer than 200 nucleotides in length. In summary, they have small coding potential, can be spliced, capped and polyadenylated. A major feature is that these transcripts are differential expressed in tissues/cells or developmental stages (Bussotti et al. 2013). Some researchers have been classifying lncRNA based on their genomic proximity between neighbouring transcripts and established six main categories of lncRNAs: (a) intergenic or lincRNA; (b) intronic; (c) sense; (d) antisense or NAT (e) Enhancer or eRNA and (f) circular RNA (see details in Table 1.1).
Table 1. 1 – Classes of long noncoding RNA with their representation and description. In yellow are
represented protein-coding genes (Adapted from He et al., 2014; Mattick & Rinn, 2015 and Uchida & Dimmeler, 2015).
1.1.2. Function of lncRNAs
The first example of an lncRNA that was characterized as having a function was H19, in 1988. This lncRNA was identified as an RNA overexpressed during liver development in the mouse. The mouse H19 transcript lacked a large ORF, instead, only had small sporadic ORFs that were not evolutionarily conserved, that did not template translation in vivo and did not produce a recognizable protein product (Brannan et al. 1990). One year later, another ncRNA, termed XIST, was found to be expressed exclusively from the inactive X chromosome and then demonstrated to be required for X inactivation in mammals (Penny et al. 1996).
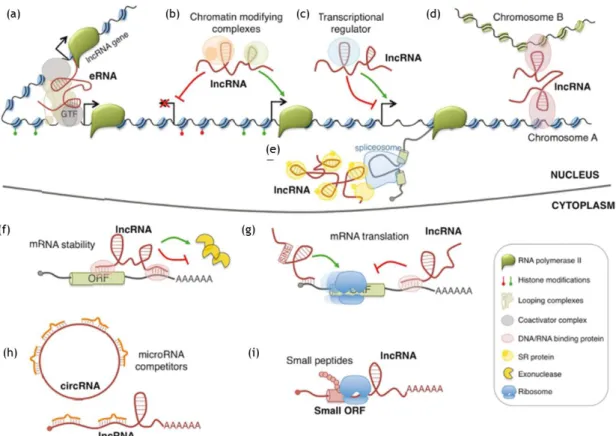
Nowadays, a large number of lncRNAs has been described and it’s known that they can influence many cellular processes such as spatial conformation of chromosomes, chromatin and DNA modifications, RNA transcription, pre-mRNA splicing, mRNA degradation, and mRNA translation. It has been reported that they can also produce small biological active peptides (see details in Figure 1.2) (Morlando et al. 2015).
Figure 1. 2 – Example models of lncRNA functions. Nuclear lncRNAs can regulate transcription by acting as
enhancer RNA (eRNA) (a), by recruiting chromatin modifying complexes (b), or regulating transcription factors activity (c). They can also regulate gene expression by acting on the spatial conformation of chromosomes (d) or affecting pre-mRNA splicing (e). mRNA expression can be affected by cytoplasmic lncRNAs which regulate mRNA stability (f), mRNA translation (g) and compete with microRNA binding (h). A few lncRNAs contain small open reading frames (ORFs) that can be translated in biological active small peptides (i). (Adapted from Morlando et al., 2015).
One of the most studied lncRNAs is the mammalian Airn (antisense of Igf2r noncoding RNA). Airn is located in antisense direction of Igf2r (insulin-like growth factor 2 receptor), using a bidirectional promoter. It can influence epigenetic events through transcription-dependent mechanisms resulting in the silencing of Igf2r transcription (Latos et al. 2012a).
Another example of lncRNA function can be described by TUG1 (taurine upregulated 1) and MALAT1 (meta- stasis associated lung adenocarcinoma transcript 1) that are linked to gene activation and repression through the organization of nuclear subdomains. These two transcripts bind Polycomb 2, but TUG1 binds methylated Polycomb 2 and MALAT1 binds the unmethylated protein. The methylation status of Polycomb 2 dictates a switch in both its lncRNA-binding specificity and nuclear sub compartment localization. This switch is accompanied by movement of Polycomb 2
target genes between active and repressive nuclear domains and ultimately influences downstream gene expression (Yang et al. 2011).
LncRNAs can also act as regulators of mRNA processing. Nascent pre-mRNAs are spliced and processed into one of potentially many isoforms. Alternative splicing and editing contribute to the increasing gene isoform diversity (Geisler & Coller 2013). LncRNA transcripts that have an antisense orientation to known protein-coding genes, also known as natural antisense transcripts (NATs), can influence splicing patterns of mRNAs. One example is the Zeb2NAT that interferes with the splicing of ZEB2 (zinc- finger E-box binding homeobox 2) pre-mRNA. Zeb2NAT expression inhibits splicing of an internal ribosome entry site (IRES)-containing intron. Translation of ZEB2 is dependent on this IRES, and therefore, expression of the NAT indirectly enables expression of ZEB2 protein (Beltran et al. 2008). ErbAα2 overlapping antisense transcript it’s another NAT which its expression controls the alternative splicing of the thyroid hormone receptor ErbAα2 mRNA to form two antagonistic isoforms (Sleckman et al. 1998). In general, the mechanism by which NATs influence splicing is still unclear, but it has been hypothesized to involve splice-site masking and a subsequent block in spliceosome recruitment (Faghihi & Wahlestedt 2009).
MALAT1 (mentioned above), which is an intergenic lncRNA, also affects splicing but through a more indirect mechanism. This lncRNA associates with interchromatin granules and has been implicated in alternative splicing through the modulation of active Ser/Arg splicing factors. Ser/Arg proteins are important regulators of alternative splicing and MALAT1 interacts with them and influences the nuclear distribution and levels of phosphorylated Ser/Arg proteins. The depletion of MALAT1 changes the alternative splicing patterns of the pre-mRNAs that they target (Tripathi et al. 2010a).
LncRNAs have also been implicated in nuclear organization through the scaffolding of sub-nuclear domains. Both coding and noncoding RNAs have been associated in the nucleation of histone locus bodies, paraspeckles and nuclear stress bodies. The best-studied lncRNA of this type is NEAT1, which is important for the de novo assembly of paraspeckles (sub nuclear domains that may mediate retention of hyperedited mRNAs in the nucleus) and this lncRNA is significant for the maintenance of these paraspeckles (Mao et al. 2011).
1.2. Long noncoding RNAs in Cancer
Cancer causes 20% of deaths in Europe with more than 3 million new cases and 1.7 million deaths each year. Since the Human Genome Consortium released its final draft of the human genome, in 2001, the study of lncRNAs have been strongly associated with cancer (Gutschner & Diederichs 2012). LncRNAs are implicated in serial steps of cancer development since they can interact with DNA, RNA, protein molecules and/or their combinations. Their deregulation confers capacities for tumor initiation, growth, and metastasis (Cao 2014).
Despite the small number of well characterized lncRNAs associated with cancer, they already have several possible clinical benefits by offering great potential as novel biomarkers for diagnosis, prognosis, metastasis and predicting response to therapy (Cheng et al. 2013). For example, overexpression of MALAT1 in small cell lung cancer is an indicator of early metastasis and poor prognosis (Gutschner et al. 2013). Other studies have been developing a target approach for lncRNAs (Lee 2012). The single-nucleotide resolution of the sequencing results allows characterization of the structure, potential function and disease-associated polymorphisms of the lncRNAs (Li & Chen 2013). Recent improvement of biological drugs has broadened the types of therapeutic targets, which enables strategies targeting RNA molecules (Davis et al. 2010). These strategies show promising results for the improvement of lncRNA-based cancer therapy (Li & Chen 2013).
1.2.1. T-cell differentiation and Leukemogenisis
This work will be focused in one specific type of blood cancer, T-cell Acute Lymphoblastic Leukaemia (T-ALL). To understand how this cancer develops, referred as leukemogenisis, is important to explain basic concepts of the immune system such as T-lymphocyte differentiation.
T-lymphocyte differentiation occurs in the thymus and requires the expression of several genes in a defined temporal manner. The main characteristic that separate cells from different phases of development is the cell surface receptors that are being expressed or unexpressed during each state of differentiation. Common lymphoid progenitors (CLPs) enter into the thymus through the cortico-medullary junction and initiate commitment to the T cell lineage. At this point the cells are called double negative (DN) thymocytes because they don’t express CD4+ or CD8+ receptors. The V, D, and J gene segments at the TCRβ, TCRγ, TCRδ or TCRα loci determine the development into either γδ or αβ T cell lineages. First, the T cell receptor (TCR) β, γ and δ loci becomes accessible and begins to be rearrange toward the γδ lineage for the expression of the pre-TCR, which helps drive cellular proliferation and leads to the CD4+8+ stage, also called double positive (DP) thymocytes (Sleckman et al. 1998). Pre-TCR surface expression, referred to as the β-selection process, is marked by arrest of TCRβ gene rearrangements and extensive cellular expansion. Afterwards, TCRα locus rearrangement leads to the expression of the mature TCR. Signals from the pre-TCR allow survival, cellular expansion and further differentiation of T-cells with productive rearrangement of the TCRβ (β-selection). The mature TCR, is triggered by its interaction with MHC molecules on thymic epithelial cells and allows the selection of TCR non-self-reactive thymocytes that recognize self-MHC molecules and the production of single positive (SP) mature T-cells (Figure 1.3).
Figure 1. 3 – T-cell differentiation process. T-cell differentiation occurs in the thymus where the ordered
somatic recombination of V, D, and J gene segments at the TCRβ, TCRγ, TCRδ or TCRα loci determine the development into either γδ or αβ T cell lineages. Progressive lineage restriction and acquisition of T cell potential following migration from the bone marrow to the thymus involve successive differentiation steps defined by the acquisition of a number of surface molecules, including CD5, CD1a, CD34, CD3, CD4, and CD8(Adapted from Graux et al. 2006).
The TCRα rearrangement is a highly regulated process, in which the TCRα enhancer (Eα) plays a primary role (Sleckman et al. 1998). The minimal Eα core contains binding sites for three transcription factors (TFs), LEF-1, RUNX1/AML1, and ETS1, which have been demonstrated to be crucial for the transcriptional and cis-chromatin opening activities of the Eα enhanceosome (Dadi et al. 2012).
Despite the differences between human and mouse thymocyte maturation, they both follow the same main developmental stages. Nevertheless, the understanding of the different processes and players in T-lymphocyte maturation comes mainly from experiments in mice (Graux et al. 2006).
1.2.2. T-cell Acute Lymphoblastic Leukemia
T-cell acute lymphoblastic leukaemia (T-ALL) is a blood cancer characterized by an uncontrolled increase in the number of immature T lymphocytes. It accounts for approximately 15% of paediatric and 25% of adult ALL cases. Even with improved
outcome, about 25% of children and 50% of adults still fail to respond to intensive chemotherapy protocols (Kalender Atak et al. 2013). The current therapies are highly toxic. The patients with primary resistance to chemotherapy and the ones who have relapsed after initial treatment have an extremely poor prognosis. In this context, the research for novel therapeutic strategies is extremely important (De Keersmaecker et al. 2014)
1.2.3. Genetic alteration related to T-ALL
Oncogenic events in T-ALL include transcriptional activation of proto-oncogenes, inactivation of tumor suppressor genes, and activation of signal transduction pathways, such as Notch1 pathway by NOTCH1 or FBXW7 mutations (Aifantis et al. 2008). TCR chromosomal translocations represent a frequent oncogenic hallmark of T-ALL (Cauwelier et al. 2006). This translocations are generally the result from mistakes on the V(D)J recombination events that lead to the ectopic activation of oncogenes owing to their relocation to the vicinity of potent cis-activating elements within the involved TCR locus.
A specific set of recurrently over-expressed transcription factors (TFs) have been documented in T-ALL, including TLX1, TLX3, TAL1, LMO1, HOXA, and NKX family members (Van Vlierberghe et al. 2008). T-ALL samples expressing each of these transcription factors show a characteristic gene expression signature and as such these transcription factors define distinct molecular subtypes in T-ALL (Vlierberghe & Ferrando 2012). Point mutations and small insertions/deletions have also been described leading to oncogenic events, like mutations that activate NOTCH1 in more than 60% of T-ALL cases (Weng et al. 2004), or mutations in cytokine receptors and tyrosine kinases such as IL7R and JAK3 (Kalender Atak et al. 2013).
Oncogenic nucleoporin fusions have been described in diverse types of hematologic malignancies, more frequently in acute myeloid leukemia (AML), but also in T-cell acute lymphoblastic leukemia (T-ALL) (Takeda & Yaseen 2014). A NUP214-ABL1 fusion was described in a series of patients with T-ALL (Graux et al. 2004). This fusion
is cytogenetically cryptic and is often located in amplified episomes. In T-ALL, NUP214-ABL1 is usually associated with rearrangement and/or overexpression of TLX1 or TLX3, although, in some patients there are more cells with abnormalities of these genes than with NUP214-ABL1, suggesting that the protein fusion is a secondary mutation (Graux et al. 2009).
Overexpression of the orphan homeobox (HOX) proteins TLX1 and TLX3 represents the most frequent oncogenic event due to chromosomal translocation in human T-ALL. TLX1 and TLX3 belong to a subtype of HOX proteins. They contain a highly conserved homeodomain (HD) that is known to be involved in DNA and protein-protein interactions (Holland et al. 2007).
Physiological expression of TLX1 and TLX3 is restricted to embryonic development and no specific function of these genes in the T cell lineage has been reported (Vlierberghe & Ferrando 2012). Transgenic expression of human TLX1 in mice induces an initial DN2 thymic block followed by development of aneuploid T-ALL, mitotic checkpoint defects, clonal TCRβ rearrangements, a mostly cortical phenotype, and a transcriptional profile similar to that observed in human TLX1+ T-ALLs (Dadi et al. 2012).
TLX3 overexpression is a result of the translocation t(5;14)(q35;q32) in approximately 25% of pediatric and 5%–10% of adult T-ALL cases (Hatano et al. 1991). Results have demonstrated that the maturation block observed in TLX+ T-ALLs is, in large part, due to ETS1-mediated TLX recruitment to the Eα core, leading to repression of Eα and blocked Vα-Jα rearrangement. Failure to express a TCRα gene, leads to the arrest development of αβ-committed thymocytes around β-selection, when a variety of cell-proliferation signals are likely to be maintained, hence contributing to oncogenesis (Figure 1.4). This blockage can be overcome by TLX1/3 abrogation or by down-stream TCRαβ expression within an appropriate cellular context. These observations have fundamental consequences both for targeted therapy in TLX+ T-ALLs and for the role of aberrant TCR expression in T lymphoid oncogenesis (Dadi et al. 2012).
Figure 1. 4 – TLX-Mediated Repression of the TCRa Enhancer. Transcriptional access to the TCRα locus at the
late double-negative (DN) to CD4+8+ stage is regulated primarily by the function of the Ea enhancer, shown bound by its transcriptional activators ETS-1, RUNX1, and LEF1. The onset of Va-Ja recombination begins with transcription from the TEA promoter and increased histone acetylation throughout the Jα region. In a subset of T cell acute lymphoblastic leukaemia where TLX1 or TLX3 are misexpressed (bottom), ETS-1 can recruit TLX1/3 to Ea and this correlates with an enrichment of repressive histone modifications and lack of TCRA gene expression, ultimately leading to an arrest in differentiation (Adapted from (King et al. 2012).
1.2.1. LncRNA expression during T-cell development and
differentiation
The knowledge of long non-coding RNAs in immune systems is so far limited. John S. Mattick’s group was the first to discover a lncRNAs expressed in CD8+
T cells and suggested that many of these transcripts likely play roles in adaptive immunity (Pang et al. 2009). There is a well-established role of transcription factors as instructive signals for cell differentiation toward a given lineage, however, other features, including components of epigenetics, can regulate the maintenance of cellular states (Ranzani et al. 2015).
Several studies have identified an important contribution of lncRNAs to the development and function of adaptive immune cells. The analysis of lncRNA expression during T-cell development (RNA-seq data from 42 different T-cell types at various developmental and differentiation stages) led to the identification of 1,524 genomic regions expressing lncRNAs that are specific for lineage or developmental stage (Hu et al. 2013).
Another example is a research focused in studying the expression of lncRNAs in CD4+ T cells during development and activation. In this study they analyse several lncRNAs in different stages of T cell differentiation and compare the expression levels between different stages. They found that the expression profiles of lncRNAs in different stages of CD4+ were significantly different and that many lncRNAs may exert their function through certain mRNAs that play pivotal roles in T-cell development and activation. This study suggests that the expression of lncRNAs can regulate and were correlated with the expression of neighbouring mRNAs (Xia et al. 2014).
Recently, a lncRNA profiling in human T- and B-lymphocytes at different differentiation stages identified over 500 previously unknown lncRNAs (Ranzani et al. 2015).
1.3. Genome research of long noncoding RNAs
LncRNAs are one of the emerging topics in genome research. They can be associated with gene regulatory networks, and their deregulation may be involved in a large number of complex diseases (Figure 1.5). Taking into account more than 500 publications, the database of experimentally verified lncRNA-related diseases (LncRNADisease) did a short list of 321 lncRNAs that are associated with 221 diseases where the most common is cancer (Chen et al. 2013).
Figure 1. 5 – Several types of diseases associated with lncRNAs. The number shown for each type of disease is
the number of lncRNAs found associated with the disease by experimental evidence on interactions‚ epigenetics‚ mutation‚ expression‚ and genomic location (Adapted from Nguyen & Caninci 2015).
The screening of lncRNAs for potential therapeutic targets is being developed and several lncRNAs have been shown as promising biomarkers in diagnosis and prognosis.
LncRNAs can be poorly conserved between species, contrasting with protein-coding genes and shorter RNAs, which leads to an additional uncertainty about whether a given lncRNA is functional. In situ hybridization, genomic, and the perturbation of their expression by overexpression and mediated knockdown are important tools to explore the roles of lncRNAs (Yan et al. 2012).
1.3.1. Expression of lncRNA
Determining under what conditions and in what cells the lncRNAs are expressed can provide significant perceptions into their function (Atkinson et al. 2012).
Studies in mouse and human demonstrated that many lncRNAs are expressed in a cell- and tissue-specific manner during development and differentiation, which suggests
that they might participate in the regulation of these biological processes (Amaral & Mattick 2008).
RNA sequencing is a good technique to quantify transcripts and enables expression levels to be easily compared across different conditions and tissues, without the need for complicated normalization methods. An RNA-seq study revealed that 78% lncRNAs are expressed as tissue-specific compared to only ∼19% of the coding genes (Cabili MN et al. 2011). Another RNA-seq study has analysed the transcriptomes of 102 prostate cancer samples, defining 121 lncRNAs whose expression patterns distinguish two stages of cancer development (Prensner et al. 2011). Similar RNA-seq studies that analyse the dynamic lncRNA expression across different conditions and developmental stages in health and disease will provide comprehensive, sensitive and high-resolution data of lncRNA expression regulation (Atkinson et al. 2012).
1.3.2. Stability of lncRNA
One of the aspects of lncRNAs that is poorly understood is their post-transcriptional regulation and their metabolism in the cell. RNA levels within a cell are determined by the rates of transcription, RNA processing, and RNA decay (Windhager et al. 2012). The general expectation is that lncRNAs are less stable than protein-coding mRNAs due to their lower average level of expression and the existence of known unstable classes of lncRNAs, however, recent studies have suggested that, like has been seen for mRNAs, lncRNAs also have a wide diversity of half-lives (Dinger et al. 2009). The variation in lncRNA stability is consistent with their functional diversity and is possible that it is a reflection of their complex post-transcription regulation. Actually, post-transcriptional regulation seems to be particularly important for lncRNAs because they do not have any further translational and post-translational opportunities for regulation like protein-coding genes have (Clark et al. 2012).
Metabolic pulse labelling of nascent RNA is a powerful approach to assess the kinetics of RNA metabolism and enables the determination of their half-life. Activated uridine analogues, like 4-thiouridine (4sU), have been used to measure nascent RNA
synthesis and their metabolism at single nucleotide level with high sensitivity (Windhager et al. 2012). A genome-wide study using metabolic pulse labelling with a uridine analogue have determined similar median half-lives for mRNA and ncRNA around 3.4h in HeLa cells (Tani et al. 2012). Another genome-wide study that used treatment with actinomicin D, instead of metabolic labelling, to determine transcripts half-life reported a median half-life of 3.5h (mean 4.8h) for lncRNAs and 5.1h (mean 7.7h) for protein-coding transcripts (Clark et al. 2012).
1.3.3. Subcellular localization and single molecule quantification of lncRNA
The knowledge of the subcellular localization patterns can provide fundamental insights into the biology of lncRNAs and suggest potential molecular roles. Unlike mRNAs, which localize manly in the cytoplasm to produce their proteins, lncRNA themselves probably localize in their particular site of action, making their location within the cell important. A study in human cell lines suggests that ∼30% of lncRNAs are found exclusively in the nucleus, ∼15% are found exclusively in the cytoplasm, while ∼50% show both nuclear and cytoplasmic localization (Kapranov et al. 2007). Sequencing studies cannot discriminate whether an lncRNA localizes in the nucleus or cytoplasm, and so there is as yet no systematic categorization of lncRNA localization patterns. This feature may be due to the fact that the expression of most lncRNAs tends to be lower than mRNA, and so their total abundance is likely far lower, which can restrict the number of sites in which a lncRNA may be active (Cabili et al. 2015).
One hypothesis is that, even with the low average abundance of lncRNAs, a small numbers of cells in the population might express high numbers of lncRNA, and this could allow an increased number of sites of action in those cells (Dinger et al. 2009). RNA fluorescence in situ hybridization (FISH) is a technique that can address these questions and propose potential mechanisms for lncRNA activity (Singer & Ward 1982). One of the best studied lncRNAs is XIST in which RNA FISH demonstrated that it accumulates on the inactive X-chromosome (Clemson et al. 1996). Recent examples of lncRNAs that were studied by FISH include MALAT1 and NEAT1 which were
localized to nuclear bodies (Ip & Nakagawa 2012). However, these examples represent highly abundant RNAs in the cell, though, the majority of lncRNAs are considerably less expressed, which difficult the use of conventional RNA FISH techniques that have quite low sensitivity (Cabili MN et al. 2011). One improvement of conventional RNA FISH is the application of single-transcript imaging that allows the validation of regulatory interactions. Single-molecule RNA FISH (smRNA-FISH) can provide quantitative in situ measurements of a variety of different transcripts and highlight the behaviour of the lncRNAs in the specific tissue or cell type that is being analysed. For example, in tumor models, single-molecule transcript imaging can enable the visualization of transcriptional heterogeneity in tumor progression and the relation between spatial context and phenotypic states of cells, represented by their expression signatures (Itzkovitz & van Oudenaarden 2011).
1.4. Aims of the Study
Although several lines of recent evidence highlight the importance of lncRNAs in regulatory gene expression networks, little is known about their role in T-cell differentiation and leukemic transformation. The present work is inserted in a project that aims at gaining a novel insight into the biology of lncRNAs in the context of leukemogenesis with the ultimate purpose of finding possible transcript targets for RNA therapeutics in T‐ALL. To reach this goal the proposed methodology combines high-throughput epigenomics, transcriptomics and systems biology approaches with techniques to monitor synthesis, lifetime and sub-cellular localization of lncRNAs. The analysis is focused on primary T-cell precursors purified from the mouse thymus and on cellular mouse models of T-ALL.
The main goal of the present study is to develop functional assays to monitor synthesis, lifetime and sub-cellular localization of lncRNAs in a cellular mouse model of T-ALL. The candidate lncRNAs that will be analysed by these functional assays will be provided by the genome-wide transcriptomic analysis of different stages of T-cell leukemic transformation.
2. Methodology
2.1. Cell culture
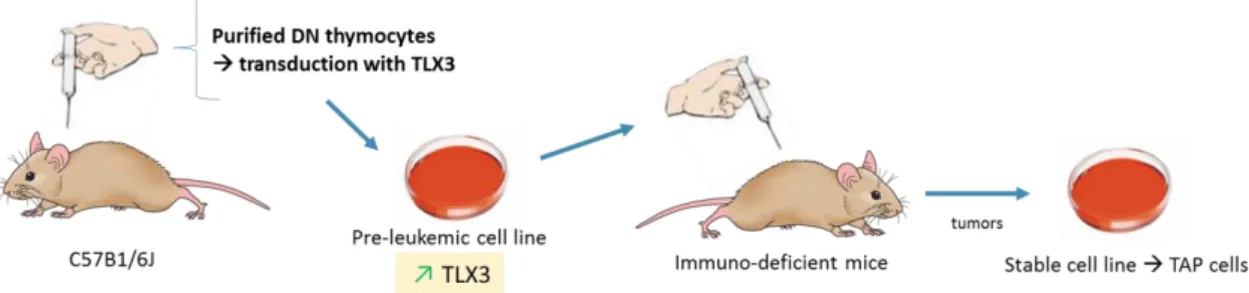
The cultured cells used in the work were produced in our collaborators laboratory, Pierre Ferrier Lab, in France. In their laboratory, double negative (DN) thymocytes were purified from mice’s thymus and transduced with the oncogene TLX3. TLX3 encodes a DNA-binding nuclear transcription factor that interacts with the transcription factor ETS1 which binds to Enhancer α and leads to maturation arrest (by inhibiting TCR rearrangements). The cells transduced with TLX3 were injected in an immune-deficient mice that developed T-ALL and the cells obtain from the tumors in lymphoid organs, named TAP cells, were stabilized in cell culture (Figure 2.1) (Dadi et al. 2012). We then received frozen TAP cells and cultured them in suspension in RPMI 1640 medium with 10% fetal bovine serum and 2mM L-glutamine at 37°C and 5% CO2.
Figure 2. 1 – Scheme of the T-ALL cell culture model developed by Dadi et al. 2012. Double negative (DN)
thymocytes were purified from mice’s thymus and transduced with the oncogene TLX3. These cells were then were injected in an immune-deficient mice that developed T-ALL and the cells obtain from the tumors were stabilized in a immortalized cell culture.
2.2. RNA extraction, purification and quantification
Total RNA was extracted from cells using PureZOL (Bio-Rad) followed by DNase I treatment (Roche) according to the manufacturer’s instructions. Reverse transcription was carried out with the High Fidelity cDNA synthesis Kit (Roche) according to the manufacturer’s instructions, using random hexamers. Quantitative real-time PCR (qPCR) was performed using iTaqUniversal SYBR Green Supermix (Bio-Rad) in the Vii7 Real-Time PCR System (Applied Biosystems). Gene-specific primers are presented in Table 1 in the supplementary material. Each sample was run in duplicate. The 2−ΔCt method was used to measure the relative changes in transcript levels using GAPDH as normalizer. At least three biological replicates were performed for all target RNAs.
2.3. DNA extraction, purification and sequencing
For total DNA extraction the cells were washed in PBS, ressuspended in Lysis Buffer (50mM Tris-HCl pH8.0; 150mM NaCl; 100mM EDTA; 1% SDS) supplemented with 0.1mg/ml of Proteinase K (Sigma) and incubated overnight at 55ºC. The genomic DNA was then recovered by phenol/cloroform extraction and ethanol precipitation. Standard PCR was performed using NZYLong DNA polymerase (NZYTech) with the followed parameters of the thermal cycler: 5 cycles of 5min at 95°C, 1min at 95°C, 1min3sec at 65°C; 35 cycles of 2min at 68°C, 1min at 68°C, 45sec at 95°C, 45sec at 65°C; 1 cycle of 1min 30sec at 68°C and 1 cycle of 10min at 68°C. The primers used to amplify and to sequence the PCR products are listed in Table 6.1 in the supplementary material. The presence of the PCR products was confirmed by agarose gel electrophoresis and the bands purified with High Pure PCR Product Purification Kit (Roche) according to the manufacturer’s instructions. The purified PCR products were sequenced by STABVIDA (http://www.stabvida.net)
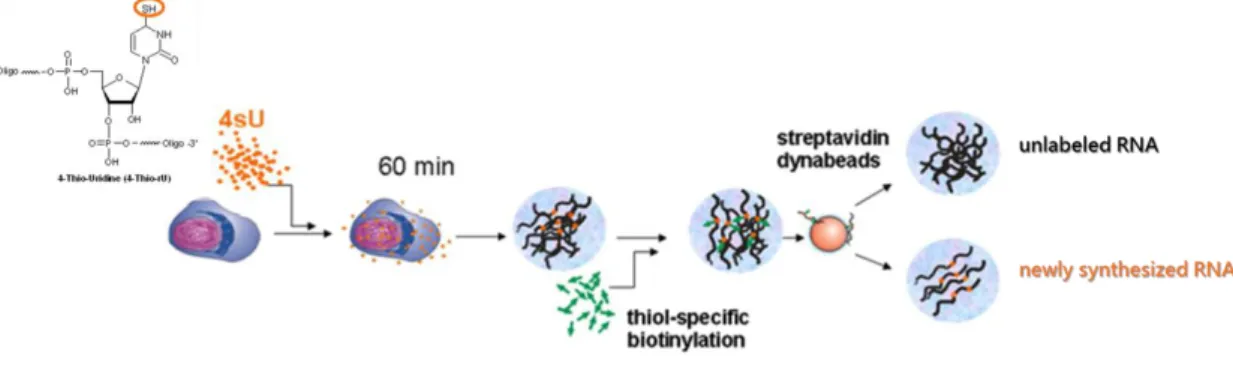
2.4. Labelling with 4sU-tagging
To measure transcript stability we carried out pulse labelling with the uridine analogue 4-thioridine (4sU) followed by isolation of total cellular RNAs and purification of labelled (newly synthesized) and unlabelled (pre-existing) RNA (Windhager et al. 2012) (see scheme of the protocol in Figure 2.2). Exposure of eukaryotic cells to 4sU (500μM, 60min) results in its rapid uptake, phosphorylation to 4sU-triphosphate, and incorporation into newly transcribed RNA. The protocol was performed as described by Dölken et al. 2008. Briefly, following isolation of total cellular RNA with PureZOL (Bio-Rad), the thiol-labeled RNA was biotinylated using EZ-Link Biotin-HPDP (Pierce). The cellular RNA was then quantitatively separated into labelled (newly transcribed) and unlabelled (pre-existing) RNA with high purity using µMACS streptavidin-coated magnetic beads (Miltenyi) in μMACS columns (Miltenyi) placed in an OctoMACS Seperator magnetic stand (Miltenyi). Finally, labelled RNA was recovered from the beads by simply adding a reducing agent, dithiothreitol (15,4mg/mL) that cleaves the disulphide bond and releases the newly transcribed RNA from the beads.
Figure 2. 2 – Scheme of the technique of Pulse labeling with 4sU-tagging. 4-thioridine (4sU) is an uridine
analogue that incorporate the RNA when it’s being synthetized. The separation of the labeled from unlabeled transcripts is based on the high affinity of 4sU to biotin (Adapteded from Rädle et al. 2013).
The ratios of newly synthesized/total RNA obtain by RT-qPCR after 60minutes of incubation with 4sU, allows non-invasive access to precise RNA half-life according to the formula given in Figure 2.3 (Rädle et al. 2013). The samples were normalized do Gapdh according to its known half-life of 7 hours (Kudla et al. 2006).
Figure 2. 3 – Mathematical equation used to determine the transcript half-life developed by Rädle et al. 2013.
The key factors are the labeling time, which was 60min, and the ratio between newly synthetized and total RNA.
2.5. LNA-RNA single-molecule FISH
Fluorescence in situ hybridization (FISH) is a method to detect specific nucleic acids in their cellular environment. The analysis of individual RNAs hybridized with a single FISH probe makes possible the counting of an RNA transcript with high spatial resolution (Trcek et al. 2012a). Locked nucleic acid (LNA) is a nucleic acid analogue that contains at least one nucleotide monomer with a bicyclic furanose ring locked in a conformation mimicking RNA (See Figure 2.4).
Figure 2. 4 – Representation of the chemical structures of DNA, RNA and locked nucleic acid (LNA) nucleotide
units (Adapted from Astakhova 2014).
LNA probes provide better specificity and sensitivity and have demonstrate much higher thermal stability and higher melting temperatures when hybridized with target RNA sequences compared to unmodified counterparts (Vester & Wengel 2004). In this work we used one LNA probe for each transcript. The probes were labelled at the
5’end with either biotin, for mRNA detection, or digoxigenin for lncRNAs detection. The sequences are listed in Table 6.7 in the supplementary material.
For hybridization the cells were allowed to adhere onto poly-L-lysine coated coverslips, washed with PBS and fixed with 3.7% PFA/5% acetic acid/1xPBS for 15 min at room temperature (RT). Following fixation the cells were washed 3x5min at RT with 1xPBS/2mM VRC permeabilized in 75% ethanol and stored at -20ºC in 75% ethanol/2mM VRC. Before hybridization the cells were re-hydrated in PBS, digested with 0.1% pepsin in 0.01 M HCl with 2mM VRC for 1min at 37ºC and fixed with 3.7% PFA/1xPBS for 5 min. After 3 washes in PBS and a 5 min wash in 2xSSC/0,05% Tween20, the cells were hybridized at 55°C (30°C bellow the RNA Tm of the probes) for 1 hour with the LNA probes (Exiqon) at 40nM in hybridization mix (50% formamide/2xSSC/10% dextran sulphate/50mM sodium phosphate pH7.0. Stringent post-hybridisation washes were with 0,1xSSC/0,05% Tween 20 3x5min at 65°C. For detection of the hybridized probes the samples were subject to Tyramine Signal Amplification (TSA) system or Enzyme-Labeled Florescence (ELF) signal amplification system.
2.5.1. Tyramine Signal Amplification (TSA) system
TSA system provides enhanced sensitivity of the signal to further detection methods. The Horseradish Peroxidase (HRP) reacts with hydrogen peroxide and the phenolic part of tyramide produces a quinone-like structure with a radical on the C2 group, becoming activated. Activated tyramide then rapidly and covalently binds to all nearby tyrosine residues with proximity to the initially immobilized HRP site (Figure 2.6) (Bobrow et al. 1992).
Figure 2. 5 – Simplified scheme of TSA system for RNA detection. The LNA probes bind complimentary to the
sequence of RNA. The 5’ end of the probe was labeled with digoxigenin (DIG) or biotin (BIO). After hybridization HRP-conjugated streptavidin or HRP-anti-digoxigenin antibody were added to detect biotin or digoxigenin respectively, followed by the HRP substrate Alexa Fluor 546 or Alexa Fluor 647 tyramide (Adapted from Shi et al. 2012).
In this work the Tyramide Signal Amplification Kit (Molecular Probes® by Life Technologies™) was used according to the manufacturer’s instructions. Briefly, the cells were incubated in blocking buffer (1% BSA in PBS) for 30 min at room temperature. Then HRP-conjugate streptavidin (dilution 1:200 from the stock provided in the kit) or HRP-conjugate anti-digoxigenin (Abcam; dilutions tested 1:200, 1:1000 or 1:2000), both in blocking buffer, was added to the cells and incubated at room temperature for 30 min. For the multiple detections, after the first incubation with HRP-conjugate, HRP was deactivated by incubation with 1%H202 in PBS for 10 min and
proceeded to the next incubation with the other HRP-conjugate. After three washes in 1xPBS at 37°C, signals were amplified with labeled tyramide working solution (Alexa Fluor 546 or Alexa Fluor 647 tyramide at a 1:100 dilution in amplification buffer/0,0015% H2O2) for 10 min. The coverslips were then counterstained in 1mg/ ml
Hoechst 33342 (Molecular Probes®) for 5 min and mounted in Prolong® Diamond Antifade Mountant (Life Technologies™).
2.6. Imaging acquisition and analysis
Samples were imaged using a Spinning Disk Confocal Microscope (Zeiss Axio Observer) equipped with an Evolve 512 EMCCD camera (Photometrics®) and an Yokogawa CSU-x1 confocal scanner (Andor). A Plan-Apochromat 100x oil- immersion objective, N.A. 1.40, was used for all imaging experiments. Briefly, after randomly selecting cells in a field, a 3D stack viewed image was taken with 0.3mm increments in the z-direction and a total of 35 sections.
2.7. RNA-seq libraries
RNA samples for Deep sequencing were prepared in Pierre Ferrier’s Laboratory (Centre d'Immunologie de Marseille-Luminy, France). Deep sequencing was performed by Centro de Análisis Genómico (CNAG), Spain. The sequences obtained from the Illumina Genome Analyzer (stranded total RNA-seq with >135M reads) were aligned against the mouse genome (mmusculus.9).
2.8. Data analysis
The reads alignment to a reference genome was performed with TopHat-Bowtie2 version 2.0.9. The input arguments used were the mouse genome mmusculus.9, and the .fastq files containing the reads from both ends. In order to get only the unique alignments for a given read to the reference genome and eliminate the duplicates, the “-g” parameter was set to 1; “--num-threads” and “--mate-inner-dist” were also changed to 4 and 100, respectively, but all the remaining additional default options were left unaltered.
In order to get the fragments per kilobase of exon per million fragments mapped (FPKM) values and the differentially expressed genes, the annotation files and the
mapped reads were processed by cuffdiff tool using the 1 wild-type samples (RAGZ) against the 3 (TL3-1_1, Tumeur7_2 and TAP1B) T-ALL samples. In order to find the genes that were up- or downregulated in the samples, the downstream analysis was performed with customized scripts in R 3.1.0. The “gene_exp.DIFF” file resulted from cuffdiff analysis was filtered to include a false discovery rate (FDR) of 0.05 and a fold change of 1.5.
The differential expression of lncRNAs was obtain by running the RNA-seq data against the NONCODE v.4 database (Xie et al. 2014) and for the protein coding gene, the analysis was against the UCSC database.
3. Results
Recent findings have revealed that lncRNAs are implicated in serial steps of cancer development. LncRNAs are transcripts with more than 200 nt in length and no evident ORFs. These lncRNAs can interact with DNA, RNA and protein molecules acting as essential regulators in chromatin organization, transcriptional, splicing and post-transcriptional regulation. Their differential expression confers the cancer cell capacities for tumor initiation, growth, and metastasis (Cao 2014). Despite recent evidence highlighting the importance of lncRNAs in regulatory gene expression networks, little is known about their role in T-cell differentiation and leukemic transformation.
The main goal of the project where this work is inserted is to identify and validate lncRNAs as potential targets for RNA therapeutics in T cell acute lymphoblastic leukaemia (T-ALL). In this present work, we developed a methodology to monitor the stability of lncRNA transcripts by metabolic labelling with 4sU (Chapter 3.1) and a methodology to visualize the sub-cellular localization of lncRNA/mRNA molecules by the use of fluorescence in situ hybridization with LNA oligonucleotidic probes and confocal microscopy (Chapter 3.2). For the purpose of methodology development the lncRNA analysed in this study were selected from the literature and their expression in the T-ALL cellular model experimentally validated. The candidate lncRNAs that will be analysed by these assays in the future will be provided by genome-wide transcriptomic analysis of different stages of T-cell leukemic transformation (Chapter 3.3).
3.1. Analysis of lncRNA stability in a T-ALL cellular model
Cellular RNA levels are determined by the interplay of tightly regulated processes for RNA transcription and degradation. It has been proposed that the half-life of each mRNA is closely related to its physiological function, so it is possible that the RNA stability of lncRNAs also reflects their function. Two independent research groups
reported that non-coding RNA (ncRNA) half-lives vary over a wide range that is comparable with that of mRNAs. In this perspective, ncRNAs with short half-lives may have regulatory functions while those with long half-lives could be involved in housekeeping functions (Clark et al. 2012; Tani & Torimura 2013).
The most widely used method for genome-wide analysis of RNA stability is based on the use of transcriptional inhibitors such as actinomycin D (ActD), 5,6-dichloro-1– D-ribofurano-syl-benzimidazole (DRB) and α-amanitin (α-Am) (Tani & Akimitsu 2012). ActD inhibits transcription initiation and elongation by intercalating into DNA, while DRB and α-Am specifically inhibit RNA Polymerase II-mediated transcription. Even though transcriptional inhibitors have been widely used for determining RNA stabilities, inhibitor-mediated global transcriptional arrest has a deeply disruptive impact on cellular physiology, including splicing and polyA (Tani et al. 2012; Friedel et al. 2009).
4-thiouridine (4sU) has been used to label endogenous RNAs in mammalian cells as a non-disruptive technology for measuring RNA decay. 4sU is rapidly taken up by cells and after entering a cell, is phosphorylated by cellular uridine kinases. With the use of 4sU, additional steps, such as electroporation or lipofection, are not necessary for labeling RNA and has minimal adverse effects on gene expression (Tani & Akimitsu 2012). For this reasons we decided to follow this approach to measure the half-lives of lncRNAs in T-ALL cells.
3.1.1. Searching the literature for lncRNAs with a potential role in T-ALL
Before starting to implement the previously describes methodologies in the laboratory, we did a search in the literature and databases for lncRNAs that could have a relevant function in T-ALL and to be analysed in the study. We started by a review of the protein-coding genes that have been reported to be involved in genetic lesions that define molecular-genetic subtypes in T-ALL and other recurrent genetic alterations (Vlierberghe & Ferrando 2012). We also investigated lncRNAs that could be expressed
in this type of cells using published Chip-seq data (Hu et al. 2013) obtain from T-cell and expression levels from the NONCODE database (database for noncoding transcripts – http://www.noncode.org/). From this investigation we obtained a list of candidates that could be relevant in the context of our cellular model (see tables 3.1 and 3.2).
Table 3. 1 – Genes involved in T-ALL and the the presence of nearby lncRNA. The reads referred in the table
were obtain by the analysis of Chip-seq data from the study Hu et al. 2013.
T-ALL genes
Reads of mRNAs in
mouse’s tymocytes Presence of lncRNAs
Reads of lncRNAs in mouse’s tymocytes
Jak3 ~120 No lncRNA annotated nearby. At 5’end there is a slight antisense signal.. <10 Notch1 ~600
Has a transcript at its 5’end that overlaps the first exon classified as antisense to the next gene.
~134 Jak1 ~1700 lncRNAs. There’s antisense signal. Has a cluster nearby of intergenic ~281 Tal1 <10 No lncRNA annotated nearby.
Tlx1 <10 Has an antisense annotated in Ensembl
(Tlx1os). <10 Tlx3 <10 Has an antisense annotated in Ensembl
(Gm12116). <10 Cdkn2a/2b <10 Has 2 noncoding transcripts (one sense
and one antisense) <10 Gata3 ~600
Has an antisense that overlaps a splice junction annotated in Ensembl ( Gm13256-001).
~84 Nup214 ~380 Has an antisense noncoding transcript,
ENSMUST00000156387. ~200-600 Il7r ~17 No lncRNA annotated nearby. Has some
antisense signal in the first exon. <10 Ezh2 ~800 Has an antisense lncRNA annotated. ~70-100 Zeb2 ~34 Has an antisense lncRNA, Zeb2NAT. <10 Lyl1 ~11 No lncRNA annotated nearby.
Bcl11b ~4600 No lncRNA annotated nearby. Has
antisense signal. ~697 Hoxa13 <10 Has the linRNA Hottip nearby. <10 Nkx2-5 <10 Has a lincRNA nearby. <10 Daxx <10 Has an antisense annotated (Ak136742). <10 Nrip2 <10 Has an antisense annotated (lnc1552). <10 Fadd ~80 Has an antisense (Faddos). ~12