How do policy incentives influence the
adoption of Electric Vehicles?
Elitza Vladimirova Ivanova
Dissertation submitted as partial requirement for the conferral of
Master in International Management
Supervisor:
Prof. António José Correia Vieira da Silva,
Prof., ISCTE Business School, Management Department
Lisbon, Portugal
2
How do policy incentives influence the adoption of Electric
Vehicles?
Elitza Vladimirova Ivanova
- S
p
in
e
-
i3
ABSTRACT
Battery electric vehicles (BEVs) are an effective way to reduce fossil fuel consumption and greenhouse gas emissions. BEVs result in lower energy consumption, greenhouse gas emissions, and urban air pollution compared to internal combustion engine vehicles (ICEVs). Although the uptake of EVs has been significant in a short period of time, most government goals for adoption have not been met and the number of BEVs on the road is still low. Therefore, in order to reduce current greenhouse gas emissions from the transport sector, a vast number of governments have implemented different policy incentives, aiming to stimulate the mass adoption of electric vehicles. The policy makers have introduced two main types of policies – purchase-based and use-based. This work seeks to determine the relationship of those policy incentives to the market deployment of BEVs to mainstream consumers with demographics and vehicle attribute preferences most common to today’s new vehicle purchasers. Moreover, this research argues that policies intending to stimulate the uptake of BEVs should not focus on mainstream consumers, but instead they should refocus on niche markets and early adopters, targeting them differently. Regarding to that, this work also presents findings, that that there are two main groups of early adopters – high-end and low-end adopters, which have different socio-economic profile and different opinions of their vehicles with high-end adopters viewing their BEVs more preferentially. BEV policies approaching early adopters and niche markets differently would create complementary system that will lead to increased BEV market penetration and realization of intended societal benefits.
Keywords: Battery Electric Vehicle, Adoption, Policy Incentives, Early Adopters, Greenhouse
Gas Emissions.
4
ABSTRACT
Os veículos eléctricos a bateria são uma forma eficaz de reduzir o consumo de combustível fóssil e a emissão de gases de efeito de estufa. Os VEB para além de terem como resultado um consumo de energia e emissão de gases significativamente mais reduzidos, têm um impacto menor na poluição atmosférica urbana, em comparação, aos veículos com motor de combustão interna.
Embora a receptividade dos VE tenha aumentado significativamente num curto período de tempo, a maioria dos objetivos governamentais e incentivos à adopção de VE ficaram aquém e consequentemente, o número de VE na estrada é consideravelmente baixo.
Com o objectivo de reduzir a emissão de gases de efeitos de estufa provenientes do sector dos Transportes, um vasto número de entidades governamentais implementou diversas políticas de incentivos com a finalidade de estimular a adopção em massa de VE. Os decisores políticos introduziram dois tipos de medidas: baseadas na compra ou na utilização.
Este trabalho de investigação visa determinar a relação destas políticas de incentivos com o desenvolvimento do mercado de VE para consumidores mainstream, com características demográficas e preferências de atributos mais comuns aos novos compradores de veículos. Essencialmente, esta investigação tem como argumento que os focos deveriam ser mercados de nicho e novos consumidores (early adopters), ao invés de consumidores mainstream.
Esta investigação apresenta, ainda, resultados como a distinção de dois grupos de early adopters - high-end and low-end adopters – que têm diferentes perfis socioeconómicos e diferentes preferências quanto à escolha dos veículos. As políticas dedicadas aos veículos eléctricos a bateria dirigidas a mercados de nicho e early adopters iriam criar uma forma complementar de impulsionar a penetração de mercado dos veículos eléctricos a bateria e a concretização dos benefícios sociais pretendidos.
Palavras-chave: Veículos Eléctricos a Bateria, Adoção, Incentivos politicos, Emissão do efeito
estufa.
5
ACKNOWLEDGMENTS
First of all, I would like to express my sincere gratitude to my supervisor, Prof. Antonio Vieira da Silva, for his guidance and recommendations, as well as for all the availability and encouragement throughout all this work. Without him this work would not be possible.
Secondly, I thank my family, in particularly my parents, who have gave me the opportunity to make this work, and who have always expressed their trust, sympathy, inputs and patience towards me.
Lastly, I thank all the others who have somehow listened to my despairs and who made me fought for this achievement.
6
GLOSSARY
AFV – Alternative Fuel Vehicles BEV – Battery Electric Vehicle CO₂ – Carbon Dioxide
CSO – Car Sharing Organizations EV – Electric Vehicles
EVSE – Electric Vehicle Supply Equipment FCEV – Fuel Cell Electric Vehicles
GDP – Gross Domestic Product GHG – Greenhouse Gas
HEV – Hybrid Electric Vehicle ICE – Internal Combustion Engine
IPEEC – International Partnership for Energy Efficiency Cooperation ITC – Integrated Transaction Control System
LDV – Light Duty Vehicles MBD – Million Barrel per Day NOK - Norwegian Krone NOx – Nitrogen Oxides
OEM – Original Equipment Manufacturer PHEV – Plug-In Electric Vehicle
REEV – Range Extended Electric Vehicles TWh – Terawatt Hours
7
Table of Contents
1. Introduction ... 9
2. Literature Review and Theoretical Background ... 11
2.1 Literature Review ... 11 2.2 Energy Efficiency ... 11 2.3 IPEEC Organization ... 12 2.4 Transport Sector ... 13 2.5 Electric Vehicles ... 21 2.5.1 Types of Vehicles ... 21 Conventional Vehicles ... 21
Battery Electric Vehicles (BEVs) ... 22
Hybrid Electric Vehicles (HEVs) ... 22
Plug-In Hybrid Electric Vehicles (PHEVs) ... 23
Range-extended electric vehicles (REEVs) ... 24
Fuel Cell Electric Vehicles (FCEVs) ... 24
2.5.2 Electric Vehicles Charging ... 25
Plug-In Charging ... 25
Wireless Charging ... 26
Battery Swapping ... 26
3 The Effect of Policy Incentives on Electric Vehicle Adoption ... 29
3.1 Electric Vehicle Market ... 29
3.2 Policy Incentives for Electric Vehicle Adoption ... 33
3.2.1 Policy Measures Types ... 33
Purchase-Based vs. Use-Based ... 33
Financial Incentives ... 34
Types of Financial Incentives ... 36
3.2.2 Factors influencing EV Adoption ... 39
Differentiation of Target Groups ... 39
Intrinsic vs. Extrinsic Motivation ... 40
Price, Driving Range and Charging Time ... 41
Context Factors ... 42
EV’s Specific Factors ... 42
Effectiveness and feasibility of policy incentives ... 43
3.3 Differentiation of Policy Incentives Impacts ... 43
8
3.3.2 Strategies ... 45
3.3.3 Car Sharing ... 45
3.3.4 Markets Focus on Early Adopters ... 46
3.3.5 High-End and Low-End Early Adopters ... 47
3.4 Barriers Adopting EV ... 51
4 A Policy Comparison between Norway and Portugal ... 52
4.1 Norway ... 52 Country’s Profile ... 53 Economy ... 53 Electricity ... 54 Electricity Price ... 55 Transport ... 56 Policy Description ... 56 4.2 Portugal ... 62 Country’s Profile ... 62 Economy ... 63
Electricity and Electricity Prices ... 64
Transport ... 65
Policy Description ... 67
5 Conclusion ... 70
9
1. Introduction
The society of today is intensively engaged with sustainability and how to reduce local emissions in order to respond adequately to the present environmental changes. One of the first steps taken will be to guarantee climate-friendly mobility. Moreover, electric drive technology exists for more than a century but it was not a viable transport option due to limited range and production costs when compared with the internal combustion engine technology. Only recently, with battery technology development, electric cars come into scene again and many studies have been done in order to evaluate the benefits of transport electrification in terms of energy and emissions reductions.
Therefore, despite the fact that the global and local markets of light duty electric vehicles (EVs) are still at their infancy, the age of the automobile with internal combustion engines may be over. The global crisis caused by our devotion to internal combustion engine vehicles, which belch forth nearly a quarter of the world’s CO2 emissions and take about 1.3 million lives each year, has risen convictions that the only exit possible would be the death of the traditional automobile (Seiler 2018).
This thesis focuses on the deployment of light duty electric vehicles (EVs) and moreover, on the policies taken to incentivize the development of the EVs’ market. Main purpose behind that incentivization is to keep up with the latest standards invented to diminish the plenty of emissions caused by our daily car usage.
First, an overview of the Global Energy Efficiency will be presented in order for the readers to see what CO₂ percentage the transportation sector globally takes and what are the International goals needed to be reached for making the automotive sector more environmental friendly.
Second, a specification of the different types of electric vehicles, which have been introduced onto the global market, will be presented and the benefits of driving daily an electric vehicle will be assessed.
Third, a deeper look into the policies, launched to incentivize the deployment of EVs will be taken, and more specifically, what are the determinants which should be taken into account so that a particular policy stimulus will have a positive impact on potential EV adopters.
Finally, a policy comparison between Norway, as one of the global leaders of automotive electrification, and Portugal, a country which aims to catch up with the global green
10
standards, will be made in order to assess if the policy incentives have a direct impact on the EV deployment uptake. In this regard, the comparison between those two countries will serve as an example as this work does not include conducted interviews due to the initial research stages, which the electric vehicle market shows, and because of the fact that the majority of data gathered is taken from studies that sample members of the general population and not actual adopters of the vehicles.
11
2. Literature Review and Theoretical Background
2.1 Literature Review
The study of the policy incentives influence on the electric vehicle adoption posits two main blocks for the literature review. The first one refers to the energy efficiency and the evolution of the transport towards a more sustainable and regulated sector, which incorporates the work of various organizations in this field. The second one focuses on the development of electric vehicles, which are seen as a main opportunity to make the transportation less polluting to the environment.
2.2 Energy Efficiency
At its essence, energy efficiency defines as using less energy to provide the same service. Energy efficiency is everywhere, which means that opportunities for improvements can also be found everywhere – from residential buildings to transport to energy-intensive industries.
Its importance goes beyond reduced energy demand and associated cost savings as a matter of fact that energy efficiency can deliver multiple benefits to many different stakeholders and it is one of the most cost-effective ways to reduce carbon emissions in the energy sector (Renewable Energy & Energy Efficiency Partnership 2012).
The challenge behind its effectiveness is that increasing energy efficiency costs money up front, which in many cases will be paid back in the form of reduced energy costs within a short time of period. Despite significant investments in energy efficiency (around 231 billion USD in 2016) a vast majority of economically viable energy efficiency investments remain untapped (Poullikkas 2015).
However, the international policy agenda in recent years shows that things are changing and that energy efficiency has been increasingly prioritised. Governments are becoming more and more aware of the importance of energy efficiency to achieve energy security and overall balance in the energy system – in addition to its cost-effectiveness and multiple benefits. Furthermore, new models show that energy efficiency will be paramount to achieving the GHG
12
emissions reductions that are necessary in the energy sector to attain the goals of the Paris Agreement (United Nations/Framework Convention on Climate Change 2015).
The role of international cooperation is a key means for governments to progress energy efficiency implementation at the national and sub-national levels. It allows countries to share existing good practices, knowledge and technological solutions among peers as well as to collectively work towards energy efficiency standards and goals, where relevant. In doing so, they can accelerate the design and deployment of energy efficiency policies and technologies in a cost-effective way, leading to greater global uptake of energy efficiency and helping it become the “first fuel”.
2.3 IPEEC Organization
IPEEC is an autonomous partnership of nations founded in 2009 by the Group of Eight (G8) to promote collaboration on energy efficiency. Its membership now includes 17 of the Group of 20 (G20) economies, which represent over 80% of global energy use and over 80% of global greenhouse gas emissions (Lesage, Van de Graaf, and Westphal 2010).
IPEEC provides information to decision makers in major economies, facilitating candid discussing for exchanging ideas and experiences on energy efficiency. It helps countries undertake joint projects to develop and implement energy efficiency policies and measures on a global scale.
13
In the previous year, 2017, IPEEC focused on supporting energy efficiency improvement through the activities of its country-led task groups in the following areas: appliances and equipment, buildings, industrial energy management, electricity generation, transport, finance, data and top ten best practices and best available technologies. Nine of IPEEC's task groups progress work under the G20 Energy Efficiency Leading Programme (the Leading Programme) - the G20's first long-term framework for energy efficiency, for which IPEEC serves as the lead coordinating organization in cooperation with other major international organizations (International Energy Agency 2017a).
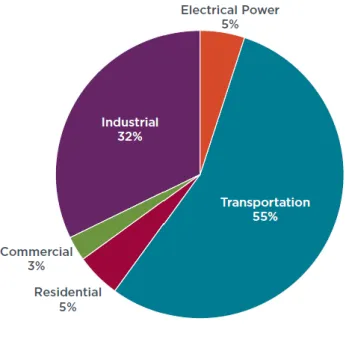
Figure 1. (IPEEC 2017) illustrates what percentage of global oil each of the different sectors consumes. It is evident that the transportation consumes more than the half of the global oil, which is an argument about how crucial the efficiency of this sector is.
As this work focuses on the policies taken in order to make the automotive sector more sustainable, a deeper look into the statistics of the transport sector will be taken with the purpose to show that constant improvements are needed for reducing the carbon emissions of the light-duty vehicles.
2.4 Transport Sector
The world has over 1.5 billion motor vehicles today with future projections that that number will surpass 2 billion by 2020. The transport sector consumes about 48 million barrels of oil per day (MBD), against current global oil consumption of 93 MBD (Administration 2018). More than half of global oil production goes to fuel the transport sector (Figure 1), which
14
is almost entirely powered by oil. As a result the transport related greenhouse gas (GHG) emissions have significantly grown over the past years and account for more than quarter of today’s global greenhouse gas emissions. Moreover, Fulton, 2009, expects that without significant technological innovation or policy intervention this development will continue and transport related GHG emissions will double by 2050. Road transport is the biggest contributor to these GHG emissions and their potential future growth (Fulton, Cazzola, and Cuenot 2009; Meyer, Leimbach, and Jaeger 2007).
In 2010, almost a quarter of all anthropogenic CO₂ emissions, 8.8 gigatons (Gt), came from the global transport sector (Figure 2). Within the transport sector, on-road vehicles accounted for about three-quarters of fuel consumption (35 MBD) and CO₂ emissions (6.5 Gt) (IPEEC 2017).
Currently, the transport sector accounts for around 23% of total global energy use, and it is estimated that this may more than double by 2040 as a result of projected increases in the number of light-duty vehicles and associated fuel consumption (Renewable Energy & Energy Efficiency Partnership 2012). Besides the fact that the transport sector plays a vital part in world economic growth in moving people and goods throughout the world, it also has a significant and growing environmental footprint. The transport sector consumes more than half of global oil production, and releases nearly a quarter of all anthropogenic carbon dioxide emissions. Motor vehicles and engines, especially those fueled with diesel, contribute to ambient air pollution responsible for millions of premature deaths worldwide each year.
15
Moreover, assessing the motor vehicle energy efficiency and emissions control programs of the IPEEC’ country members shows that substantial societal benefits have accrued to those G20 nations that have adopted clean fuel and vehicle policies identified in this policy brief. For a complementary package of tailpipe emission and fuel quality standards, public health benefits consistently and substantially exceed societal costs, indicating that such policies are cost-effective. Similarly, a significant body of evidence demonstrates that vehicle fuel economy and CO₂ standards achieve major reductions in carbon emissions and oil use while simultaneously providing fuel savings and financial benefits to consumers. This indicates a number of policy opportunities for G20 countries. To facilitate future collaboration, three grouping of G20 countries according to current policy status and recommended future actions are proposed in the Table ES-1 (IPEEC 2017).
Later on in this paper the policies of two countries – Norway and Portugal taken to incentivise the deployment of electrical vehicles, will be compared. According to this classification Portugal as a member of the European Union is included in Group 1, which among the rest of the groups shows constant working on its world-class emission standards. Norway as a country, located in Europe, but neither member of the EU nor a member of the G20 countries, is in spite of that one of the major economies working progressively on the launching of more incentives to expand its electric vehicle market.
Overall, G20 countries possess an immense opportunity to help bring forth a fleet of higher-efficiency, lower-emission vehicles. In 2014, G20 countries accounted for over 90% of
global vehicle sales. The policies adopted by G20 members thus largely dictate the air pollution, fuel consumption, and CO₂ emissions of the global transport sector. Furthermore, a collective
16
G20 commitment would amplify the impact of these policies and promote sharing of best practices and technology developments among regions. Technical assistance among G20 countries for policy and program design, development, and implementation would accelerate cost-effective policy actions. The publication of the G20 Energy Efficiency Action Plan, held in Brisbane, Australia in 2014, is an important outcome of the G20 summit. Increased collaboration on energy efficiency has significant importance as G20 countries consume 80% of the world's energy output. A mutual work can help spur economic growth, enhance energy security, and improve the environment all over the world. Furthermore, international business efficiencies can be improved through the alignment of energy efficiency approaches and standards (Thiel, Perujo, and Mercier 2010b).
The Energy Efficiency Action Plan identified six focus areas for collaborative activity, including motor vehicles, which is characterized as a new area where the G20 could add value by addressing an emerging challenge or a gap in existing international collaboration. With regard to motor vehicles, the stated objective is to improve energy efficiency and emissions performance.
Globally, major economies regulate their vehicle markets with some type of vehicle tailpipe emissions and/or fuel economy standards. However, many of the various national and regional standards lag best practice in terms of stringency, compliance and enforcement. Accordingly, there is great potential in many countries and regions to adopt world-class standards that would drive investment in clean vehicles and fuels and more fully deploy proven, cost-effective technologies and solutions (Gnann and Plötz 2015).
17
Therefore, most countries around the globe have chosen to adopt European tailpipe emissions standards as fastest regarding development (IPEEC 2017). Figure 3 (IPEEC 2017) illustrates the progressive reductions in particulate matter emissions by the Euro standards for light-duty vehicles (LDV) and heavy-duty trucks. The European standards are designated by Arabic numerals for light-duty vehicles and Roman numerals for heavy-duty vehicles, and have progressed from Euro 1/I (1992) through Euro 6/ VI (2015). Today, the most advanced European emission control standards are called Euro 6 for light-duty vehicles, and Euro VI for HDV. Additionally, from the Figure 3 could be seen the dramatic effect that each successive Euro vehicle emissions standards has had on particulate matter.
In the recent years, Japan and Europe are home to the world's most efficient fleets of new passenger vehicles, and Europe's 95 g CO₂ /km is designated the world-class emission standard. Even though, it is interesting that about three-quarters of global light-duty vehicle sales occur in markets regulated by efficiency standards that drive down CO₂ emissions through 2015 (ICCT 2018). These standards only apply to new motor vehicles, and do not require any changes to the existing vehicle fleet. Figure 4 (ICCT 2018) compares all new passenger vehicle fuel economy standards that have been adopted or proposed worldwide, showing their historical progression and future performance targets. Vehicle efficiency
18
requirements are shown in terms of both CO₂ emissions (left axis) and fuel consumption (right axis).
These regulations take different approaches, using various drive cycles and vehicle certification test procedures. Light-duty vehicle regulations typically result in fuel savings that greatly exceed the costs of efficiency-improving technologies. New electrified vehicle concepts have already entered the market in Europe. The expected gains in environmental performance for these new vehicle types are associated with higher technology costs. In parallel, the fuel efficiency of internal combustion engine vehicles and hybrids is continuously improving, which in turn advances their environmental performance but also leads to additional technology costs versus today’s vehicles (Thiel, Perujo, and Mercier 2010a). Additionally, most of the analyses done so far claim large environmental benefits associated to electric driving versus driving with combustion engines.
19
Overall, Table 4 (IPEEC 2017) shows that a large fraction of the G20 countries are already achieving world-class standards for vehicles and fuels. Specifically, the European Union and its member states, Canada, Japan, South Korea and the USA have all adopted world-class standards. The EU member states that are also individual G20 members - Germany, the United Kingdom, France, and Italy - are individually listed in the table, but it is important to note that the European Commission sets European-wide vehicle and fuel standards that these countries and other European Union member states are obliged to follow. As an example, the achievement of the targets as outlined in the European Renewables Directive (Directive 2009/28/EC) was taken as a basis for calculating the 2020 CO₂ intensity of electricity generation and for the renewable content of the road fuels. For the CO₂ intensity of the future electricity mix, the policy measures of 20% GHG emission reduction in 2020 compared to 1990 levels in the EU and further energy efficiency improvements as outlined in the New Energy Policy scenario in DG TREN (2008) were additionally applied to the renewables target (Directive 2009/28/EC).
20
However, the Paris Agreement announces in December 2015 its objective of limiting the increase in the global average temperature to well below 2°C above preindustrial levels and that efforts towards limiting the temperature increase to 1.5°C above preindustrial levels will be pursued (United Nations 2015). The Figure below depicts the GHG emissions reductions that could be compatible with this target by looking at two carbon budgets that reflect two possible IEA scenarios (U.S. Energy Information Administration 2017):
1170 GtCO₂ of cumulative emissions for the 2015-2100 period, as in the IEA Two Degree Scenario (2DS), providing a 50% chance of limiting average future temperature increases to 2°C
750 Gt CO₂ of cumulative emissions for the 2015-2100 period, as in the Beyond Two Degree Scenario (B2DS), coupled with a 50% chance of limiting average future temperatures increases to 1.75°C.
In both cases represented in the following Figure 3 (U.S. Energy Information Administration 2017), energy-related GHG emissions need to reach net-zero in the second half of this century: close to 2060 for the B2DS and close to 2090 for the 2DS. The transport sector, accounting for more than 23% of global energy-related GHG emissions, needs to deliver major emissions cuts for countries to achieve their goals.
In all IEA scenarios a large role plays the electrification of transport aiming to achieve the decarbonization of the energy system, where increasing transport electrification goes along with decarbonizing the electricity sector (U.S. Energy Information Administration 2017). Undoubtedly, the electrification of the transport sector plays crucial role for the IEA targets.
21
Therefore, with zero tailpipe emissions in the case of full-electric driving vehicles, EVs also offer a clean alternative to vehicles with ICEs by helping to reduce exposure to air pollution resulting from fuel combustion and limiting noise. The importance of EVs for the reduction of air pollution and noise is well demonstrated by the leading role that cities assume in promoting EV deployment: in 2015, nearly a third of global electric car sales takes place in just 14 cities (Hall, Moultak, and Lutsey 2017). Major global urban centers also tend to witness higher electric car market penetration compared to their country averages.
2.5 Electric Vehicles
There is a general perception of the EVs as an environmentally benign technology. Electric vehicles couple with low-carbon electricity sources and offer potential for reducing greenhouse gas emissions and exposure to tailpipe emissions from personal transportation. In considering these benefits, it is important first to get a better understanding about the electric vehicles itself and to distinguish the different types of the electric two-wheelers.
2.5.1 Types of Vehicles
Vehicle manufacturers presently use five main types of electric vehicle technology. These technologies vary in the way the on-board electricity is generated and/or recharged, and in the way the internal electric motor and combustion engine are coupled. The mix of battery capacities, charging capabilities and technological complexity provides consumers with a choice of options when it comes to vehicle ranges, refueling options and price (Kley, Lerch, and Dallinger 2011).
Conventional Vehicles
Conventional vehicles use fossil fuels (petrol or diesel) to power an internal combustion engine. While driving, they produce noise and exhaust emissions that pollute air. Conventional vehicles are inefficient, only about 18 to 25% of the energy available from the fuel is used to move it on the road. Such vehicles have been mass-produced for over a century, and a substantial support infrastructure comprising vehicle manufacturing, repair and refueling facilities has accordingly been developed (Hawkins et al. 2013).
22
Battery Electric Vehicles (BEVs)
BEVs are powered solely by an electric motor, using electricity stored in an on-board battery. The battery must be regularly charged, typically by plugging in the vehicle to a charging point connected to the local electricity grid. BEVs have the highest energy efficiency of all vehicle propulsion systems, typically able to convert around 80% or more of the energy stored in the battery into motion. The electric motor is particularly efficient, and regenerative braking provides further efficiency gains. Regenerative braking systems help keep the battery in an electric vehicle charged, by converting into electricity much of the energy that would normally be lost at heat through traditional braking.
There are no exhaust emissions while driving a battery electric vehicle. This helps to improve local air quality. The greatest benefits for the environment occur when BEVs are powered by electricity from renewable sources. However, there are fewer emissions even when electricity comes from the average mix of renewables and fossil fuels used presently in Europe (Berggren and Magnusson 2012). For instance, in the EU-28, in 2014, almost 30% of electricity is produced from renewables.
BEVs, however, still have somewhat limited driving ranges compared to conventional vehicles and typically need a long time to recharge the on-board batteries. BEVs tend to have large batteries to maximise the energy storage capacity and hence allow longer driving ranges. These large batteries generally cost more than those used in hybrids. However, battery costs per kilowatt-hour (kWh) tend to be less expensive for BEVs (Newbery and Strbac 2016).
Hybrid Electric Vehicles (HEVs)
HEVs have been commercially available for more than 15 years. They combine an internal combustion engine and an electric motor that assists the conventional engine during, for example, vehicle acceleration. The battery of an HEV cannot be charged from the grid but is typically regenerative braking or while the vehicle is coasting.
As an HEV is predominantly powered by its conventional engine, hybridisation can be regarded as a technology added to conventional vehicles with the aim of increasing fuel efficiency, reducing pollutant and CO₂ emissions, rather than being an entirely separate type of vehicle. HEV typically have lower fuel consumption and exhaust emissions than conventional technologies. The more sophisticated the hybrid system, the greater the potential
23
to lower emissions. Many different types and models of HEVs exist, ranging from “micro-HEVs”, whose only fuel-saving feature is regenerative braking and where the electric engine on its own is not capable of powering the vehicle, through to “full HEVs”, which are able to drive small distances in electric-only mode (Al-Alawi and Bradley 2013).
The ways in which the conventional engine and electric motor are joined can also differ across different HEV models. Parallel hybrids employ an electric motor and a combustion engine that are connected so they power the vehicle together. Series-parallel hybrids, or power-split hybrids, combine power from conventional and electric motors to drive the wheels but, unlike a parallel hybrid, these vehicles can be driven from the battery alone, although typically only at low speeds for short distances. Their configuration can allow the vehicle to be powered 100% from the conventional engine, 100 % from the electric motor or in any intermediate ratio, e.g. 30% electric motor and 70% combustion engine.
Batteries for hybrids, both plug-in and non-plug-in, tend to be more expensive than the ones for battery electric vehicles in terms of price per kWh. This higher price is mainly because hybrid vehicles require greater power-to-energy performance (Al-Alawi and Bradley 2013).
Plug-In Hybrid Electric Vehicles (PHEVs)
PHEVs are powered by an electric motor and an internal combustion engine designed to work either together or separately. The on-board battery can be charged from the grid, and the combustion engine supports the electric motor when higher operating power is required or when the battery’s state of charge is low (Zhou, Levin, and Plotkin 2016).
The electric driving range is smaller than for BEVs, as the batteries tend to have smaller capacities. The batteries can have less energy storage capacity because they rely less on electrical power alone to power the vehicle. As an example, the battery capacity in PHEVs is designed more for short trips in the city or commuting, than for long-distance journeys. However, as for REEVs, the combustion engine allows a much longer overall driving range.
Batteries for PHEVs tend to be more expensive than for BEVs in terms of price per kWh. This higher price is mainly because PHEVs require greater power-to energy performance. The environmental impact of PHEVs depends on their operation mode. Running in all-electric mode results in zero exhaust emissions, but relying only on the conventional engine can lead to fuel consumption and emission levels equal or higher than those of conventional vehicles of similar size, because the additional battery increase the vehicle mass. Moreover, as for BEVs,
24
the overall environmental performance of PHEVs depends greatly on the share of renewables in the electricity generation mix. PHEVs can be financially attractive for drivers if the electricity used is cheaper than the petrol or diesel that would have otherwise been used (Zhou, Levin, and Plotkin 2016).
Range-extended electric vehicles (REEVs)
REEVs have a serial hybrid configuration in which their internal combustion engine has no direct link to the wheels. Instead the combustion engine acts as an electricity generator and is used to power the electric motor or recharge the battery when it is low. The on-board battery can also be charged from the grid. The electric motor is therefore solely responsible for directly powering the vehicle. On advantage of REEVs is that the conventional engine can be small, as it is needed only when the vehicle exceeds its electric driving range. This helps reduce the vehicle’s weight. As for a PHEV, an REEV overcomes the problem of a restricted driving range associated with BEVs because it can be fuelled at conventional filling stations (Min, Ye, and Yu 2013).
Fuel Cell Electric Vehicles (FCEVs)
FCEVs are also entirely propelled by electricity. In this case, the electrical energy is not stored in a large battery system, but is instead provided by a fuel cell ‘stack’ that uses hydrogen from an on-board tank combined with oxygen from the air. The main advantages of FCEVs over BEVs are their longer driving ranges and faster refuelling, similar to those of a conventional vehicle. Because of the current size and weight of fuel cell stacks, FCEVs are better suited for medium-sized to large vehicles and longer distances. Fuel cell stack technology is in an earlier stage of development than the technologies described above and few models of FCEVs are currently commercially available. Further technological development is needed for FCEVs to improve their durability, lower the costs and establish a hydrogen fuelling infrastructure, including standalone stations or pumps for hydrogen (Vehicle and Explained 2003).
25
2.5.2 Electric Vehicles Charging
As the driving range of many electric vehicles is limited, the type of technology used to charge them, and the time it takes, are very important to consumers. There is even a definition explaining that fear of being stranded with a dead battery miles from a plug, called range anxiety (Bonges and Lusk 2016). However, only battery and fuel cell electric vehicles are totally reliant on charging infrastructure. As the hybrid vehicles also contain a conventional internal combustion engine, it is not critical for them.
In general, there are three basic ways to charge an electric vehicle: plug-in charging, battery swapping or wireless charging.
Plug-In Charging
In Europe plug-in charging is used by the vast majority of current BEVs and PHEVs. Vehicles are physically connected to a charging point using a cable and a plug. Plug-in charging can occur wherever charging stations are located: at homes, in public streets or on commercial or private premises. Electric vehicles can be charged using normal household domestic sockets, although it is a slow process because normal domestic sockets provide only a low amount of electric current. It can therefore take about eight hours for a typical charge. However, this can be quite suitable for overnight charging. Faster plug-in charging requires specialised infrastructure. Today, most public plug-in stations established at a city, regional or national level offer only normal-speed charging (EC 2013).
There are four different ways in which battery electric vehicles of PHEVs can be charged via plug-in charging. Each of them can involve different combinations of power level supplied by the charging station (expressed in kW), types of electric current used (alternating AC) or direct (DC) current), and plug types. The power level of the charging source depends on both the voltage and the maximum current of the power supply. This determines how quickly a battery can be charged. The power level of charging ranges widely, from 3.3 kW to 120 kW. Lower power levels are typical of residential charging points.
Mode 1 (slow charging) allows vehicle charging using common household sockets and cables. It is commonly found in domestic or office buildings. The typical charging power level is 2.3 kW. Household sockets provide AC current.
26
Mode 2 (slow or semi-fast charging) also uses a non-dedicated socket, but with a special charging cable provided by the car manufacturer. A protection device that is built into the cable offers protection to the electrical installations. It provides AC current.
Mode 3 (slow, semi-fast or fast charging) uses a special plug socket and a dedicated circuit to allow charging at higher power levels. The charging can be either via a box fitted to the wall (wall box), commonly used at residential locations, or at a stand-alone pole, often seen in public locations. It uses dedicated charging equipment to ensure safe operation, and provides AC current.
Mode 4 (fast charging) delivers direct current (DC) to the vehicle.
Big disadvantage of high-power, fast charging is that the stronger current is lost during transfer, which means that the efficiency is lower. Furthermore, fast charging can decrease battery lifetime as it reduces the number of total charging cycles. Fast DC charging points are also around three times as expensive to install as a simple AC charger, which is a main reason why so many users are reluctant to invest in the additional costs. While some new electric vehicle models are provided with a DC charging facility, others require the purchase of an additional charging device (Genovese, Ortenzi, and Villante 2015).
Wireless Charging
Instead of a fixed physical connection between the charging facility and the vehicle, the wireless charging system creates localised electromagnetic field around a charging pad, which is activated when an electric vehicle with a corresponding pad is positioned above it. The wireless method currently operates at only a selected few pilot locations and is yet to be used commercially.
Battery Swapping
Battery swapping involves replacing a used battery with a fully charged one at a particular swapping station. This offers a rapid way of quickly recharging a vehicle. At present, no major providers in Europe offer battery swapping. A number of barriers have prevented
27
battery-swapping technology from becoming widespread, including the lack of electric vehicle models that support the system, no standard type or size of battery, and the high cost of developing the associated charging and swapping infrastructure.
The power level of the charging source depends on both the voltage and the maximum current of the power supply. This determines how quickly a battery can be charged. The power level of charging points ranges widely, from 3.3 kW to 120 kW. Lower power levels are typical of residential charging points.
Behind all the technical specifications, it is obvious that the battery industry has world-changing ambitions. Until recently, it was a transition that many found unthinkable. The internal combustion engine has been the main way of powering vehicles on land and at sea for most of the past century. Huge expansion for lithium batteries for electric vehicles is under way (Economist 2017). The top five manufacturers – Japan’s Panasonic, South Korea’s LG Chem and Samsung SDI, and China’s BYD and CATL – are ramping up capital expenditure with a view to almost tripling capacity by 2020. The vast $5bn gigafactory Tesla is building with Panasonic in Nevada is thought to already be producing about 4GWh a year. Tesla says it will produce 35GWh this year. Just four years ago, that would have been enough for all applications across the whole world.
However, the total cost of ownership of an electric vehicle compared to a vehicle with an internal combustion engine is still two or three times higher due to the costs of their batteries. That is why all the big producers are adding capacity in part because it drives down unit costs. Lithium-ion cells (the basic components of batteries) cost over $1.000 a kilowatt-hour in 2010, last year they were in the $130-200 range (Economist 2017). Lower costs are not only improvements, large amounts of R&D investment have led to better power density (more storage per kilogram) and better durability (more discharge-then recharge cycles). Moreover, there is no doubt that electric vehicles are getting better and cheaper. But the constraints on their charging are still major factor for considering to adopt an EV. As an example, in Britain 43% of car owners do not have access to off-street parking and thus aren’t able to charge them at home (Bonges and Lusk 2016). Possibly, like petrol stations, the answer will be fast-charging stations as a way how some car companies are beginning to build them in order to assuage the “range anxiety” that turns some drivers off electric vehicles.
28
Building a vast charging infrastructure is a major point in the electric vehicle’s deployment. The following table shows the development of the number of publicly accessible charging positions in the European Union.
What could be seen from the chart (EAFO 2017a) above is the fact that the charging infrastructure is becoming widely available throughout the European Union. But besides the number and distribution, the types of charging points have also a major role. Several
European studies concluded that, in most scenarios, it is possible to ensure everyday mobility using only common electric vehicles charging overnight at home. But such conclusions focus only on everyday mobility in urban areas and disregard long-distance trips (Hall, Moultak, and Lutsey 2017). Moreover, consumers remain concerned that electric vehicles have a limited range. This explains probably also the fact why the number of high-power charging stations have a positive growth from 2014. By installing infrastructure that recharges vehicle batteries quickly, long-distance trips would be also accommodated.
29
3 The Effect of Policy Incentives on Electric Vehicle Adoption
3.1 Electric Vehicle Market
Higher electric vehicle sales are crucial if manufacturers are to reach tougher emissions targets. Electric vehicles can decrease the dependence of the transport sector on fossil fuels, which has environmental advantages. Moreover, a decrease of local exhaust emissions can increase the air quality and decrease health problems that are related to air pollution (Green, Skerlos, and Winebrake 2014). On a global level, EVs decrease the CO₂ -emissions related to personal transport. In this regard, statistical look of the European EV market will be taken in order to get a better understanding of how fast the attractiveness and deployment of the EVs is developing.
Europe marks year 2013 as an important momentum with sales of electric mobility moving beyond the margin of 1% in some countries. On the regulatory side, the European Commission shows support for the further adoption of electric vehicles by proposing a directive on the deployment of alternative fuels infrastructure in January 2013 which
explicitly supports clean fuel transport and proposes specific targets on enabling infrastructure deployment. At a more granular level, in the same year several European countries are seeing remarkable growth rates. Norway is the clear market leader with EVs adding up to 6.2% of the total car sales in 2013. Country’s share of EVs in new sales reaches 12% of new vehicle registrations in November 2013 (1.434 of a total of 12.079) (McKinsey 2014).
30
In 2017 Plug-in vehicle sales in Europe is 307.400 units, 39% higher than for 2016 including all Battery Electric Vehicles (BEV) and Plug-in Hybrids (PHEV) in the passenger cars and light commercial vehicle categories. The Plug-in share of the European light vehicle market reaches 1.74% for the same year, the share is over 2% during the last 4 months and reaches 2.55% in December. The top-5 plug-in models in Europe are Renault Zoe EV, BMW i3 EV/EREV, Mitsubishi Outlander PHEV, Nissan Leaf EV and Tesla Model S. Pure EVs (BEV) stands for 51% of the volume, PHEVs for the rest. A mere 174 units of Fuel Cell Vehicles is delivered, 40 units more than 2016 (Database 2017).
In general, almost all European countries post strong growth rates for 2017, many of them in triple digits. In 2018 around 430.000 Plug-ins are expected to be delivered in Europe, 41% more than in 2017. This translates to 2.4% share in a total European light vehicle market, expected to reach 18 million sales. In Norway, where Plug-in shares are the world’s highest, with 32.5% in 2017, BEV and PHEV combined, a clear highlight on the market could be seen. In December 2017, Norway reaches 42% and, counting only passenger cars, 50% of December
31
Table X Table Y
sales are electrically chargeable vehicles. Moreover, compelling savings on vehicle taxes, toll exemptions and a well-developed charging infrastructure pave the way for the mass adoption of Plug-Ins. For 2025, the plan is to ban sales of fossil fuel vehicles altogether, in Norway (Table X). In comparison, Portugal also ranked among the 15 top countries deploying EVs, reaches around 5.000 EVs (BEVs and Plug-ins), showing around 130% positive growth in 2017 (Database 2017).
To sum up, the European sales history shows a consistent trend towards higher plug-in sales for the last 7 years. Table Y contains an anomaly in 2015 and 2016 when a 2-step reduction in tax incentives for PHEV in the Netherlands causes a run on these vehicles at the end of 2015. This is followed by a drastic decline in PHEV sales in 2016, another spike in Q4 and a further slump in 2017. Netherlands Plug-in sales contracts from 43.300 units in 2015 to 9.700 within 2 years. Still, European Plug-in sales increases by 39% last year, 1/3rd can be attributed to growth in Germany (Database 2017). The projection for 2018 is another 41% increase to around 430.000 units. This assumes that incentives remain on current levels and that supply meets volume demand.
The article “Electric Vehicles in Europe Gearing up for a new Phase” 2014 shows the McKinsey research about the main drivers of the adoption of electric mobility in Europe which are consumer demand, industry developments and government stimulus (McKinsey 2014).
Consumer demand as a first force explains what incentivise people to switch from a vehicle with ICE to an electric one. The research on early EV adopters in megacities (Shanghai, New York, and Paris) shows that this group represents mainly higher-income consumers with a distinct set of attitudes and behaviours. Furthermore, these observations are in line with the
32
findings in Norway, where early adopters are in the main high-income, well-educated consumers, and also those, who are concerned about the environment.
Therefore, despite the various factors such as design, brand, and performance, which are all essential consumer considerations, there are three key motives for early EV adoption:
Carbon footprint reduction is a primary motivator for environmentally conscious consumers to buy EVs.
Driving and usage benefits include preferential parking permits in dense urban areas or the ability to drive in bus and taxi lanes are additional benefits offered by many governments and cities in an effort to stimulate EV sales.
Cost savings are results of government subsidies, which in many cases include exemption from purchase tax, VAT, toll road charges, registration tax, and annual circulation tax, and also provide a cheap mobility solution in the recent period of high fuel prices in Europe.
Industry developments are another driver for consumers to buy an EV. The number of EV releases, including hybrids is increasing every year since 2010, making EVs more attractive and available to a larger audience. Technological advancements and cost reductions across the EV value chain are beneficial for EV adoption. As previously discussed, a good example is the charging system (slow and fast chargers) which has become standardized, and costs getting down due to the growing economies of scale. Further, OEMs (Original Equipment Manufacturer) and suppliers are investing more in EV production platforms, bringing overall EV manufacturing costs down further (Al-Alawi and Bradley 2013).
Government stimulus are the third main driver for incentivising EVs deployment. On both, the demand and supply side governments are promoting EVs across Europe by providing a range of subsidies and other benefits (Langbroek, Franklin, and Susilo 2016). One of the key reasons is the reduction of CO₂ emissions. The EU’s CO₂ reduction targets for transport are ambitious compared to the US, Japan and China aiming for 95g CO₂ /km cap by 2020 and regulations are likely to further tighten beyond 2020 (McKinsey 2014). Due to these restrictions OEMs are getting pressured to reduce their fleet emissions (on average 28%). Similarly with CO₂ , regulation of NOx emissions are also tightening with the EU Air Quality Directive of 2008. Moreover, steps for promoting electric mobility are taken in cities, which are one of the prime centers of air pollution and which will be threatened with EU fines if they do not improve.
33
Another boost for EV growth from the governments of major European countries comes from the desire for higher energy independence and a shift towards a less oil-intensive transport sector (Bakker and Jacob Trip 2013). With the aim to pioneer the technology and keep the value chain in the country, governments in countries with leading OEMs are prioritizing the development of EV technology.
3.2 Policy Incentives for Electric Vehicle Adoption
Although the European EV market shows a constant positive growth, the uptake of EVs is still relatively low. In general, main reason for the slow deployment of EVs is that these vehicles have a comparatively high investment cost due to the high cost of batteries (Newbery and Strbac 2016). In order to increase the attractiveness of electric vehicles, packages of policy incentives are provided in many countries. As policy measures intervene with the generalized costs of EV-use, they can be considered as attributes of EVs that can be influenced by governments.
3.2.1 Policy Measures Types
Purchase-Based vs. Use-Based
In general, there are two different kinds of policy measures – purchase-based and use-based. Purchase-based policy, for instance, is a subsidy when buying an EV or a tax rebate when registering an EV. Examples of use-based policy are the providing of free parking slots for EVs, the allowance for users to drive in bus lanes or the providing of congestion charging exemptions for EV users. Purchase-based incentives decrease the fixed costs of EV-use, while use-based incentives decrease the marginal cost of EV-use.
In general, policy incentives can be of a local or global kind. On the one hand, local policy incentives such as free parking in a specific city or access to bus lanes are likely to only influence people who can gain from these location-specific incentives. On the other hand, global policy incentives such as national tax rebates (annual road taxes or vehicle registration tax) or subsidies apply to everyone in a country (Lieven 2015).
34
Financial Incentives
Furthermore, to stimulate EV deployment, countries use financial incentives from both technology specific policies, such as subsidies to EV consumers, and technology neutral policies, such as emissions-based vehicle taxes, applied either at the time of a vehicle’s registration or on its annual circulation fee. In some cases, countries decrease automobile taxes for EVs, and in others they provide subsidies apart from normal registration and circulation fees, thus presenting a very diverse financial incentive landscape (Sierzchula et al. 2014).
Therefore, based on the achieved countries’ results, it could be noted how differently policy measures such as fuel taxes, consumer subsidies, and installing charging stations, could influence EV adoption. In addition, a model by Sierchula, 2014, provides an insight of the patterns that many of the EV-specific variables are strongly correlated to (price, year of introduction, availability, market share, financial incentives, and charging infrastructure), indicating that industrial dynamics can become interwoven during the early commercialization of a radical innovation. Another observation is that the EV price variable has a negative correlation to a country’s market share.
Moreover, it could be seen from Figure 1 (Sierzchula et al. 2014) that financial incentives and EV deployment have a positive and significant relation one to another. In addition, there appears to be two groups of countries. The first represents around the half of the study sample (14 countries) with financial incentives less than $ 2.000. It exhibits lower EV market shares with the exceptions of Sweden (0.30%) and Switzerland (0.23%), and to a lesser extent
35
Germany (0.12%), and Canada (0.13%). Accordingly, 10 countries show little EV activity as measured by either financial incentives, or EV adoption.
The other group is separated between countries with higher levels of financial incentives and bigger variation in their EV market shares. Some countries such as Norway match high financial incentives with increased EV adoption. However, this relationship is not uniform as other countries, including Denmark and Belgium, offered at that time high financial incentives but which, at the same time, have relatively low levels of adoption.
Additionally, to the variables captured by the model, there are likely to be country-specific factors that influence national EV market shares. These country country-specific factors provide insight into factors not included in the model that have the potential to greatly influence national EV adoption levels. Moreover, Figure 1 suggests that there are factors other than financial incentives that drive EV adoption (Gärling and Thøgersen 2001). For instance, Norway installed extensive charging infrastructure in 2009, and has experienced a more gradual increase in EV adoption rates since 2010, predominantly through household consumers (Hall, Moultak, and Lutsey 2017).
36
Types of Financial Incentives
Based on the vehicle’s tonnage, company car status, emissions, and powertrain, countries employ several different financial incentives, which can be categorized as either registration or circulation subsidies. Figure 2 notices that broadly available EV financial incentives (78%) come in form of registration as opposed to circulation subsidies. The differentiation between the two is that registration funds are offered the year that the EV is purchased while those based on a vehicle’s annual circulation provide benefits over a multiple year time span. Main reason why registration subsidies are dominant form of financial incentives is due to the consumer high discount rates for circulation subsidies, effectively lowering their perceived value (Sierzchula et al. 2014)
37
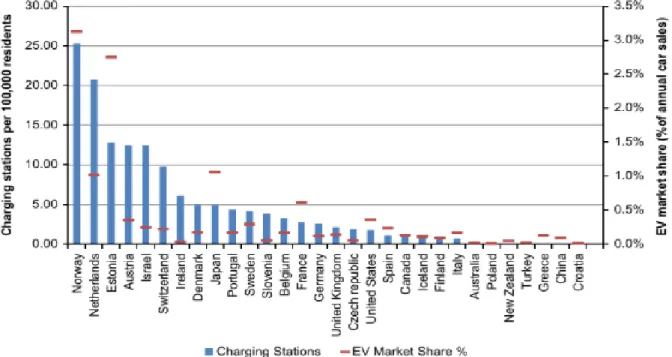
Next, although not as much information is available about national charging infrastructure as financial incentives, perhaps because in many countries they are largely installed by local municipalities (Bakker and Jacob Trip 2013), Figure 3 (Sierzchula et al. 2014) exhibits a positive and significant relationship between charging stations (adjusted for population) and EV adoption rates. Despite an overall positive correlation, there are examples of wide discrepancies in the data as evidenced by Estonia and Israel. Both countries have similar charging station proportions, but Estonia shows an EV adoption level 11 times higher than that of Israel.
Figure 4 sums up the results, observed in the Figures 1, 2 and 3, and shows that five out of the 30 countries have very slight activity during the introductory phase of EVs, as measured by financial incentives, adoption, or charging infrastructure installation. Therefore, countries in this study could be separated into two groups with divergent attitudes toward EV adoption as reflected by government policy and consumer purchase behavior. One set of countries seems to be actively engaged in the EV introductory market while the other appeared to show very little interest.
38
However, the difference between the two groups will likely have little effect on the overall success or failure of EVs as the countries invested in their adoption represent a substantial majority of global GDP based on national purchasing power parity (The World Bank 2014). Another important remark, observed by the model is that there is a positive correlation between a country’s EV adoption rate and the number of models that are available for purchase. Thus, countries where native manufacturers heavily invest in EVs e.g., Japan, France and the US, have some of the highest EV market shares. Other countries with EV production facilities but low adoption rates including Germany and Italy do not have EVs made by native manufacturers broadly available. Therefore, a strong relationship between consumer adoption of EVs and their being manufactured by native firms. This relationship between the variables in Figure 4 suggests a complex relationship between consumers, manufacturers, and national attitude regarding EVs (Sierzchula et al. 2014).
Also, another essential point, based on the empirical results of the model, is that while charging infrastructure and financial incentives are significant in predicting EV adoption, this is not the case with broader socio-demographic variable e.g., income, education, environmentalism, and urban density (Gallagher and Muehlegger 2011). Main reason for that is the relatively small size of national EV markets compared to overall automobile sales. Thus, while many EV consumers may have high levels of education and be passionate about the
39
environment, within the perspective of a country such individuals still represent a tiny portion of the overall population (Sierzchula et al. 2014). Therefore, socio-demographic variables do not provide a good indicator of adoption levels when comparing countries. Additionally, despite its strong and positive correlation to HEV adoption, fuel price is neither significant in predicting a country’s EV market share. In this regard, more research is necessary to discover the relationship between fuel price and EV adoption, specifically studies that span multiple years and look at a single country (Lane and Potter 2007).
3.2.2 Factors influencing EV Adoption
Currently, a number of federal policies are in place to incentivize deployment of PEVs to mainstream consumers with demographics and vehicle attribute preferences most common to today’s new vehicle purchasers. Main reason is that Plug-in electric vehicles provide an opportunity for reducing energy use and emissions in the transportation sector. Apart from that, EVs are introduced to the broader consumer market only recently in 2010, which explains why there is little research that uses empirical data to analyze factors which affect EVs’ adoption rates. Despite that, HEVs provide a good comparison basis for EVs (even though they are less of a radical innovation) because they have several of the same key elements including a battery and electric motor based powertrain and lower environmental impacts (Lane and Potter 2007). As HEVs have been commercially available since 1990s, there are several studies that use revealed preference data to investigate factors that influence consumer uptake for those automobiles. Based on the findings in HEV revealed preference research, EV survey studies, and theoretical articles, factors have been collected and categorized that are assumed to determine the decision of whether or not to purchase an electric vehicle (Diamond 2009).
Differentiation of Target Groups
In a study, based on a stated-choice experiment, which uses constructs of the Transtheoretical Model of Change (TTM) and the Protection Motivation Theory (PMT), the effect of several potential policy incentives on EV-adoption as well as the influence of socio-psychological factors are being investigated in order to see what determines the probability of EV deployment increase. Most policy incentives making the EVs more attractive are targeting all car drivers, without any distinguishing, although different traveller groups have different preferences. So that in order to distinguish the different groups of travellers based on their stated
40
preferences and demographics, a study by Lieven uses cluster techniques and compares the effect of policy measures on the travellers and further, if they react differently to those policy incentives (Lieven 2015). What is more, considering behavioural change as a process, different car drivers are in different stages-of-change towards electric vehicle use. They have diverse attitudes towards sustainable transport and electric vehicles in particular and diverse needs depending on where they live. All of these perspectives influence EV adoption, as well as the responsiveness to policy measures (Langbroek, Franklin, and Susilo 2016).
Intrinsic vs. Extrinsic Motivation
At an early EV deployment stage it is understandable that people won’t be aware of the characteristics of a new product such as electric vehicle. Those characteristics depend on the current state of technology and the choices that different car manufacturers have made. The electric vehicle itself is a product that has some features such as certain design, speed, comfort level, price and range. This core product, as well as the characteristics of the potential customer, provides some intrinsic motivation for somebody to purchase an EV. Additionally, intrinsic motivation is defined as an actual and internal tendency to perform an action, while extrinsic motivation is about a separable consequence that is separate from the actual action (Ryan and Deci 2000). Policy incentives such as subsidies, tax rebates or congestion charge exemptions influence the generalized cost of EV-use and therefore influence people’s extrinsic motivation to switch to EV-use.
On the other side, the amount of policy incentives that a specific person needs to be convinced to start using an electric vehicle, depends on this person’s intrinsic motivation level. A person that would buy an EV regardless of whether any policy incentives are offered, has high intrinsic motivation to buy an EV, while other people might only be interested in purchasing EVs if they would have been offered huge amounts of benefits (Langbroek, Franklin, and Susilo 2016). Rezvani et al. (2015) claims that the intrinsic motivation of someone to start using EVs depends on personal aspects and on attributes of the EV. Also, other factors such as technological, social, personal, and cost factors that have an influence on electric vehicle adoption are identified (Rezvani, Jansson, and Bodin 2015).
Based on a survey among active drivers in the city of Stockholm, in which socio-cognitive constructs from the Protection Motivation Theory and the Transtheoretical Model of Change have been included, it has been shown that stages of change towards electric vehicle adoption are correlated to both socio-economic characteristics, and socio-cognitive constructs
41
such as knowledge, attitudes and self-efficacy (Langbroek, Franklin, and Susilo 2017). Due to differences between these groups with respect to their position in the process of behavioral change towards electric vehicle use, it is assumed that people in dissimilar groups also react differently to policy incentives offered. While some people tend to get more information about the characteristics of electric vehicles and tend to have an ever increasing self-efficacy towards using EVs, some policy instruments might, for instance, have a larger or smaller influence on people that are already considering buying an EV. People who are currently using EVs might have an even higher intrinsic motivation to buy a second EV in the future, so that they depend less on policy incentives. However, it is questionable whether they are also unequally responsive to policy measures that can be taken in order to increase the attractiveness of EVs. More insight into the effects of policy measures on people that are in different stages-of-change can contribute to more insight into EV adoption strategies (Rezvani, Jansson, and Bodin 2015).
Price, Driving Range and Charging Time
The technology category sums up aspects of electric vehicles including battery costs and performance characteristics (driving range and charging time). The most significant obstacle to widespread EV diffusion are EV purchase prices, which are heavily dependent on battery costs (Brownstone, Bunch, and Train 2000). The IEA (2011) finds out that the buying price of an EV with a 30kWh battery (approx. 85 miles of driving range at 0.17 kWh/mile) would be $10.000 more than a comparable ICEV. Battery costs also have an impact on the driving range of an EV. An increase in the size of an EV’s battery (in kWh) raises both its purchase cost and driving range. Therefore, although consumers are sensitive to a limited driving range (Lieven et al. 2011) that aspect must be balanced with its relation to vehicle battery costs.
Another factor influencing consumer adoption is vehicle’s charging time (Hidrue et al. 2011). Whereas most ICEVs are able to refuel in about 4 min, EVs require approx. 30 min at a fast charging station and up to several (>10) hours for charging from a 110 or 220 V outlet, dependent on battery size (Saxton 2012). Relative to a comparable ICEV, an EV’s high purchase price, limited driving range, and long charge period all have a negative impact on adoption rate.
Additionally, consumer characteristics also play a role in determining the EV’s uptake. A study points out levels of education, income, and environmentalism to all be positively correlated to likelihood to purchase an EV (Hidrue et al. 2011). However, these factors,