Universidade de Lisboa
Faculdade de Farmácia
Collection and organization of a standard and
blood metabolite NMR library for the
metabolomics analysis
Ana Patrícia Ramos Sousa
Mestrado Integrado em Ciências Farmacêuticas
Universidade de Lisboa
Faculdade de Farmácia
Collection and organization of a standard and
blood metabolite NMR library for the
metabolomics analysis
Ana Patrícia Ramos Sousa
Monografia de Mestrado Integrado em Ciências Farmacêuticas apresentada à Universidade de Lisboa através da Faculdade de Farmácia
Orientador: Doutora Tuulia Tynkkynen, Ph.D.
Co-Orientador: Doutora Rita Guedes, Professora Auxiliar
Resumo
Um atual desafio nos estudos metabolómicos é o baixo número de metabolitos identificados em comparação com o grande número de metabolitos existentes nos fluidos biológicos. A espectroscopia de ressonância magnética nuclear (RMN) é uma das tecnologias mais usadas para tentar superar este problema. Através da construção de bibliotecas de metabolitos, é possível aumentar o conhecimento nesta área e aumentar a possibilidade da sua deteção com esta tecnologia e caraterizar os seus desvios químicos e multiplicidade. Esta informação fornece um conhecimento importante que ajudará na identificação de metabolitos quando amostras mais complexas, como por exemplo o sangue, forem analisadas. Amostras como o soro/plasma apresentam uma complicação extra quando este tipo de análise é aplicada. A alta concentração de proteínas no sangue provoca interferências nos espectros de RMN. As proteínas originam sinais amplos nos espetros padrão do protão (1H) e impedem a deteção de metabolitos, de baixo
peso molecular. Este fenómeno pode ser superado através dos espetro de RMN 1H editado por
T2, porém as informações dos metabolitos que se ligam às proteínas serão perdidas. Assim, primeiro os metabolitos devem ser separados das proteínas e, em seguida, as proteínas devem ser removidas. Para atingir o primeiro objetivo foram adicionadas às amostras de soro/plasma substâncias que influenciam a ligação entre proteínas. Essas substâncias podem fazer precipitar proteínas, por exemplo guanidina e sulfato de alumínio, ou funcionar como um ligando das proteínas, hexafluorobenzeno. Em seguida, para remover as proteínas, foram testados diversos métodos referidos na literatura e selecionados os três métodos que se apresentaram mais vantajosos e que mostraram melhores resultados. Destes, dois deles são métodos orgânicos, precipitação de proteínas com metanol e precipitação de proteínas com metanol-diclorometano, e um deles é baseado em propriedades físicas, ultrafiltração. Dos 65 metabolitos que se pretendia identificar, foi possível identificar 64 na biblioteca de metabolitos e 54 nas amostras de sangue. Comparando os diferentes métodos testados, alguns deles demonstraram ser mais eficientes na remoção de proteínas, no entanto alguns dos metabolitos desapareceram, enquanto outros métodos foram capazes de conjugar a remoção de proteínas com uma maior deteção de metabolitos. Os espetros das amostras de soro/plasma contêm ainda muitos sinais não identificados. No futuro, novas experiências para os identificar são necessárias.
Palavras-chave
: espectroscopia de ressonância magnética nuclear (RMN); metabolómica; métodos de desproteinização; identificação de metabolitos; metabolitos ligados a proteínasAbstract
An ongoing challenge in metabolomics is the low number of metabolites identified compared with the huge number of existing metabolites in biofluids. Nuclear magnetic resonance (NMR) spectroscopy is one of the technologies that have been used to try to overcome this problem. Through the construction of a metabolite library it is possible to increase the number of known metabolites detected with this technology and establish the chemical shifts and signal multiplicities of the metabolites. This provides a valuable knowledge that will help when more complex samples, as blood, are analysed. However, serum/plasma samples show complications when this type of analysis is applied. The high protein content in blood induces interferences in NMR spectra. Proteins give broad signals to standard proton (1H) NMR spectrum and prevent the detection of low-molecular weight metabolites. This can be overcome by measuring T2-edited 1H NMR spectrum but the information from metabolites that bind to proteins will be lost. Thus, first metabolites should be separated from proteins and then the proteins should be removed. To accomplish the first goal, substances that influence the linkage between proteins and metabolites were added to serum/plasma samples. These substances could either precipitate proteins, guanidine and aluminium sulphate, or function as a protein ligand, hexafluorobenzene. Then, to remove proteins, through the many different methods referred in the literature, the three methods with the best results and the most advantages were chosen. Two of them are organic methods, protein precipitation with methanol and protein precipitation with methanol-dichloromethane, and one is a physical method, ultrafiltration. From the 65 metabolites intended to be identified, it was possible to identify 64 of them in the metabolite library and, from these, 54 were present in blood samples. Comparing the different methods tested, some of them were more efficient removing proteins, however some metabolites disappeared, while others were able to conjugate the removal of proteins with the detection of more metabolites. Besides that, there are still many unidentified signals in the serum/plasma spectra. In the future, further experiments to identify these signals are required.
Key-words
: nuclear magnetic resonance (NMR) spectroscopy, metabolomics, deproteination methods, metabolite identification; metabolites that bind to proteinsAcknowledgments
The experiment was performed during three months (February to April of 2019) in the School of Pharmacy of University of Eastern Finland, in Kuopio. I intend to thank this department for providing me the laboratory facilities I needed for this investigation.
I wish to acknowledge everyone who helped me with this experiment – Professor Reino Laatikainen and PhD Jukka Leppänen – and, especially, to my main supervisor in the University of Eastern Finland, PhD Tuulia Tynkkynen. I really appreciated all the knowledge I learned with them in a study area almost unknown to me. Moreover, I wish to thank them for all the patience teaching me all the techniques, for helping me with my doubts and for all the guidance given to me during the analysis of my results.
Going to Finland was definitely the best decision I could had made and, honestly, it am grateful for this three months where I have the chance to know a completely different country, with a different culture. Finland, especially Kuopio, and the people I knew there will be always in my memories. Particularly, I wish to thank to Irene, who I meet in Finland, who made my Erasmus experience unforgettable, and with who I intend to maintain our friendship.
To my closest friends, Branca, Margarida, Alexandra, Mafalda and Beatriz, I give them my deepest thanks for always supporting me and checking on me. More, for being my company in this course and for understanding how difficult and hard it was to complete these 5 years and, especially, to write this final monography.
Above all, I express my sincere thanks to my parents, Anabela and José, for their support and sacrifice through this five years and for their agreement to let me go to Finland. Also, for accepting all the months I had to be away from home during this last five years. Furthermore, to my brother and sister, Hugo and Rita, for never let me missing home.
Lisbon, November 2019 Ana Patrícia Sousa
List of abbreviations
1D
one-dimensional
2D
two-dimensional
A Samples
serum samples A
br.
broad
DCM
dichloromethane
d
doublet
Dd
doublet of doublet
Dt
doublet of triplet
Dq
doublet of quartet
DSS
sodium trimethylsilylpropanesulfonate
F Samples
filtered serum A samples
HMDB
Human Metabolite Database
H
2O
water
M
multiplet
MeOH
methanol
MS
mass spectrometry
NMR
nuclear magnetic resonance
O Samples
serum samples O
Ppm
parts per million
P Samples
plasma samples
Q
quartet
Rpm
revolutions per minute
S
singlet
T
triplet
General Index
Introduction ... 14
Objectives ... 18
Materials and Methods ... 19
Serum/plasma metabolites used for the construction of the NMR spectral library ... 19
Preparation of metabolite pool solutions ... 19
Blood samples ... 20
Guanidine 3 M solution ... 20
Aluminium sulphate 0.5 M solution ... 20
Protein precipitation using methanol ... 20
Protein precipitation using methanol-dichloromethane ... 20
Ultrafiltration with 0.5 mL filters ... 21
Ultrafiltration with 2 mL filters ... 21
NMR spectroscopy ... 22
Peak Assignment ... 22
Results ... 23
Metabolite NMR library ... 23
1H NMR spectra of serum/plasma ... 28
Protein Precipitation with Methanol ... 36
Protein Precipitation with Methanol-Dichloromethane ... 40
Ultrafiltration ... 40 Guanidine... 43 Discussion ... 44 Future perspectives ... 47 Conclusion ... 48 References ... 49 Attachments ... 54
Figures Index
Figure 1. Expanded regions of Standard Pools Spectra and Annotations for All Identified
Metabolites. ... 25
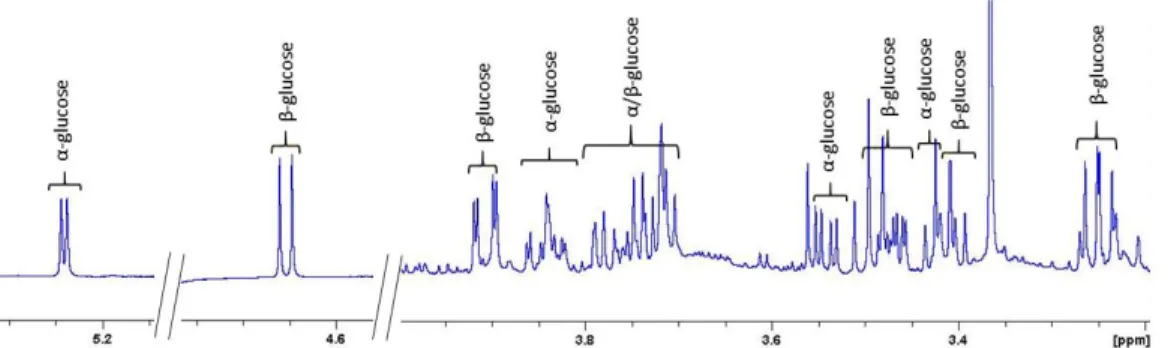
Figure 2. Expanded regions of Standard Pool 3 with the identification of α- and β- Glucose.
... 28
Figure 3. Expanded regions of Standard Pool 3 with the identification of α- and β- Mannose.
... 28
Figure 4. (a) A Typical 600 MHz 1H NMR Spectrum of a Pooled Human Serum after Protein
Precipitation Using MeOH and Guanidine with Expanded Regions (b−i) and Annotations for All Identified Metabolites. ... 31
Figure 5. Expanded Region of Serum O after Protein Precipitation Using MeOH and Guanidine
with the Identification of the Metabolite 3-hydroxybutyrate. ... 34
Figure 6. Expanded Region of Serum A after Protein Precipitation Using DCM and Evaporated
with Lyophilization with the Identification of the Metabolite Benzoate. ... 34
Figure 7. Expanded Region of Serum O after Protein Precipitation Using MeOH and Guanidine
with Annotation for the Metabolite 3-methylhistidine. ... 34
Figure 8. Expanded regions of Serum A after Protein Precipitation Using MeOH and Guanidine
with the Identification of α- and β-Glucose. ... 35
Figure 9. Expanded regions of Serum A after Protein Precipitation Using MeOH and Guanidine
with some traces of aspartate... 35
Figure 10. Expanded Regions of Plasma P after Protein Precipitation Using MeOH. There is a
huge protein background. ... 36
Figure 11. Expanded Regions of Plasma P after Protein Precipitation Using MeOH: 1 - with
Hexafluorobenzene; 2 - without Hexafluorobenzene. The metabolite acetone is not detected in 1. ... 36
Figure 12. Expanded Regions of Plasma P after Protein Precipitation Using MeOH: red line -
with Hexafluorobenzene; blue line - without Hexafluorobenzene. The protein background is reduced in red line. ... 37
Figure 13. Expanded Regions of Hexafluorobenzene Spectrum showing the signals
interference present in this compound... 37
Figure 14. Expanded Regions of Plasma P after Protein Precipitation Using MeOH. Green Line
– with 30 µL of Aluminium Sulphate; Red Line - with 20 µL of Aluminium; Blue Line - without Aluminium Sulphate. The background proteins is reduced in green and red line. ... 37
Figure 15. Expanded Regions of Plasma P after Protein Precipitation Using MeOH: 1 - with
30 µL of Aluminium Sulphate; 2 - with 20 µL of Aluminium Sulphate; 3 - without Aluminium Sulphate. The metabolite 1-methylhistidine is not detected in 1 and 2. ... 38
Figure 16. Expanded Regions of Plasma P after Protein Precipitation Using MeOH. Purple
Line - with 30 µL of Guanidine; Green Line – with 20 µL of Guanidine; Red Line - with 10 µL of Guanidine; Blue Line - without Guanidine. The protein background is reduced compared to the Blue Line, but between guanidine sample lines it does not vary much. ... 38
Figure 17. Expanded Regions of Plasma P after Protein Precipitation Using MeOH: 1 - with
30 µL of Guanidine; 2 - with 20 µL of Guanidine; 3 - with 10 µL of Guanidine; 4 – without Guanidine. The metabolite acetone is not detected in 1 and 2. ... 39
Figure 18. Expanded Regions of Serum A after Protein Precipitation Using MeOH: 1 –
Evaporation with Lyophilization; 2 – Evaporation with Concentrator. The intensity of the asparagine signal is diminished. ... 39
Figure 19. Expanded Regions of Plasma P after Protein Precipitation Using: Red Line - MeOH;
Blue Line – MeOH-DCM. The protein background is diminished when using MeOH-DCM. ... 40
Figure 20. Expanded Regions of Plasma P after Protein Precipitation Using: 1 - MeOH; 2 –
MeOH-DCM. Both choline and proline have less intensity and are less defined in sample using MeOH-DCM. ... 40
Figure 21. Expanded Regions of: Blue line – Serum A after Protein Precipitation Using MeOH
and Guanidine; Red Line - Serum A after Protein Precipitation Using MeOH-DCM and Guanidine; Green Line – Serum A after Ultrafiltration with 0.5 mL Filters. The protein background is the lowest with ultrafiltration method. ... 41
Figure 22. Expanded Regions of: 1 - Serum A after Protein Precipitation Using MeOH; 2 –
Serum A after ultrafiltration with 2 mL filters; 3 - Serum A after ultrafiltration with 0.5 mL filters. The metabolite tryptophan is not present after ultrafiltration. ... 41
Figure 23. Expanded Regions of: 1 – NaOH from the last rinse (7º) of the filter; 2 – water from
the last rinse (7º) of the filter. Both still have residues of glycerol and 1 have more interferences besides glycerol. ... 42
Figure 24. Expanded Regions of Serum A after Ultrafiltration with: 1 - 0.5 mL filters after
pre-rinsing with NaOH; 2 - 0.5 mL filters after pre-pre-rinsing with water. When washed with NaOH compounds such as urea, threonine and glutamine disappear. ... 42
Figure 25. Expanded regions of Serum A after Protein Precipitation Using MeOH and
Guanidine. At 5.55 ppm there is a doublet, which appears in all samples where guanidine was added...………..43
Tables Index
Table 1. Composition of the Pools, Number of the 1H NMR Signal Identification in Spectrum, Chemical Shifts (in ppm) and Multiplicities for the 65 Metabolites Present in Metabolite Pool Solutions. ... 26
Table 2. Number of the Signal Identification in Spectrum, Annotation in which Samples the
Metabolite was Identified, Chemical Shifts (in ppm) and Multiplicities for the Metabolites Identified in Human Serum A by 1H NMR ... 32
Attachments Index
Attachment 1. Table with the Composition of the Pool and Concentration of Each of the 65
Introduction
Metabolomics includes the study of low molecular weight molecules - known as metabolites - in living system and their identification and quantification (1–3). These metabolites are produced through metabolic processes and can be found in various biospecimens (blood, urine, cerebrospinal fluid) (3,4).
These compounds are part of a heterogeneous group, including lipids, amino acids, peptides, nucleic acids, organic acids, vitamins, thiols, carbohydrates etc. which have different physical properties (e.g. ranging in polarity from very water soluble - organic acids - to insoluble in water - nonpolar lipids) (5,6).
According to Human Metabolite Database (HMDB), there are 114 098 metabolites in a biological system and, 9 010 of these can be detected. The blood is suggested to contain 25 372 metabolites, and only 3191 of these can be detected from this biospecimen and 3 029 can be quantified (4). These metabolites are not only directly linked to endogenous origins, like enzymatic activities, but also those from exogenous sources such as food, microbiota, medications and environment. (4,6).
Metabolomics is of interest because the identification and quantification of metabolites can provide information not only about cellular activity, but also about protein and gene expression (3). Consequently, metabolomics enables various important applications including investigating physiological status, diagnosing diseases, discovering biomarkers, pharmaceutical development and toxicology (5,7). Besides the biomedical field, it can be applied in other areas as nutrition, energy and environmental sciences (8).
The two most widely used analytical approaches in the metabolomics field are mass spectrometry (MS) and nuclear magnetic resonance (NMR) spectroscopy (2,9). Although MS is a more sensitive technique and more widely used in metabolomics, NMR spectroscopy presents some advantages and has contributed significantly to the metabolomics study (2,8,10,11).
NMR spectroscopy is a highly robust and reproducible technique, which, due to its quantitative nature, provides absolute concentrations for many metabolites using a single internal standard (2,7–15). Moreover, its ability to identify structures of unknown metabolites is advantageous when analysing complex biological samples (2,8–10). Furthermore, it is a suitable method for analysing different biological fluids, cell extracts and tissues and does not require much sample preparation (2,8,15).
Among all biospecimen samples, serum/plasma is a good choice for determining the metabolic profile. This is because: (i) it interacts, directly or indirectly, with all living cells (ii) transports a variety of molecules (such as nutrients, endogenous metabolites, drug molecules) to and from cells of different tissues (iii) different pathophysiological states may be reflected in molecular composition of the blood (15–19). Samples with whole blood can also be used with the advantage of eliminating some pre-analytic processing steps and contain the red blood cells metabolome, which includes the energy molecules adenosine triphosphate (ATP), adenosine diphosphate (ADP) and adenosine monophosphate (AMP) (18).
Although blood is an excellent biofluid for metabolomic analysis, the use of intact blood serum/plasma has limitations, as a result of the abundant protein content of the blood (60-80 mg/mL) (9,18,20). Therefore, NMR spectra quality is affected (20). Firstly, the number of metabolites identified is limited (30 or less), compared with the real number of metabolites present (9,16). Secondly, the quantitative metabolite profiling is complicated, as the broad protein signals obscure other metabolite signals in the spectrum. Due to metabolites binding to proteins, their signals can be underestimated or disappeared, affecting the accurate determination of metabolite concentrations (9,14,16). The extension of protein binding and the interchange between bound or free metabolites cause shortening of transverse relaxation times (T2), resulting in broadening of signals (9,16,18). In addition, the presence of proteins itself disturbed the baseline, which together with broad signals cause signal overlap, contributing to low accuracy in quantification (9,12,18,20,21).
Although NMR is a technique that does not require much sample preparation, this principle is only suitable for samples without macromolecules, such as urine and extracted metabolite mixtures from cells and tissues. Since blood serum and plasma samples have high protein content, the use of methods to remove protein interference are beneficial (8).
There are a variety of methods with this purpose (i) suppression of the protein signals based on their short T2 relaxation time using Carr-Purcell-Meiboom-Gill (CPMG); (ii) ultrafiltration with low molecular cut-off filters; (iii) protein precipitation with different organic solvents; and (iv) addition of nanoparticles to remove proteins (8,17,20). The first one is a method applied after NMR analysis and the proteins are not physically removed from the sample, consequently signals from certain metabolites that interact with proteins can still be affected (17,21). The rest of the methods are applied during sample preparation steps and they should not only physically remove the proteins from the samples, but also disrupt metabolite-protein interactions before their removal (18). Ultrafiltration is based on the use of filters, in order to take advantage of molecular size differences. Therefore, it allows to separate proteins from metabolites in
serum/plasma samples (21). However, this analysis is limited to the free fraction of metabolites, the filters clog easily and they can contain impurities, such as glycerol, which requires repeated rinses of the filters before use (12,18,20). In contrast, protein precipitation with organic solvents disrupts the bonds of low affinity between proteins and metabolites, thus enabling the quantification of total metabolite concentration more efficiently (12,17). Organic solvents cause denaturation and precipitation of proteins, so then they can be removed and the solvent is evaporated (20). A variety of organic solvents are available, such as methanol (MeOH), acetonitrile, perchloric acid and trichloroacetic acid, of which MeOH has been suggested to be the favoured one. MeOH is less resource and has a superior performance, increasing the number of detectable metabolites (8,17,18). The ratio between MeOH and serum/plasma that shows the best results is 2:1 (v/v) (22). For the treatment with silica nanoparticles, through the interaction between silica particles and proteins, they will co-aggregate, thus being easily removed (20). This method can be used alone or combined with ultrafiltration and protein precipitation, the results being better when the methods are used in combination (8,20).
Protein precipitation and ultrafiltration are the methods for macromolecule removal that have been more applied in metabolomics studies and there is no consensus about which one is the best (18). According to some studies protein precipitation with MeOH is preferred, removing proteins and diminishing the loss of metabolites, identifying 60 metabolites and producing well-resolved spectra (2,8,14). On the other hand, there are studies suggesting that ultrafiltration is the best method, because it excludes proteins more efficiently and, as it has no drying step, it avoids the loss of temperature-susceptible metabolites (16,23). With this method 73 metabolites have been identified (16). However, it causes a depletion of approximately half of the quantified metabolites (17).
Contrary to ultrafiltration, protein precipitation with MeOH has the inconvenient drying step that is always required to evaporate the MeOH from the precipitate. Therefore, if there are any temperature-susceptible metabolites present in samples, like urea and MeOH, they can be either partially or totally evaporated, which causes the reduction or disappearance of volatile metabolites. Besides that, after the measurement of NMR spectra, it is not known whether the MeOH detected comes from the addition of MeOH during the precipitation or was already present in the blood samples. This is because, although the sample was subjected to a drying step, there is no guarantee that all the MeOH used in precipitation has been evaporated (12,16). An common obstacle to both precipitation and ultrafiltration methods, is peak assignment of low concentration metabolites, since the signals of some high concentration metabolites, such as glucose and lactate overlap the small metabolite signals (8,9).
After the NMR spectrum is obtained it must be processed. Normally, it is processed automatically, including phase and baseline correction, referenced to the signal arising from sodium trimethylsilyl propionate (TSP) methyl groups at 0.0 parts per million (ppm) and line broadening to increase signal-to-noise ratio (S/N). In addition, occasionally also some manual corrections are needed (10).
Subsequently, it is possible to initiate the NMR spectral data analyses. First of all, it starts with the identification of the detectable metabolites and there are many metabolite databases available that can help in this phase, such as HMDB and Biological Magnetic Resonance Data Bank (BMRB) (2,10). With the help of these databases, the identification of known metabolites will be easier, faster and more reliable. However, it only helps with metabolites that already exist in databases (2,8). And yet some signals can be sensitive for sample conditions, such as pH or ion content. Thus, there is some variation in chemical shifts when a compound is measured in different sample matrix. Some signals also overlap with some other signals (10).
For the unknown metabolites it is necessary to perform more experiments, such as a two-dimensional (2D) NMR experiments, spiking experiments, integrate NMR with other methods such as MS or cheminformatics (8,10). Cheminformatics offers methods and algorithms for computer assisted NMR spectra assignment and structure elucidation, likewise prediction and simulation of spectra (24). Recently, a new method has been exploited which utilizes distinct chemical additives to the NMR tube in order to identify metabolites with specific physicochemical properties (8). With these combined techniques it is possible to identify all or almost all detectable signals in the NMR spectra (10).
Also, the affinity of certain metabolites to proteins can hamper metabolite detection. Through the addition of certain substances to samples, it is possible to influence the link between proteins and metabolites, promoting the release of metabolites.
Objectives
The main goal of this study is to create a metabolite library and to try to detect these metabolites in blood samples using NMR technique for the metabolomics analysis. This objective to be achieved must, on the one hand detect as much metabolites as possible, and, on the other hand to overcome the challenge of the presence of proteins. To accomplish these goals, different methods were tested.
The purpose of this project was to test different serum extraction methods and evaluate which of them recovers most of the NMR detectable serum metabolites. Furthermore, a spectral library of possible serum/plasma metabolites was set up by preparing pool samples that contained a set of serum/plasma metabolites. Metabolites for these pools were chosen considering that the metabolite signals in each pool do not overlap with each other. The extraction methods to be tested included protein precipitation with MeOH, MeOH- dichloromethane (DCM) and ultrafiltration. DCM was added due to its known properties of protein denaturation and to be able to extract also the lipophilic compounds (25). Additionally, the ability of guanidine, hexafluorobenzene and aluminium sulphate to release metabolites from plasma proteins was tested. These compounds were chosen, because they precipitate proteins (guanidine and aluminium sulphate) or they are protein ligand (hexafluorobenzene), both influence the linkage between protein and metabolites (26,27).
Materials and Methods
Serum/plasma metabolites used for the construction of the NMR spectral library:
Betaine, choline, sodium trimethylsilylpropanesulfonate (DSS), fumarate, guanidine, hypoxanthine, isovaleric acid, ornithine and sarcosine were purchased from Aldrich. Aluminium sulphate, benzoate, formate and glycerol were purchased from Merck Millipore. Alanine, asparagine, aspartate, citrate, creatinine, dimethylamine, glutamate glutamine, glycine, histidine, 3-hydroxybutyrate, isobutyrate, isoleucine, lactate, leucine, lysine, methionine, N,N-dimethylglycine, phenylalanine, proline, serine, threonine, tryptophan, urea, uridine, valine, and xanthine were obtained from Sigma. Arginine, carnitine, creatine, hippurate, pyroglutamate, succinate and tyrosine were obtained from Fluka. Acetone, glucose, 1-methylhistidine, myoinositol, 2-oxoisocaproate and pyruvic acid were purchased from Sigma-Aldrich. 2-aminobutyric acid, 2-hydroxyisovalerate, 3-hydroxyisovaleric acid and mannose were purchased from Alfa Aesar. Acetate was purchased from J. T. Baker. Acetoacetic acid was obtained from TCI Europe nv. Methanol was purchased from Fisher Scientific. Sucrose from Riedel-de Haën. 3-methyl-2-oxovaleric acid and phosphocholine from Medchemexpress. Acethylcarnithine from Abcam. 3-methylhistidine from Toronto Research Chemicals Inc. 2-oxoisovalerate from Combi-blocks. Ethanol from Etax. N-acetylglycine from Tokyo Chemical Industry CO. Dichloromethane from VWR Chemicals. Hexafluorobenzene from Fluorochem. All compounds were used with no further purification.
Preparation of metabolite pool solutions: 20 stock solutions were prepared using 65
compounds. The compounds were weighed to have a predefined final concentration (ca. 5-20 mM) (See Attachment 1). Some standards were mixed, considering their chemical shifts, in a way their signals do not interfere with each other (See Table 1). The mixtures were dissolved in 5 mL of 1:2 diluted phosphate buffer (75 mM di-sodium phosphate (Na2PO4) in 80%/20%
water (H2O)/ deuterium oxide (D2O), 4.64 mM TSP and 0.04% sodium azide (NaN3). If
necessary, some solutions were sonicated for 2-5 minutes to speed up the dissolution process. If not analysed immediately, the stock solutions were stored in the fridge. The NMR samples were prepared by mixing 130 µL of the stock solution, 130 µL of water and 260 µL of 75 mM phosphate buffer in 5 mm NMR tubes.
Blood samples: Plasma samples (P samples) were obtained by mixing plasma from
different individuals. Serum samples were obtained from 2 different persons (serum samples A (A samples) and serum samples O (O samples)) and analysed independently. All blood samples were stored at -80ºC.
Guanidine 3 M solution: When needed, a 3 M solution was prepared by dissolving required
amount of guanidine in water to obtain a 3M solution, knowing that the molecular weight of guanidine is 95.53 g/mol.
Aluminium sulphate 0.5 M solution: When needed, a 0.5 M solution was prepared by dissolving required amount of aluminium sulphate in water to obtain a 0.5 M solution, knowing that the molecular weight of aluminium sulphate is 342.131 g/mol.
Protein precipitation using methanol: Briefly, 300 µL of blood sample was added 600
µL of MeOH. The sample was vortexed for 30 seconds and then cooled down at -20˚C for 30 min. After that the sample was centrifuged at 11000 revolutions per minute (rpm) for 30 min and supernatant was collected. The pellet was mixed with 600 µL of H2O:MeOH (1:2) solution,
vortexed for 30 seconds and centrifuged at 11000 rpm for 30 min. The liquid layers were combined. The solvent was evaporated by lyophilization (Edwards, model av12) for ca. 18h or using the concentrator (Thermo Scientific Savant SPD131DDA SpeedVac Concentrator) (settings: temperature 45ºC, heat time continuous, run time 3h, vacuum pressure level 5.0 and ramp 3) and freezed. Prior to lyophilization, the sample was freezed at -80˚C.
Some experiments were made with the addition of guanidine 3 M (different volumes were added: 10, 20, 30, 40, 50 µL), hexafluorobenzene 99% (different volumes were added: 5, 10, 15, 20 µL) or aluminium sulphate 0.5 M (different volumes were added: 20, 40 µL) to the blood sample, and the remaining procedure was the same.
The serum metabolite extracts were kept at the fridge prior to NMR measurements. The extracts were prepared for NMR analysis by dissolving the extracts in 530 µL of 37.5 mM phosphate buffer and 520 µL of the solution was transferred to a 5 mm NMR tube.
Protein precipitation using methanol-dichloromethane: Firstly, 260 µL of blood sample
and 260 µL of 75 mM phosphate buffer were combined and 400 µL of MeOH was added to the solution. The sample was vortexed for 30 seconds after which 400 µL of DCM was added. After vortexing (for 30 seconds) and centrifuging (at 11000 rpm for 10 min) 300 µL of the
lower layer (DCM layer) was collected and the DCM was evaporated with pressurized air (Techne Dri-Block DB3 & Atlas Copco DC2 Quality Air Solutions). The rest of the sample (MeOH-water layer and protein precipitate) was extracted again with 300 µL of DCM. After vortexing (for 30 seconds) and centrifugation (at 11000 rpm for 5 min) 350 µL of the lower layer was collected, combined with the previous DCM-layer and evaporated with pressurized air. This step was repeated 2 more times. The upper layer (MeOH layer) was evaporated in a concentrator (settings: temperature 45ºC, heat time continuous, run time 3h, vacuum pressure level 5.0 and ramp 3) or freezed at -80ºC and lyophilized.
Some experiments were made with the addition of 3 M guanidine (volume: 10 µL) to the blood sample, and the rest of the procedure was kept the same.
The serum metabolite extracts were kept at the fridge prior to NMR measurements. The extracts were prepared for NMR analysis by dissolving the extracts in 530 µL of 37.5 mM phosphate buffer and 520 µL of the solution was transferred to a 5 mm NMR tube.
Ultrafiltration with 0.5 mL filters (Amicon® Ultra-0.5 Centrifugal Filter Devices: 3K
device-3,000NMWL): filters were prerinsed, according to manufacturer’s instructions, with 500 µL of water or 0.1 M sodium hydroxide and centrifuged at 14000 g for 20 min, seven times. An NMR spectrum was measured from the water of the last rinse to investigate if there is any impurity (glycerol) from the filters still present. After getting rid of glycerol, 300 µL aliquots of serum A were added to the filters and the filters were centrifuged (at 14000 g for 30 min). The filtrates were kept at the fridge prior to NMR measurements. The filtrates were prepared for NMR analysis by combining 260 µL of the filtrate and 260 µL of 75 mM phosphate buffer in a 5 mm NMR tube.
Ultrafiltration with 2 mL filters (Vivaspin® 2 mL 2,000MWCO HY-Hydrosart
membrane): The filters were prerinsed, according to manufacturer instructions, with 2000 µL of water and centrifuged at 4000 g for 20 min, six times. An NMR spectrum was measured from the water of the last rinse to investigate if there is any impurity (glycerol) from the filters still present. After getting rid of glycerol, 500 µL aliquots of serum A were added to the filters and the filters were centrifuged (at 400 g for 1h 50min). The filtrates were kept at the fridge prior to NMR measurements. The filtrates were prepared for NMR analysis by combining 260 µL of the filtrate and 260 µL of 75 mM phosphate buffer in a 5 mm NMR tube.
NMR spectroscopy: All NMR experiments were performed at 295 K on a 600 MHz Bruker
NMR spectrometer, equipped with a cryoprobe (Bruker Prodigy TCI 600 S3 H&F-C/N-D-05 Z). Each 1H one-dimensional (1D) NMR experiments was performed with 64 scans. Chemical shifts were referenced to the internal TSP signal for 1H 1D spectra. Bruker Topspin version 3.6 software packages were used for NMR data acquisition, processing, and analyses.
Peak Assignment: NMR signals were assigned using literature libraries and databases, e.g.
Results
Metabolite NMR library
All metabolite pool solutions provided excellent resolved 1H NMR spectra, with practically no interferences. It was possible to detect 64 of the 65 compounds existing in the stock solutions. Spectra for the stock solutions including signal assignments are shown in Figure 1. The chemical shifts and the multiplicities of the signals for each compound are collected in Table 1.
Some compounds had to be analysed more than once, due to various reasons; (i) the concentration was too low and the compound was not detected; (ii) during the preparation step the compound was evaporated; (iii) some compounds used were degraded (acetoacetic acid), having interferences in spectrum, and it was necessary to use new ones.
The only compound that was not detected from spectra was formate, a compound of pool 1. The reason why it was not detected is not clear, but it could have been evaporated.
Besides, it was possible to identify distinctly both anomers (α and β) for glucose and mannose. An expanded region of the spectrum of glucose and mannose with the identification of each anomer is shown in Figure 2 and Figure 3, respectively.
Through the analysis of the spectra and looking to the chemical shifts it is possible to notice that some compounds only have one signal to the 1H NMR spectrum – like fumarate, xanthine and glycine -, while others have many signals – as glucose, 3-methyl-2-oxovaleric acid and acetylcarnitine. In the metabolite pool samples, that were made in a way where none of the signals interferes with another, it was simple to distinguish all the signals, whereas in complex samples – as blood – there are much more compounds and some metabolite signals, with similar chemical shifts, can overlap in spectrum, which makes the peak assessment difficult. The identification and assessment of the signals was facilitated using the information of other studies and databases, which had already built libraries for these compounds.
Figure 1. Expanded regio ns o f St andard Poo ls Spectra and Annot at io ns fo r All Ident ified Met abo lit es.
Table 1. Composition of the Pools, Number of the1H NMR Signal Identification
in Spectrum, Chemical Shifts (in ppm) and Multiplicities for the 65 Metabolites Present in Metabolite Pool Solutions.
Pool Number Compound Chemical Shift and Multiplicity
1 - TSP 0.0
- Formate Not detected
22 Fumarate 6.52 (s) 33 Hypoxanthine 8.19 (s); 8.21 (s) 63 Urea 5.79 (broad (br.) s) 66 Xanthine 7.9 (s) 2 1 Acetate 1.92 (s) 3 Acetone 2.23 (s) 11 Betaine 3.26 (s); 3.91 (s) 16 Creatine 3.03 (s); 3.93 (s) 17 Creatinine 3.04 (s); 4.06 (s) 18 Dimethylamine 2.72 (s) 19 N,N-dimethylglycine 2.93 (s); 3.72 (s) 27 Glycine 3.56 (s) 32 3-hydroxyisovaleric acid 1.27 (s); 2.36 (s) 41 Methanol 3.36 (s) 56 Sarcosine 2.74 (s); 3.61 (s) 58 Succinate 2.41 (s) 3 9 Asparagine 2.85 (m); 2.95 (m); 4.00 (dd) 12 Benzoate 7.48 (m); 7.55 (t); 7.87 (d) 23 Glucose Alfa: 3.41 (m); 3.53 (dd); 3.72 (m); 3.78 (m); 3.83 (m); 3.85 (m); 5.23 (d) Beta: 3.24 (dd); 3.41 (m); 3.46 (m); 3.47 (m); 3.72 (m); 3.90 (dd); 4.654 (d) 37 Lactate 1.33 (d): 4.18 (q) 54 Pyroglutamate 2.04 (m); 2.40 (m); 2.51 (m); 4.18 (dd) 65 Valine 0.99 (d); 1.04 (d); 2.27 (m); 3.61 (d) 4 14 Choline 3.20 (s); 3.52 (m); 4.072 (m) 30 3-hydroxybutyrate 1.203 (d): 2.308 (m); 2.415 (m); 4.16 (m) 39 Lysine 1.48 (m); 1.73 (m); 1.90 (m); 3.03 (t); 3.74 (t) 50 Phenylalanine 3.28 (m); 3.99 (dd); 7.33 (d); 7.38 (m); 7.43 (m) 5 15 Citrate 2.55 (d); 2.66 (d) 29 Histidine 3.16 (dd); 3.25 (dd); 3.99 (dd); 7.10 (s); 7.90 (d) 45 3-methyl-2-oxovaleric acid 0.90 (t); 1.10 (d); 1.46 (m); 1.70 (m); 2.93 (m) 48 2-oxoisocaproate 0.93 (d); 2.10 (m); 2.61 (d) 59 Sucrose 3.48 (t); 3.56 (dd); 3.68 (s); 3.76 (t); 3.83 (m); 3.87−3.89 (m); 4.05 (t); 4.22 (d); 5.41 (d)
Table 1. continued
Pool Number Compound Chemical Shift and Multiplicity
6 6 Alanine 1.48 (d); 3.78 (q) 52 Proline 2.00 (m); 2.07 (m); 2.35 (m); 3.33 (dt); 3.41 (dt); 4.13 (dd) 57 Serine 3.84 (dd); 3.90 (dq) 60 Threonine 1.33 (d); 3.58 (d); 4.25 (m) 7 8 Arginine 1.69 (m); 1.91 (m); 3.24 (t); 3.77 (t) 10 Aspartate 2.67 (dd); 2.81 (dd); 3.90 (q) 34 Isobutyrate 1.06 (d); 2.39 (m) 42 Methionine 2.19 (m); 2.64 (t); 3.86 (dd) 61 Tryptophan 3.31 (q); 3.49 (dd); 4.06 (dd); 7.20 (m); 7.29 (m); 7.32 (s); 7.54 (d); 7.74 (d) 8 13 Carnitine 2.44 (m); 3.23 (s); 3.43 (m); 4.57 (m) 47 Ornitine 1.74 (m); 1.83 (m); 1.94 (m); 3.06 (t); 3.78 (t) 46 Myoinositol 3.28 (t); 3.54 (dd); 3.62 (t); 4.06 (t) 9 24 Glutamate 2.06 (m); 2.12 (m); 2.35 (m); 3.76 (dd) 38 Leucine 0.96 (t) ; 1.71 (m); 3.73 (m) 62 Tyrosine 3.05 (dd); 3.20 (dd); 3.94 (dd); 6.90 (m); 7.19 (m) 10 25 Glutamine 2.139 (m); 2.45 (m); 3.774 (t) 35 Isoleucine 0.943 (t); 1.01 (d); 1.261 (m); 1.472 (m); 1.982 (m); 3.676 (d) 11 4 Acetylcarnitine 2.147 (s); 2.515 (dd); 2.651 (dd); 3.199 (s); 3.612 (d); 3.857 (dd); 5.606 (q) 7 2-aminobutyric acid 0.992 (t); 1.913 (m); 3.720 (dd) 12 20 Ethanol 1.188 (t); 3.663 (q) 31 2-hydroxyisovalerate 0.838 (d); 0.97 (d); 2.018 (m); 3.853 (d) 44 3-methylhistidine 3.287 (m); 3.752 (s); 3.971 (dd); 7.152 (s); 8.123 (s) 49 2-oxoisovalerate 1.126 (d); 3.02 (m) 13 43 1-methylhistidine 3.062 (dd); 3.163 (dd); 3.688 (s); 3.966 (dd); 6.996 (s); 7.633 (s) 64 Uridine 3.814 (dd); 3.919 (dd); 4.136 (m); 4.233 (t); 4.359 (t); 5.904 (d); 5.919 (d); 7.878 (d) 14 28 Hippurate 3.973 (d); 7.554 (m); 7.640 (m); 7.837 (m) 36 Isovaleric acid 0.912 (d) 1.946 (m); 2.059 (d) 15 40 Mannose Alfa: 3.677 (m); 3.769 (m); 3.821 (m); 3.854 (dd); 3.915 (dd); 5.17 (d) Beta: 3.38 (m); 3.58 (t); 3.653 (m); 3.735 (m); 3.883 (dd); 3.94 (m) 16 5 N-acetylglycine 2.043 (s); 3.754 (d); 8.023 (br.s) 17 51 Phosphocholine 3.224 (s); 3.596 (t); 4.166 (m) 18 2 Acetoacetic acid 2.283 (s); 3.448 (s) 19 55 Pyruvic acid 2.36 (s) 20 26 Glycerol 3.563 (m); 3.669 (m); 3.794 (m)
1H NMR spectra of serum/plasma
All the serum/plasma experiments did not provide well resolved 1H NMR spectra, some of the spectra have many interferences, especially due to the present of proteins. From the 65 metabolites intended to be identified, it was possible to identify 54. Moreover, it was even possible to identify one extra compound, 1,2-propanediol, that was not present in the metabolite pool solutions. Overall, it was possible to identify 5
6 of the initial list of metabolites. Although
it was possible to identify 55 metabolites, not all the samples contained all the metabolites. Some of these were only identified in specific samples and under certain conditions.
From A samples, a total of 54 compounds were identified, whereas from P and O samples, 53 compounds were detected. The majority of the metabolites detected from different serum/plasma samples were the same, but there were some metabolites detected in just some of the samples or when a specific method was applied.
From the 55 identified metabolites, 50 of them were found in all serum/plasma samples. The exceptions are benzoate, 3-methylhistidine, proline, succinate and tryptophan. Benzoate
Figure 2. Expanded regio ns o f St andard Poo l 3 wit h t he ident ificat io n o f α - and β- Gluco se.
and tryptophan were only detected under specific conditions, while the others were found only in some samples. 3-methylhistidine was only found in O samples and filtered serum A samples (F samples) and proline and succinate were only present in samples P, A and F, not being clear why.
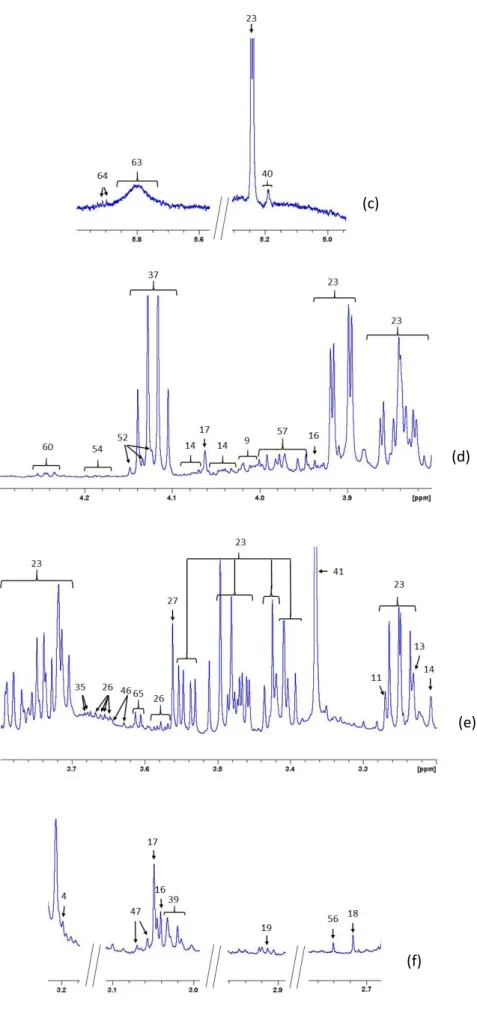
Because sample A contained more metabolites than the other samples, the spectrum from sample A was chosen to present the metabolite signal assignments, the chemical shifts and signal multiplicities. This spectrum is illustrated in Figure 4 and the chemical shifts and the multiplicity of the signals for each compound are shown in Table 2.
Figure 4. continued
(b) (a)
Figure 4. continued
(c)
(d)
(e)
(g)
(h)
(i)
Figure 4. (a) A Typ ica l 600 MHz 1H NMR Spectrum o f a Poo led Human Serum aft er Prot ein
Precip it at io n Using MeOH and Guanid ine wit h Expanded Regio ns (b−i) and Anno tat io ns for All Identified Metabolites.
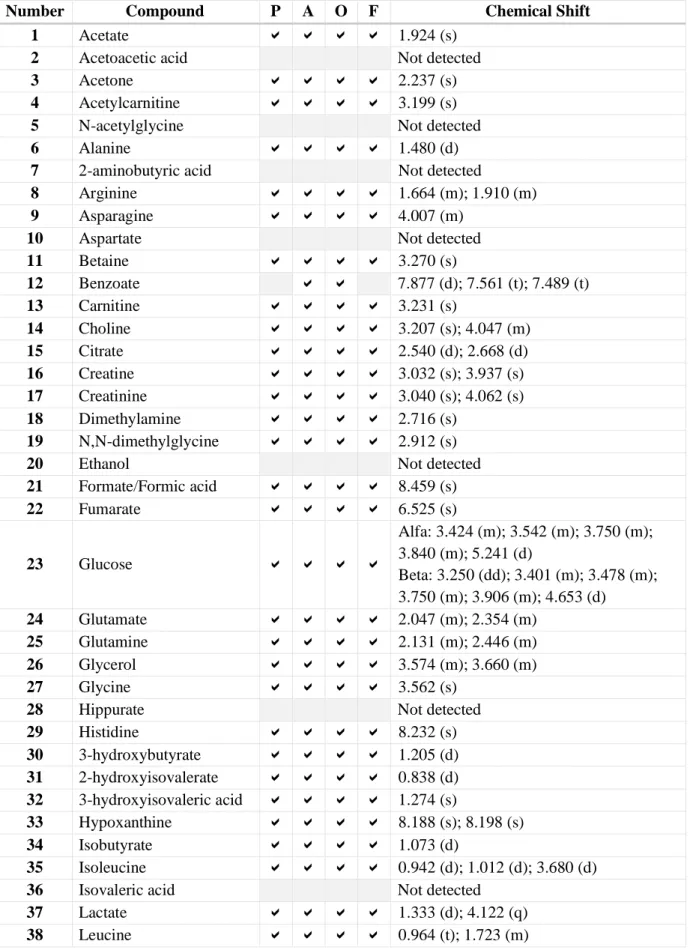
Number Compound P A O F Chemical Shift
1 Acetate 1.924 (s)
2 Acetoacetic acid Not detected
3 Acetone 2.237 (s)
4 Acetylcarnitine 3.199 (s)
5 N-acetylglycine Not detected
6 Alanine 1.480 (d)
7 2-aminobutyric acid Not detected
8 Arginine 1.664 (m); 1.910 (m)
9 Asparagine 4.007 (m)
10 Aspartate Not detected
11 Betaine 3.270 (s) 12 Benzoate 7.877 (d); 7.561 (t); 7.489 (t) 13 Carnitine 3.231 (s) 14 Choline 3.207 (s); 4.047 (m) 15 Citrate 2.540 (d); 2.668 (d) 16 Creatine 3.032 (s); 3.937 (s) 17 Creatinine 3.040 (s); 4.062 (s) 18 Dimethylamine 2.716 (s) 19 N,N-dimethylglycine 2.912 (s)
20 Ethanol Not detected
21 Formate/Formic acid 8.459 (s) 22 Fumarate 6.525 (s) 23 Glucose Alfa: 3.424 (m); 3.542 (m); 3.750 (m); 3.840 (m); 5.241 (d) Beta: 3.250 (dd); 3.401 (m); 3.478 (m); 3.750 (m); 3.906 (m); 4.653 (d) 24 Glutamate 2.047 (m); 2.354 (m) 25 Glutamine 2.131 (m); 2.446 (m) 26 Glycerol 3.574 (m); 3.660 (m) 27 Glycine 3.562 (s)
28 Hippurate Not detected
29 Histidine 8.232 (s) 30 3-hydroxybutyrate 1.205 (d) 31 2-hydroxyisovalerate 0.838 (d) 32 3-hydroxyisovaleric acid 1.274 (s) 33 Hypoxanthine 8.188 (s); 8.198 (s) 34 Isobutyrate 1.073 (d) 35 Isoleucine 0.942 (d); 1.012 (d); 3.680 (d)
36 Isovaleric acid Not detected
37 Lactate 1.333 (d); 4.122 (q)
38 Leucine 0.964 (t); 1.723 (m)
Table 2. Number of the Signal Identification in Spectrum, Annotation in which Samples the Metabolite was Identified, Chemical Shifts (in ppm) and
Table 2. continued
Number Compound P A O F Chemical Shift
39 Lysine 3.026 (m)
40 Mannose Alfa: 5.189 (d)
Beta: Not detected
41 Methanol 3.366 (s) 42 Methionine 2.140 (s); 2.643 (m) 43 1-methylhistidine 7.049 (s); 7.919 (s) 44 3-methylhistidine 8.337 (s) 45 3-methyl-2-oxovaleric acid 0.898 (t); 1.102 (d) 46 Myoinositol 3.628 (m) 47 Ornithine 3.064 (m) 48 2-oxoisocaproate 0.941 (d); 2.616 (d) 49 2-oxoisovalerate 1.127 (d) 50 Phenylalanine 7.331 (m); 7.378 (t); 7.431 (t)
51 Phosphocholine Not detected
52 Proline 4.133 (m)
53 1,2-propanediol 1.146 (d)
54 Pyroglutamate 2.503 (m); 4.185 (dd)
55 Pyruvic acid Not detected
56 Sarcosine 2.740 (s)
57 Serine 3.980 (m)
58 Succinate 2.408 (s)
59 Sucrose Not detected
60 Threonine 1.327 (d): 4.244 (m) 61 Tryptophan 7.206 (t); 7.289 (t); 7.314 (s); 7.547 (d); 7.739 (d) 62 Tyrosine 6.897 (d); 7.195 (d) 63 Urea 5.800 (br.s) 64 Uridine 5.903 (d); 5.922 (d); 7.879 (d) 65 Valine 0.989 (d); 1.044 (d); 2.272 (m); 3.608 (d)
66 Xanthine Not detected
The metabolite 3-hydroxybutyrate was present in all samples but only in O samples all the four signals arising from this compound were detected. In the other samples the only signal possible to assess was the doublet at 1.205 ppm. Besides the doublet, there are three multiplets at 2.309, 2.414 and 4.160 ppm. The spectrum for this compound in sample O is on Figure 5. The doublet arising from three CH3 protons is the easiest to observe because its signal is three
As mentioned before, benzoate was one of the compounds that was detected under specific conditions. It was only detected when samples were subjected to protein precipitation with MeOH-DCM and evaporated with lyophilization. The spectrum showing the 1H NMR signals
of this compound is illustrated in Figure 6 and the chemical shifts and multiplicities are shown in Table 2.
Another exception is 3-methylhistidine that was only detected in sample O and sample F. A spectrum of sample O with this peak assignment is shown in Figure 7.
Figure 5. Expanded Regio n o f Serum O aft er Protein Precip it at io n Using MeOH and Guanid ine w it h t he Ident ificat io n o f t he Met abo lit e 3 -hydro xybut yrat e.
Figure 6. Expanded Regio n o f Serum A aft er Protein Precip it at io n Using DCM and Evapo rated wit h Lyo philizat io n wit h t he Ident ificat io n o f t he Met abo lit e Benzo ate.
Figure 7. Expanded Regio n o f Serum O aft er Prot ein Precip it at io n Using MeOH and Guanid ine w it h Annot at io n fo r t he Metabolit e 3 -met hylhist id ine .
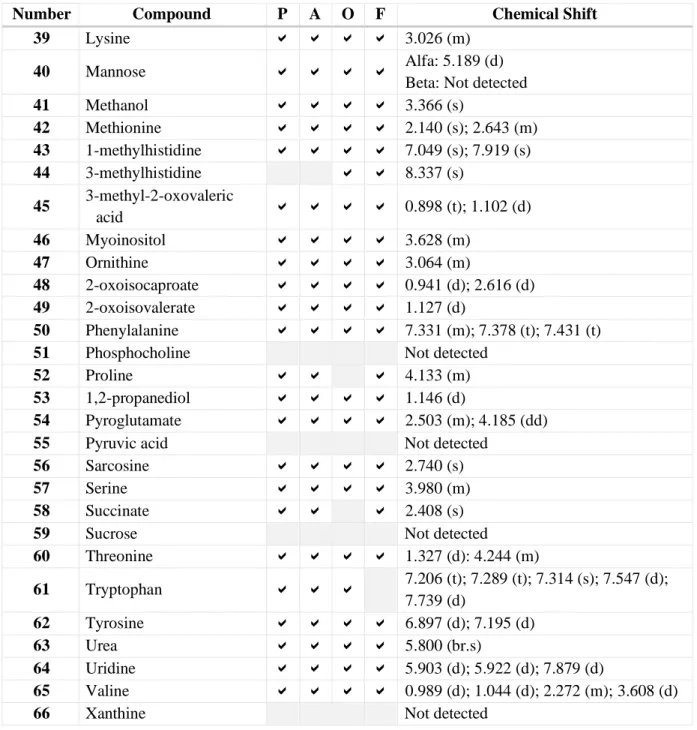
In contrast to metabolite pool samples, in blood samples it was not possible to identify both anomers of mannose, only α-mannose was detected. For glucose, both anomers were detected, however in the area of 3.7-3.8 ppm the signals overlap so much that the differentiation between α- and β-forms was not done, and it was identified only as glucose. An expanded region of the spectrum with identification of each anomer of glucose is shown in Figure 8.
As mentioned before, glucose has many signals with high intensity, so they can overlap with other less abundant metabolite signals. This is possible to see, especially in the region of 3.7-3.8 ppm where signals of glucose overlap so much that, even if there were some other metabolites in this area, it would be difficult to detect them.
The list of not detected metabolites includes 11 compounds. They are acetoacetic acid, N-acetylglycine, 2-aminobutyric acid, aspartate, ethanol, hippurate, isovaleric acid, phosphocholine, pyruvic acid, sucrose and xanthine. They were not identified in any of the samples with any of the methods tested in this experiment. However, is was possible to observe traces of some of them. Though, as their concentrations were so low, they were not quantified as detected metabolites. As an example, the Figure 9 shows a spectrum that contains trace amount of aspartate.
Figure 8. Expanded regio ns o f Serum A aft er Protein Prec ip it at io n Using MeO H and Guanid ine w it h t he Ident ificat io n o f α - and β-Gluco se.
Figure 9. Expanded regio ns o f Serum A after Prot ein Precip it at io n Using MeOH and Guanid ine w it h so me traces o f aspartat e.
Protein Precipitation with Methanol
One of the methods tested was protein precipitation with MeOH using the concentrator in the drying step and it allows the identification of 53 metabolites. However, the spectrum has some interferences, because there is a significant protein background (Figure 10). To diminish this interference, some variations were made to this method, such as the addition of some substances to assess if they could influence either the protein background or the identification of different/more metabolites.
First, hexafluorobenzene was one of the substances tested and the results had no significant variations between the different volumes tested. Unfortunately, the addition of hexafluorobenzene did not increase the metabolite content but some of the metabolites even disappeared, e.g. acetone (Figure 11). Nevertheless, it helped reducing the protein background (Figure 12). However, the compound itself seemed to cause new interferences in spectrum. When the compound was analysed alone, despite not having hydrogens, it had some signals in the NMR spectrum that was not supposed to have (Figure 13).
Figure 10. Expanded Regio ns o f Pla sma P aft er Protein Precip it at io n Using MeOH. There is a huge protein backgro und.
Figure 11. Expanded Regio ns o f Plas ma P aft er Protein Precip it at io n Using MeOH: 1 - wit h Hexa fluo ro benzene ; 2 - wit ho ut Hexafluo ro benzene. The met abo lit e aceto ne is not det ected in 1.
Second, adding aluminium sulphate to the sample was other option and it had the advantage of reducing protein background (Figure 14). In contrast, it had the disadvantage of decreasing the number of metabolites detected. Compounds like 1-methylhistidine disappeared (Figure 15), which reduced the number of metabolites detected. The different aluminium sulphate volumes added to the samples (20 µL and 40 µL) caused the same effect, with no further decrease of protein background with increasing volume.
Figure 13. Expanded Regio ns o f Hexafluo ro benzene Spectrum sho wing t he signa ls int erference present in t his co mpo und.
Figure 14. . Expanded Regio ns o f Pla sma P aft er Protein Precip it at io n Using MeOH. Green Line – wit h 30 µL o f Alu miniu m Su lp hat e; Red Line - wit h 20 µL o f Alu min iu m Sulp hat e; B lue Line - wit ho ut Alu miniu m Sulp hat e. The backgro und proteins is reduced in green and red line.
Figure 12. Expanded Regio ns o f Plas ma P aft er Protein Precip it at io n Using MeOH: red line - w it h Hexa fluo ro benzene; blue line - wit ho ut Hexafluo ro benzene. The protein backgro und is reduced in red line.
Third, when guanidine is added to this method, it can be clearly seen that the protein background decreases and the number of metabolites detected still remains the same. However, the volume of added 3 M guanidine is an important variable. A volume of 10 µL reduces protein background and maintains the intensity of the signals. When the volume of guanidine is increased (from 10 to 20 to 30 µL) the protein background does not vary much but some signals are no longer well-resolved, making the assessment of the multiplicities ambiguous (Figure 16). Moreover, some compounds, like acetone, disappear when the volume is increased (Figure 17).
Figure 15. Expanded Regio ns o f Plas ma P aft er Protein Precip it at io n Using MeOH: 1 - wit h 30 µL o f Alu miniu m Su lphat e; 2 - with 20 µL o f Alu miniu m Su lphat e; 3 - wit ho ut Alu miniu m Su lphat e. The met abo lit e 1-methylh ist id ine is no t detect ed in 1 and 2.
Figure 16. Expanded Regio ns o f Plas ma P aft er Prot ein Precip it at io n Using MeOH. Purple Line - wit h 30 µL o f Guanid ine ; Green Line – wit h 20 µL o f Guanid ine; Red Line - wit h 10 µL o f Guanid ine ; B lue Line - wit ho ut Guanid ine. The prot ein backgro und is reduced co mpared to t he Blue Line, but bet ween guanid ine sa mp le lines it does not vary much.
Other modification tested in this method was to evaporate the MeOH with lyophilization instead of drying with concentrator. This alteration did not show beneficial results, because the intensity of some signals was diminished (Figure 18).
Figure 17. Expanded Regio ns o f Plas ma P aft er Protein Precip it at io n Using MeOH: 1- wit h 30 µL o f Guanid ine; 2 - wit h 20 µL o f Guanid ine ; 3 - wit h 10 µL o f Guanid ine ; 4 – wit ho ut Guanid ine. The met abo lit e aceto ne is not det ect ed in 1 and 2.
Figure 18. Expanded Regio ns o f Serum A aft er Protein Precip it at io n Using MeOH: 1 – Evapo rat io n wit h Lyo philizat io n; 2 – Evaporat io n wit h Co ncentrator. The int ensit y o f t he asparagine sig na l is dimin is hed.
Protein Precipitation with Methanol-Dichloromethane
When testing protein precipitation with MeOH-DCM, the same modifications were performed as discussed above with MeOH extraction and they caused practically the same effects. However, when compared with precipitation with MeOH, the MeOH-DCM extraction had the advantage of showing less protein background (Figure 19). Besides that, the number of metabolites detected was the same, however the signals had less intensity, with some metabolites, as choline, having only traces, or as proline, where some signals are no longer visible (Figure 20).
The only exception was the use of MeOH-DCM precipitation with lyophilization, which allowed the detection of an extra metabolite – benzoate (Figure 6). However, it had the same problems as any other sample treated with MeOH-DCM that intensities of many other compounds reduced.
Figure 19. Expanded Regio ns o f Pla sma P aft er Protein Precip it at io n Using: Red Line - MeOH; B lue Line – DCM. The prote in backgro und is diminished when using MeOH-DCM.
Figure 20. Expanded Regio ns o f Plasma P aft er Protein Precip it at io n Using: 1 - MeOH; 2 – MeOH-DCM. Bot h cho line and pro line ha ve less int ensit y a nd are less de fined in sa mp le using MeOH-DCM.
Ultrafiltration
Regarding ultrafiltration methods, both 0.5 mL and 2 mL filters produced similar spectra. The greatest advantage of this method is the efficient elimination of protein, being the method with the minimum protein background among all the methods tested (Figure 21). However, it has the downside of losing the metabolite tryptophan from all the samples (Figure 22).
Figure 21. Expanded Regio ns o f: Blue line – Serum A a ft er Protein Precip it at io n Using MeOH and Guanid ine ; Red Line - Serum A a ft er Protein Precip it at io n Using MeOH-DCM and Guanid ine ; Green Line – Serum A aft er Ult rafilt rat io n wit h 0.5 mL Filt ers. The prot ein backgro und is t he lo west wit h ultr afilt rat ion met hod.
Figure 22. Expanded Regio ns o f: 1- Serum A aft er Protein Precip it at io n Using MeOH; 2 – Serum A aft er ultrafilt rat io n wit h 2 mL filt ers; 3 - Serum A a ft er ult rafilt rat io n wit h 0.5 mL filt ers. The met abo lit e trypto phan is not present aft er ult rafilt rat io n.
Moreover, obtaining a well resolved spectra with this method is related to an efficient prerinsing of the filters, to eliminate the glycerol interference. The filters were rinsed either with water or sodium 0.1 M hydroxide. When the filter is rinsed with sodium 0.1 M hydroxide, the filter contains more interfering signals, and as a consequence, sample spectrum has also more interferences (Figure 23). Besides that, some compounds are no longer detected, as urea, threonine and glutamine (Figure 24). When the filter is washed with water the results are better, with less interference, however the interference does not disappear completely (Figure 23). There are still some traces of glycerol in the filter.
Figure 23. Expanded Regio ns o f: 1 – NaOH fro m t he last rinse (7º) o f t he filt er; 2 – wat er fro m t he last rinse (7º) o f t he filt er. Bot h st ill ha ve residues o f glycero l and 1 ha ve mo re int erferences besides g lycero l.
Figure 24. Expanded Regio ns o f Serum A aft er Ult rafilt rat io n wit h: 1 - 0.5 mL filt ers aft er pre-rins ing w it h NaOH; 2 - 0.5 mL filt ers after pre -pre-rinsing wit h wat er. When washed w it h NaOH co mpo unds such as urea, t hreo nine and glu t amine disappear.
Guanidine
In every sample where guanidine had been added, an extra NMR signal appeared at 5.55 ppm area and its multiplicity corresponds to a doublet (Figure 25). This signal does not correspond to any metabolite that were attempted to identify and, even using databases, it was not possible to identify what causes this signal with just a 1D NMR analysis. The concentration of this unknown metabolite was so low that the measurement of 2D spectra did not show any correlations to this compound.
Figure 25. Expanded regio ns o f Serum A a ft er Prot ein Precip it at io n Using MeOH and Guanid ine. At 5.55 ppm t here is a d oublet , whic h appears in all sa mp les where guanid ine was added .
Discussion
The construction of the metabolite library did not present practically any difficulties, being possible to identify 64 of the 65 compounds that were intended to be identified. Besides that, the chemical shifts and the multiplicities of the signals in this library are similar to other libraries built in other studies and databases, e.g. publication of Nagana Gowda et al. entitled
“Expanding the Limits of Human Blood Metabolite Quantitation Using NMR Spectroscopy”
and HMDB. The publication of Nagana Gowda et al. formed the base of this project and the aim was to be able to identify at least the same set of metabolites (ca. 70) from serum/plasma samples that they presented. However, there are three compounds that were included in the metabolite library but were not in this publication: acetoacetic acid, phosphocholine and pyruvic acid. The chemical shifts and signal multiplicities of these compounds were compared with HMDB - acetoacetic acid: 2.27 (s) and 3.43 (s); phosphocholine: 3.21 (s), 3.59 (t) and 4.16 (m); pyruvic acid: 2.46 (s) - (4). The similarity between different studies, makes the obtained library more reliable
However, publication of Nagana Gowda et al. identified a total of 70 compounds (considering α- and β-glucose and α- and β-mannose as different metabolites), including two other compounds: 2-hydroxybutyric acid and 2-propanol - that were not added to our metabolite pool solutions. Which means that the metabolite library built in this project could be even more complete.
Regarding the detection of metabolites in blood samples, there were some obstacles. The main one was the presence of glucose, also being a problem mentioned in other studies, as the publication of Nagana Gowda and Daniel Raftery entitled “Can NMR solve some significant
challenges in metabolomics?”. Glucose has many signals with high intensity, so they can
overlap with other signals arising from metabolites present in low concentrations. Due to this reason, some metabolite signals that are located in the area of glucose signals may overlap. According to databases and other libraries, metabolites such as aspartate, arginine, glutamine, glutamate and 1,2-propanediol have some signals in this area. However, in this study it was not possible to identify any of these signals on this area, due to the high intensity of glucose signals. Nevertheless, all these metabolites have at least one signal in other part of the spectrum, so the metabolites can still be identified and quantified.
About the deproteination methods tested and all the variations made to the methods, they all showed some improvements with some of the changes having some disadvantages too.
Protein precipitation with MeOH was the method where it was tested if the addition of certain substances could influence the detection of metabolites and their linkage to proteins.
Hexafluorobenzene caused a decrease for protein background. However, the number of detected metabolites decreased too. Besides that, the spectra had some interferences, which can mean that the compound used was contaminated or degraded. So, the results with this compound are not reliable. Also, addition of aluminium sulphate decreased the protein background, with the same problem of reducing the number of metabolites detected. The increase of the aluminium sulphate volume did not improve the results. Guanidine, as the other two substances, also decreased protein background, but the number of detected metabolites were not diminished. Besides that, varying the volume of added guanidine caused different results. When the volume was increased over 10 µL, some signal intensities were reduced and some metabolites were even lost. Using the volume of 10 µL, the metabolite signal intensities and the number of metabolites remain still the same when compared to MeOH extraction without addition of guanidine. In conclusion, the addition of guanidine in a certain volume (10 µL) has advantages when analysing blood metabolites. However, this finding cannot be verified or compared with other studies, because guanidine has not been used in other studies. Further tests with additional serum/plasma samples should be made to verify the potential usefulness of guanidine addition.
Regarding protein precipitation with MeOH-DCM, it presents some improvements when compared with protein precipitation with MeOH. The use of MeOH-DCM reduced the protein background more than the protein precipitation only with MeOH, maintaining the number of metabolites detected. Although the intensity of the signals were reduced, with some metabolites almost disappearing. Interestingly, one additional metabolite, benzoate, could be detected when the drying step was performed by lyophilization.
Considering the ultrafiltration method, the results whether using 2 mL filters or 0.5 mL filters were similar. The greatest advantage of using filters is that the proteins can be removed more efficiently. However, the number of detected metabolites decrease together with metabolite signal intensities. Besides that, tryptophan was never detected with this method, not only in this study. This could be due to the fact that tryptophan binds strongly to proteins, and thus, ultrafiltration is too fast to allow the separation between tryptophan and proteins (12). For other metabolites that also bind to proteins, but with not so much affinity, they are still detected in spectrum, but the intensity of its signals are reduced. Moreover, ultrafiltration has the extra problem of filters containing a lot of glycerol that prevents filter surface from drying. Thus, before use the filters have to be rinsed either with water or sodium 0.1 M hydroxide. The results
seemed to be better when using water. However, in this experiment the glycerol interference never disappeared completely. In order to eliminate completely this interference, the number of washing cycles should be increased.
In this study both plasma and serum samples were used and both materials have shown to yield similar results.
In comparison with metabolite library samples, where the pool solutions were made in a way that there is no interference and no overlap between metabolite signals, in serum/plasma samples this is not a reality. The metabolites are all mixed in blood and they are not separated but analysed as one sample. Thus, some metabolite signals overlap with others, some metabolites have so low concentrations that they are not detected and some metabolites do not exist in each sample. Due to this reason, some compounds are not detected and in the case of some of the metabolites it was not possible to identify all the signals they give to the spectrum, according to databases, libraries and the metabolite library of this study. As an example, asparagine has three signals in metabolite library - 2.85 ppm (m); 2.95 ppm (m) and 4.00 ppm (dd) -, however from serum/plasma samples it is only possible to detect one signal - 4.007 ppm (m). This is due to the low concentration of this metabolite - it is possible to detect some traces of the other signals, however is not possible to assess which of those signals belong to asparagine. As for glutamine, in metabolite library it has three signals - 2.139 ppm (m); 2.45 ppm (m); 3.774 ppm (t) -, however in serum/plasma samples only 2 signals can be detected - 2.131 ppm (m); 2.446 ppm (m). This is due, as mentioned before, the high intensity of glucose signals in the area of 3.7-3.8 ppm, which overlap other signals that may exist. However, it is not necessary that all the metabolite signals are detectable in complex mixtures, such as blood samples, to be able to quantify the metabolite. Obviously, peak assessment has to be performed carefully and spiking experiments can be done.
In conclusion, the method that provided the best results was protein precipitation with MeOH, with 10 µL addition of guanidine. With this method, it is possible to identify 54 metabolites, with highest signal intensities and also the protein background could be diminished to some extent. From the 55 metabolites identified, only one was not identified with this method. The exception is benzoate and it was detected exclusively in serum samples (A and O) subjected to a protein precipitation with MeOH-DCM and evaporated by lyophilization. However, there are still many unidentified signals in the serum/plasma 1H NMR spectra and