Identifying Small Market Segments with
Mixture Regression Models
Ana Oliveira-Brochado#1, Francisco Vitorino Martins*2
# Instituto Universitário de Lisboa (ISCTE-IUL), Departamento de Marketing, Operações e Gestão Geral, Business
Research Unit (BRU/UNIDE)
Av. Forças Armadas1649-026 Lisboa, Portugal 1
*Faculdade de Economia da Universidade do Porto (FEP-UP) Rua Dr. Roberto Frias, 4200-464 Porto, Portugal
2
Abstract - The purpose of this work is to determine how
well criteria designed to help the selection of the adequate number of market segments perform in recovering small niche market segments, in mixture regressions of normal data. As in real world data the true number of market segments is unknown, the results of this study are based on experimental data. The simulation experiment compares 27 segment retention criteria, comprising 14 information criteria and 13 classification-based criteria. The results reveal that AIC3, AIC4, HQ, BIC, CAIC, ICLBIC and ICOMPLBIC are the best criteria in recovering small niche segments and encourage its use.
Keywords - Market segmentation, niche markets, mixture regression models, experimental design.
1.
Introduction
Mixture regression models have recently received increasing attention from both academics and practitioners as a statistical model-based approach to deal with consumer heterogeneity and thus to identify effective market segments. In fact, several studies have set out to assess the relative performance of different segmentation methods for segmenting the market (Vriens et al. 1996, Magidson and Vermunt 2002, Andrews et al. 2010, Kim and Lee 2011) and concluded that mixture regression modelling outperformed other approaches in terms of marketing strategy potential. Mixture regression models “are the newest of the segmentation methods” (Kim and Lee, 2011: 157) and claimed to be the “most powerful algorithm for market segmentation” (Wedel and Kamakura 2000: 26). According to Andrews et al. (2010: 1) this approach is clearly preferred “if it is important to understand the true
segmentation structure in a market as well as the nature of the regression relationships within segments”.
However, in spite of the popularity of mixture regression models for normal data in market segmentation problems, the decision of how many market segments to keep for managerial decisions is, according to many authors (DeSarbo et al. 1997, Wedel and DeSarbo 1995, Wedel and Kamakura 2000, Hawkins et al. 2001, Andrews and Currim 2003a,b, Sarstedt 2008), an open issue without a satisfactory statistical solution. To assess the true number of market segments is essential because many marketing decisions -segmentation, targeting, positioning, marketing mix – depend on the correct specification of the models used as input to these decisions (Sarstedt 2008). A misspecification of the model resulting in under or over specification might lead to erroneous estimations of the response by consumers to marketing efforts.
In order to reduce some of the subjectivity in this task, managers often rely on heuristics as information and classification-based criteria to guide them on the selection of the model to pick (Dillon and Mukherjee, 2005). Therefore, it is important to understand how the segment retention criteria behave. Besides, since the true number of market segments in real world data is unknown, the evaluation of the effectiveness of segment criteria is usually accomplished through an experimental design. It is generally clear from previous simulation studies focusing on the segment retention problem in mixture regression models that the type of distribution being mixed, the model specification and the characteristics of the market affect the accuracy of commonly used segment retention criteria and that additional research should continue to search for
____________________________________________________________________________________ International Journal of Latest Trends in Finance & Economic Sciences IJLTFES, E‐ISSN: 2047‐0916
better criteria for market segmentation under specific data characteristics.
Consequently, the aim of this work is to determine how well criteria designed to help the selection of the adequate number of market segments perform in mixture regression models of normal data, addressing a special market condition not considered in previous studies, that is considering into the same simulated sample small niche segments with different degrees of separation and different sizes. As a large number of criteria were not considered before, we aim at comparing the performance of 27 criteria.
We aim at providing guidelines to marketing practitioners to improve the use of the model fit indices to identify small market segments (Goller et al 2002).
The plan of this work is as follows: we start reviewing the mixture regression model for normal data, followed by a brief description of the criteria that we aim to compare and a summary of the results obtained in previous studies on this matter. Next, we describe the experimental design used to generate the simulated data. After that, we provide a discussion of the findings of the study and finish with a conclusion.
2.
Background
2.1. Multivariate Normal Mixture Regression Mixture regression models are predictive approaches for segmentation analysis (Wedel and Kamakura 2000). Indeed, the rationale of this statistical approach is to identify segments that are homogeneous in terms of response coefficients (Magidson and Vermunt 2002), thus providing a direct linkage between actual behaviour (i.e., the dependent variable) in the marketplace and managerially actionable variables of the marketing mix or consumer characteristics (i.e., the predictors). As the number and structure of market segments are determined by the researcher on the basis of the results of the data analysis, mixture regression models are also post hoc approaches (Wedel and Kamakura 2010). Thus, to help the analysis of the available approaches to select the number of market segments, a brief description of the notation of the well-known classical mixture regression model (Wedel and DeSarbo, 1995) is previously presented. Let:
1,..., indicate derived segments; 1,..., indicate consumers;
1,..., indicate repeated observations from consumer ; 1,..., indicate explanatory variables;
be the value of - regression c js s S n N r R n j J j th
oefficient for the - cluster; ;
be the covariance matrix for segment ;
be the value of the dependent variable for repeated measure on consumer ; ;
be the value of the -s js s nr n nr njr s th s y r n y x j th β Σ y
independent variable for repeated measure on consumer ; . n njr r n x x
Assume that the metric dependent vector n ynr
y is
distributed as a finite mixture of S conditional multivariate normal densities (1):
1 ~ S , , n s s n n s s s f
y y x β Σ (1)where
f
s is defined by the expression:
, ,
2 R2 1 2exp 1 2
'
1 '
's n n s s s n n s s n n s
f y x β Σ y x β y x β
(2)
and
s, s1,...,S are independent mixing proportionssatisfying the following restrictions:
0s1 (3) 1 1
S s s . (4)Given a sample of N independent consumers, one can thus derive the likelihood (5) and the log-likelihood (6) expressions:
1 1 , ,
N S s s n n s s s n L f y x β Σ (5)
1 1 ln ln , ,
N S s s n n s s n s L f y x β Σ (6)The implementation of the maximum likelihood procedure is done by using an Expectation-Maximization – EM type framework (Dempster et al. 1977). In order to derive the EM algorithm it is necessary to introduce non-observed data via the indicator function: zns 1, if n comes from latent
class s and zns0, otherwise; it is assumed that zns
are i.i.d multinomial. So, the joint likelihood of the “complete data” yn
ynr and zn
zns for all consumers is:
1 1 1 1 ln ln , , ln
N S
N S c ns s n n s s ns s n s n s L z f y x β Σ z (7)Once estimates of λ, Σ and β are obtained for any M-step procedure, one can assign each consumer n to each market segment S via estimated posterior
probability (applying Bayes’ rule), providing a fuzzy clustering (E-step):
1 , , , ,
s s n s s ns S s s n s s s f p f y X β Σ y X β Σ , (8) where 1 1 S ns s p
, and 0pns1.The expectation and maximization steps of this algorithm are alternated until convergence of a sequence of log-likelihood values is obtained. 2.2. The Criteria
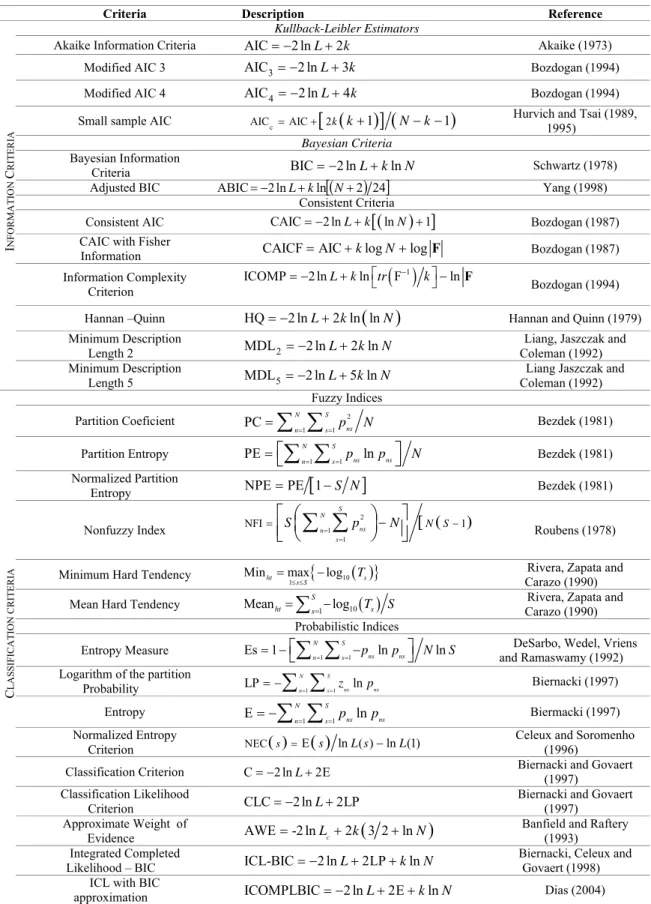
Retaining the right number of market segments as long been a practical issue confronting marketing researchers who use mixture regression models to identify groups of homogeneous consumers that have clear marketing strategy potential. To guide them on this decision, we aim at comparing the performance of 13 information criteria and 14 classification-based criteria, described subsequently, through a simulation experiment. Information Criteria attempt to balance the increase in fit obtained against the larger number of parameters estimated for models with more clusters. As the likelihood increases with the addition of a component to a mixture model, these criteria account for over-parameterization assuming the general form IC s 2lnLdk s, where k is the s
number of parameters associated to a solution with S clusters and d is some constant or the “marginal cost” per parameter (Bozdogan, 1987). Information Criteria are a general family, including criteria that are estimates of (relative) Kullback-Leibler distance, approaches that have been derived within a Bayesian framework for model selection and those named consistent criteria. However, it is also important to ensure that the segments are sufficiently separated to the selected solution. To evaluate the ability of a mixture model in providing well-separated clusters, an entropy statistic can be used to evaluate the degree of separation in the estimated posterior probabilities. This approach yields the Classification Criteria. Some measures are derived in the context of mixture models and other are “imported” from the fuzzy literature (Bezdek et al., 1997). Accordingly, the quantities pns are interpreted as partial memberships in the context of fuzzy indices and as probabilities of membership in the context of probabilistic indices. The reader is referred to the references cited below (Table 1) for a detailed discussion of the theoretical underpinnings of the criteria compared in this study.
2.3. Previous simulation studies
Few comprehensive studies have been published focusing on the segment retention problem in mixture regression models of normal data. The first work, by Hawkins et al. (2001), examined the performance of 12 base criteria, namely AIC (Akaike, 1973), AIC3 (Bozdogan, 1994), MDL (Rissanen, 1986, 1987), ICOMP (Bozdogan, 1993), CL, NEC (Celeux and Soromenho, 1996), PC (Bezdek, 1981), AWE (Banfield and Raftery, 1993), MIR (Windham and Cutler, 1992), ALL, ANC, WID (Cutler and Windham, 1994) by varying the number of mixture components, the degree of separation between components and the mixing proportions. The authors concluded that PC was the least successful criterion and report good results for MDL and AWE. The study by Andrews and Currim (2001) compared the performance of AIC (Akaike 1993), AIC3 (Bozdogan, 1994), BIC (Schwartz, 1978), CAIC (Bozdogan, 1987), ICOMP (Bozdogan, 1993), NEC (Celeux and Soromenho, 1996) and the validation sample log likelihood (Andrews and Currim, 2001a) manipulating eight data characteristics, namely: true number of segments, mean separation between segment coefficients, number of individuals, number of observations per individual, number of predictors, error variance, minimum segment size and measurement level of predictors. The authors found that AIC3 is the best criterion to use with mixture regression models. The work by Sarstedt (2008) evaluated how the interaction between sample size and number of components affects the performance of the four most used criteria used in market segmentation according to a meta-analysis study - AIC (Akaike, 1973), AIC3 (Bozdogan, 1994), CAIC (Bozdogan, 1987) and BIC (Schwartz, 1978). The author concluded that AIC shows an extremely poor performance and that AIC3 outperforms the other considered criteria across all simulation experiments. Moreover, using AIC may not provide satisfactory performance, especially when the sample size is small and tend to fit too many components (i.e., overcluster).
Table 1. Information Criteria and Classification Criteria
Criteria Description Reference
I NF OR M A T ION C RI TERI A Kullback-Leibler Estimators
Akaike Information Criteria AIC 2 lnL2k Akaike (1973)
Modified AIC 3 AIC3 2 lnL3k Bozdogan (1994)
Modified AIC 4 AIC4 2 lnL4k Bozdogan (1994)
Small sample AIC AICc AIC
2k
k1
N k 1
Hurvich and Tsai (1989, 1995)Bayesian Criteria
Bayesian Information
Criteria BIC 2 lnLklnN Schwartz (1978)
Adjusted BIC Yang (1998)
Consistent Criteria
Consistent AIC CAIC 2 lnLk
lnN
1
Bozdogan (1987) CAIC with FisherInformation CAICF AIC klogNlogF Bozdogan (1987) Information Complexity
Criterion
1
ICOMP 2 lnLklntr F klnF
Bozdogan (1994) Hannan –Quinn HQ 2 lnL2 ln lnk
N
Hannan and Quinn (1979) Minimum DescriptionLength 2 MDL2 2 lnL2 lnk N Coleman (1992) Liang, Jaszczak and Minimum Description
Length 5 MDL5 2 lnL5 lnk N Coleman (1992)Liang Jaszczak and
C LA SSI FI C A TIO N C RI T E R IA Fuzzy Indices Partition Coeficient 2 1 1 PC N S ns n s p N
Bezdek (1981) Partition Entropy 1 1 PE N S ln ns ns n s p p N
Bezdek (1981) Normalized PartitionEntropy NPEPE 1 S N
Bezdek (1981)Nonfuzzy Index
2 1 1 NFI 1 S N ns n s N S S p N
Roubens (1978)Minimum Hard Tendency
10
1
Minht max log s s S
T
Rivera, Zapata and
Carazo (1990) Mean Hard Tendency Mean 1 log10
S
ht
s Ts SRivera, Zapata and Carazo (1990) Probabilistic Indices
Entropy Measure Es 1 N1 S1 ln ln
ns ns
n s p p N S
DeSarbo, Wedel, Vriensand Ramaswamy (1992) Logarithm of the partition
Probability LP 1 1 ln N S ns ns n s z p
Biernacki (1997) Entropy 1 1 E N S ln ns ns n s p p
Biermacki (1997) Normalized EntropyCriterion NEC
s E
s ln ( ) ln (1)L s L Celeux and Soromenho (1996) Classification Criterion C 2 lnL2E Biernacki and Govaert (1997)Classification Likelihood
Criterion CLC 2 lnL2LP Biernacki and Govaert (1997) Approximate Weight of
Evidence AWE-2 lnLc2k
3 2 ln N
Banfield and Raftery (1993) Integrated Completed
Likelihood – BIC ICL-BIC 2 lnL2LPklnN
Biernacki, Celeux and Govaert (1998) ICL with BIC
approximation ICOMPLBIC 2 lnL2EklnN Dias (2004)
2 24
ln ln 2 ABIC Lk N
3. Experimental Design
3.1. The data
As our goal is to assess how segment retention criteria behave in recovering small market segments, the experiment is based on what we label the group satellite case (see Figure 1): two large and well-separated market segments (named the independent and the main group) and one small market segment (named the satellite group in relation to the main group), with a degree of separation small, medium or large to the main group. As benchmarking case we consider two well-separated clusters with equal size. This second data enables us to evaluate in what extend segment retention criteria loose performance when we add a small market segment to the market segmentation solution.
Independent Group Main Group Satellite Group
Figure 1. Satellite Group Case
In this experiment we consider six predictors, three continuous and three binary, 300 individuals with 10 observations per individual (yielding 3000 observations per data set) and an error variance of 20%. We first computed, for each subject n and all replications: U=Xβ; subsequently we added an error termto these true values U, Y=U+ε; the variance of the error term was obtained from (9) (Wittink and Cattin, 1981, Vriens et al., 1996):
2 2 2 2 2 1 u u PEV PEV PEV (9)
where PEV is the percent of error variance, u2 is the variance of U and is the variance of the 2 error term ε.
The mean separation between the segment coefficients is set large between the independent and the main group, and large (l), medium (m) or small (s) between the main and the satellite group, as detailed subsequently. We first randomly generate the vector of parameters for the main group βMainin the range of -1.5 to 1.5. Next, we compute a vector of separations with mean 1.5 (l), 1.0 (m) or 0.5 (s) and standard deviation 10% of the mean. Then, we generate a vector of sign
S for δi, il m s, , , yielding
segments that are not more sensitive than the others in every way. We then compute a vector of coefficients for the Satellite Group
Sat Main i
β β S δ ,il m s, , (element by element) and
a vector of coefficients for the Independent Group
Ind Main l
β β S δ. Although we considered minimum segment sizes to the satellite (5% to 10%), main (40% to 50%) and independent (40% to 55%) groups, the segment size is randomly generated in these ranges.
The likelihood function was maximized using the EM algorithm implemented into the Gauss package that was run repeatedly with three replications in order to avoid its convergence to local maxima. Then, for each number of mixture components, the best solution was retained.
For simplicity, we named each experimental design with the following notation Design Type (group satellite - GS or benchmarking - B)/Degree of separation between the main group and the satellite group (large – L, medium – M or small - S).
3.2. Performance Measures
We evaluate the performance of segment retention criteria by their success rate, or the percentage of datasets in which the criteria identify the correct number of segments; we also consider the over fitting rate and the under fitting rate. Given two criteria with similar success rates, we prefer the under fitting to the over fitting. Indeed, empirical results show that over fitting produces larger parameters bias than under fitting does (Andrews and Currim, 2003a,b), sometimes produce very small segments with large or unstable parameter values (Cutler and Windham, 1994) and may result in fitting spurious regressions in non-existent components (Naik, 2007). Moreover, from a managerial stand point in this specific experiment, a solution with 2 market segments where the consumers belonging to the group satellite case are assigned to the main group seems to make more sense than a solution with 4 segments.
3.
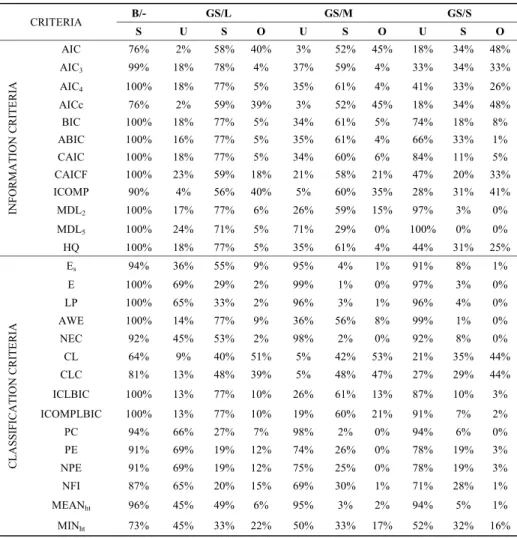
Results
Table 2 shows the success rates (S), rates of over fitting (O) and rates of under fitting (U) for the four designs. As example, to the GS/L experiment AIC correctly identified the true number of segments in 58% of data sets, over fitted the number of components in 40% of the data sets and under fitted the number of components in 2% of these data sets.
Table 2. Rates of underfitting (U), success (S) and (O) overfitting by design
CRITERIA B/- GS/L GS/M GS/S S U S O U S O U S O INF O R M ATION C R ITE R IA AIC 76% 2% 58% 40% 3% 52% 45% 18% 34% 48% AIC3 99% 18% 78% 4% 37% 59% 4% 33% 34% 33% AIC4 100% 18% 77% 5% 35% 61% 4% 41% 33% 26% AICc 76% 2% 59% 39% 3% 52% 45% 18% 34% 48% BIC 100% 18% 77% 5% 34% 61% 5% 74% 18% 8% ABIC 100% 16% 77% 5% 35% 61% 4% 66% 33% 1% CAIC 100% 18% 77% 5% 34% 60% 6% 84% 11% 5% CAICF 100% 23% 59% 18% 21% 58% 21% 47% 20% 33% ICOMP 90% 4% 56% 40% 5% 60% 35% 28% 31% 41% MDL2 100% 17% 77% 6% 26% 59% 15% 97% 3% 0% MDL5 100% 24% 71% 5% 71% 29% 0% 100% 0% 0% HQ 100% 18% 77% 5% 35% 61% 4% 44% 31% 25% C L ASSIFI CATIO N C RITE R IA Es 94% 36% 55% 9% 95% 4% 1% 91% 8% 1% E 100% 69% 29% 2% 99% 1% 0% 97% 3% 0% LP 100% 65% 33% 2% 96% 3% 1% 96% 4% 0% AWE 100% 14% 77% 9% 36% 56% 8% 99% 1% 0% NEC 92% 45% 53% 2% 98% 2% 0% 92% 8% 0% CL 64% 9% 40% 51% 5% 42% 53% 21% 35% 44% CLC 81% 13% 48% 39% 5% 48% 47% 27% 29% 44% ICLBIC 100% 13% 77% 10% 26% 61% 13% 87% 10% 3% ICOMPLBIC 100% 13% 77% 10% 19% 60% 21% 91% 7% 2% PC 94% 66% 27% 7% 98% 2% 0% 94% 6% 0% PE 91% 69% 19% 12% 74% 26% 0% 78% 19% 3% NPE 91% 69% 19% 12% 75% 25% 0% 78% 19% 3% NFI 87% 65% 20% 15% 69% 30% 1% 71% 28% 1% MEANht 96% 45% 49% 6% 95% 3% 2% 94% 5% 1% MINht 73% 45% 33% 22% 50% 33% 17% 52% 32% 16%
As expected, all the criteria perform better in the benchmarking case than in the group satellite case. Indeed, almost all criteria exhibit high performance rates for two well separated segments with equal samples sizes, ranging from 64% to 100%.
The results also revealed that almost all criteria have higher success rates for larger separation rates between the main group and the satellite group.
In general, the information criteria AIC3, AIC4, HQ, BIC, ABIC, CAIC and the classification criteria ICL and ICLBIC have the best overall performance in recovering a small market segment. The criteria AIC, ICOMP, CL and CLC present the undesirable tendency to overestimate the number of components, and fuzzy indices and some probabilistic indices exhibit high rates of under fitting.
4.
Conclusion
As the correct number of segments is unknown in market segmentation applications, a though understanding of measures that guide model selection decision is of fundamental importance. Indeed, if managers take the wrong measure into consideration, their decisions may be misguided. Since previous studies point out that market characteristics affect the accuracy of segmentation retention criteria, this study addressed a special market condition not considered in previous studies, that is considering into the same simulated sample market segments with different degrees of separation and different sizes. Indeed, this study offers researchers and practitioners with a better understanding of the effectiveness of 27 criteria in recovering small market segments.
It is generally clear from comparing the results of this study to those of Andrews and Currim (2003a), Hawkins et al., 2001 and Sarstedt (2008) that almost all criteria perform well when there are two well separated market segments with the same sample size. The presence of a niche market adds complexity to the decision. However, most of the information and classification criteria observe improvements in average accuracy rates for a larger separation between the main and the group satellite case.
Our simulation results revealed that both information criteria - AIC3, AIC4, HQ, ABIC, BIC and CAIC - and classification criteria - ICLBIC, ICOMPLBIC - are the best segment retention criteria to recover small niche segments. This result is consistent with Hawkins (1999: 70) who stated that “augmented complete log likelihood functions may be the next generation of measures for investigation”. However, some of these criteria (i.e., AIC3, AIC4, HQ, ICLBIC, ICOMPLBIC) are rarely applied in the market segmentation literature (Sarstedt, 2008). Furthermore, the accuracy of AIC3 is being consistent in different studies addressing different data characteristics in mixture regression models for normal data (Andrews and Currim, 2003; Sarstedt, 2008).
As researchers rely on heuristics as information and classification based criteria to guide them on the selection of the number of market segments to pick, a thorough understanding of the performance of these measures across different data characteristics is of utmost importance. We also emphasize the importance of applying criteria to decide the adequate number of segments that have been validated, given that results can be substantially different depending on the choice of method in practice. We also maintain that there is significant room for improvement in current practice and that more research is necessary, to be confident in recommending the most appropriate criteria or set of criteria. In fact, this work could be extended by considering other scenarios characterized by two or more niche markets.
References
[1] Akaike, H. (1973), Information Theory as an Extension of the Maximum Likelihood Principle. In B.N. Petrov and Csaki (Eds.), Second International Symposium on Information Theory, Budapest: Akademiai Kiado, pp. 267-281.
[2] Andrews, R. L. and Currim, I. S. (2003b), A Comparison of Segment Retention Criteria for Finite Mixture Logit Models, Journal of Marketing Research, Vol. 40, No. 2, pp. 235-243.
[3] Andrews, R. L. and Currim, I.S. (2003a), Retention of Latent Segments in Regression-Based Marketing Models, International Journal of Research in Marketing, Vol. 20, No. 4, pp. 315-321.
[4] Andrews, R. L.; Brusco, M.; Currim, I.S., Davis, B. (2010). An Empirical Comparison of Methods for Clustering Problems: Are There Benefits from Having a Statistical Model? Review of Marketing Science. Vol. 8, No. 3, 34p.
[5] Banfield, J. D. and Raftery, A. E. (1993), Model-Based Gaussian and Non-Gaussian Clustering, Biometrics, Vol. 49, No. 3, pp. 803-821.
[6] Bezdek, J. C. (1981). Pattern Recognition with Fuzzy Objective Function Algorithms, Plenum Press.
[7] Bezdek, J. C., Li, W. Q., Attikiouzel ,Y. and Windham, M. (1997), A Geometric Approach to Cluster Validity for Normal Mixtures, Soft Computing, Vol. 1, No. 4, pp. 166-179.
[8] Biernacki, C. (1997). Choix de modèles en classification, Doctoral Dissertation, Université de Technologie de Compiègne, available at
http://www-math.univ-fcomte.fr/pp_Annu/CBIERNACKI/.
[9] Biernacki, C. and Govaert, G. (1997), Using the Classification Likelihood to Choose the Number of Clusters, Computing Science and Statistics, Vol. 29, No 2, pp. 451-457.
[10] Biernacki, C., Celeux, G. and Govaert, G. (1998), Assessing a Mixture Model for Clustering with the Integrated Completed Likelihood, Technical Report N.º3521, Rhône-Alpes: INRIA.
[11] Bowman, D., Heilman, C. and P. B. Seetharaman (2004). Determinants of Product-Use Compliance Behavior", Journal of Marketing Research, Vol. 41, No. 3, pp. 324-338.
[12] Bozdogan, H. (1987), Model selection and Akaike´s Information Criterion (AIC): the
General Theory and its Analytical Extensions, Psychometrika, Vol. 52, No. 3, pp. 345-370. [13] Bozdogan, H. (1993), Choosing the Number of
Component Clusters in the Mixture-Model Using a New Informational Complexity Criterion of the Inverse-Fisher Information Matrix. In O. Opitz, B. Lausen, and R. Klar (eds.), Studies in Classification, Data Analysis, and Knowledge Organization, , Heidelberg: Springer-Verlag, pp. 40-54.
[14] Bozdogan, H. (1994), Mixture-Model Cluster Analysis Using Model Selection Criteria and a New Information Measure of Complexity. In H. Bozdogan (eds.), Proceedings of the Fist US/Japan Conference on the Frontiers of Statistical Modeling: An Informational Approach, Vol. 2, Boston: Kluwer Academic Publishers, pp. 69-113.
[15] Celeux, G. and Soromenho, G. (1996), An Entropy Criterion for Assessing the Number of Clusters in a Mixture Model, Journal of Classification, Vol. 13, No. 2, pp. 195-212. [16] Cutler, W. and Windham, M. P. (1994),
Information-Based Validity Functionals for Mixture Analysis. In H. Bozdogan (eds.), Proceedings of the First US/Japan Conference on the Frontiers of Statistical Modelling: An Informational Approach, pp. 149-170.
[17] Dempster, A. P., Laird, N. M. and Rubin, D. B. (1977), Maximum Likelihood from Incomplete Data via EM-Algorithm, Journal of the Royal Statistical Society: Series B (Statistical Methodology), Vol. 39, No. 1, pp. 1-38. [18] DeSarbo, W. S, Wedel, M., Vriens, M. and
Ramaswamy, V. (1992). Latent Class Metric Conjoint Analysis, Marketing Letters, Vol. 3, No. 3, pp. 273-288.
[19] DeSarbo, W. S. and Cron, W. L. (1988), A Maximum Likelihood Methodology for Clusterwise Linear Regression, Journal of Classification, Vol. 5, No. 1, pp. 249-282. [20] DeSarbo, W. S., Jedidi, K. and I. Sinha (2001),
Customer Value Analysis in a Heterogeneous Market, Strategic Management Journal, Vol. 22, No. 9, pp. 845-857.
[21] DeSarbo, W., Ansari, A., Chintagunta, P., Himmelberg, C., Jedidi, K., Johnson, R., Kamakura, P. Lenk, K. Srinivasan, K. and
Wedel, M. (1997), Representing Heterogeneity in Consumer Response Models 1996 Choice Conference Participants, Marketing Letters, Vol. 8, No. 3, pp. 335-348.
[22] Dias, J. G. (2004), Finite Mixture Models. Review, Applications, and Computer-intensive Methods. Research School Systems, Organization and Management, Doctoral Dissertation, Groningen University.
[23] Dillon, B. and Mukherjee, S. (2005), A guide to the design and execution of segmentation studies, in Grover, R. and Vriens, M. (Eds), The Handbook of Marketing Research, Sage Publications, Thousand Oaks, CA, pp. 523-45. [24] Dillon, B. And Mukherjee, S. (2005). A guide to
the design and execution of segmentation studies. In Grover, R. And Vriens, M. (Eds.). The Handbook of Marketing Reserach, Sage Publications, Thousand Oaks, CA, pp. 523-45. [25] Goller, S., Hogg, A. and Kalafatis, S. (2002), A
new research agenda for business segmentation, European Journal of Marketing, Vol. 36 No. 1/2, pp. 252-71.
[26] Hannan, E. J. and B. G. Quinn (1979), The Determination of the Order of an Autoregression, Journal of the Royal Statistical Society: Series B (Statistical Methodology), Vol. 41, No. 2, pp. 190-195.
[27] Hawkins, D.S., Allen, D. and Stromberg, A. J. (2001), Determining the number of components in mixtures of linear models, Computational Statistics and Data Analysis, Vol. 38, No. 1, pp. 15-48.
[28] Helsen, K., Jedidi, K. and DeSarbo, W. S. (1993), A New Approach to Country Segmentation Utilizing Multinational Diffusion Patters, Journal of Marketing, Vol. 57, No. 4, pp. 60-71.
[29] Hurvich, C. M. and Tsai, C. L. (1989), Regression and Time Series Model Selection in Small Samples, Biometrika, Vol. 76, No. 2, pp. 297-307.
[30] Hurvich, C. M. and Tsai, C. L. (1995), Model Selection for Extended Quasi-Likelihood Models in Small Samples, Biometrics, Vol. 51, No. 3, pp. 1077-1084.
[31] Jedidi, K., Ramaswamy, V., DeSarbo, W. S. and Wedel, M. (1996), The Disaggregate Estimation
of Simultaneous Equation Models: an Application to the Price-Quality Relationship, Journal of Structural Equation Modelling, Vol. 3, No. 3, pp. 266-289.
[32] Kim, T. And Lee, H-Y (2011). External validity of market segmentation methods. A study of buyers of prestige cosmetic brands. European Journal of Marketing, Vol. 45, No. 1/2, pp. 153-169.
[33] Kim, T. and Lee, H-Y (2011). External validity of market segmentation methods. A study of buyers of prestige cosmetic brands. European Journal of Marketing, Vol. 45, No. 1/2, pp. 153-169.
[34] Liang, Z., Jaszczak, R. J. and Coleman, R. E. (1992), Parameter Estimation of Finite Mixture Models Using the EM Algorithm and Information Criteria with Applications to Medical Image Processing, IEEE Transactions on Nuclear Science, Vol. 39, No. 4, pp. 1126-1133.
[35] Magidson, J. and Vermunt, J. K. (2002). Latent class models for clustering: a comparison with K-means. Canadian Journal of Marketing Research, 20, pp. 37-44.
[36] Andrews, R. L., Brusco, M., Currim, I. S. and Davis, B. (2010). An Empirical Comparison of Methods for Clustering Problems: Are There Benefits from Having a Statistical Model? Review of Marketing Science, Vol. 8 No. 3, pp. 1-32
[37] Rissanen, J. (1986). Stochastic Complexity and Modeling, The Annals of Statistics, Vol.14, No. 3, pp. 1080-1100.
[38] Rissanen, J. (1987), Stochastic Complexity, Journal of the Royal Statistical Society: Series B (Statistical Methodology), Vol. 49, No. 3, pp. 223-239.
[39] Rivera, F. F., Zapata, E. L. and Carazo, J. M. (1990). Cluster Validity Based on the Hard Tendency of the Fuzzy Classification, Pattern Recognition Letters, Vol. 11, No. 1, pp. 7-12.
[40] Roubens, M. (1978). Pattern Classification Problems and Fuzzy Sets, Fuzzy Sets and Systems, Vol. 1, No. 4, pp. 239-253.
[41] Sarstedt, M. (2008). Market Segmentation with Mixture Regression Models: Understanding Measures that Guide Model Selection. Journal of Targeting, Measurement and Analysis for Marketing, Vol. 16, No. 3, pp. 228-246. [42] Schwarz, G. (1978). Estimating the Dimension
of a Model, The Annals of Statistics. Vol. 6, No. 2, pp. 461-464.
[43] Vriens, M., Wedel, M. and Wilms, T. (1996). Metric Conjoint Segmentation Methods: A Monte Carlo Comparison, Journal of Marketing Research, Vol. 33, No. 1, pp. 73-85.
[44] Wedel, M. and DeSarbo, W. S. (1994). A Review of Recent Developments in Latent Class Regression Models. In R. P. Bagozzi (eds.), Advanced Methods of Marketing Research, Blackwell, pp. 352-388.
[45] Wedel, M. and Kamakura, W. A. (2000). Market Segmentation: Conceptual and Methodological Foundations, Kluwer Academic Publishers.
[46] Wedel, M. and W. S. DeSarbo (1995). A Mixture Likelihood Approach for Generalized Linear Models, Journal of Classification, Vol. 12, No. 1, pp. 21-55.
[47] Windham, M. P. and Cutler, A. (1992). Information Ratios for Validating Mixture Analysis, Journal of the American Statistical Association, Vol. 87, pp. 1188-1192.
[48] Wittink, D. R. and Cattin, D. (1981). Alternative Estimation Methods for Conjoint Analysis: a Monte Carlo Study, Journal of Marketing Research, Vol. 18, No. 1, pp. 101-106.
[49] Yang, C-C and Yang, C-C (2007). Separating Latent Classes by Information Criteria. Journal of Classification, Vol. 24, pp. 183-203.