Beginning in the 1970’s, several countries around the world began to defend a policy which stated that the primary objec-tive of surface water assessments should be to understand their ecological condition. This policy was based on the idea that water quality should not be measured only through its physical-chemi-cal attributes, but also through measurements that indicate the effects that non-natural disturbances have over the biological structure and ecosystem function of aquatic systems.
The ecosystems under study should have the appropri-ate conditions to maintain their aquatic populations. There-fore the aquatic biota is the fundamental objective of biological assessments (BARBOURet al. 1999). In general, biological assess-ments are based on the comparison of attributes (composition, structure, function and richness/diversity) of the biological communities found in healthy rivers, also known as reference or minimally impaired rivers, with those present in impaired rivers (CHESSMANet al. 2006).
The tools most commonly used for biological monitor-ing programs are Indexes of Biotic Integrity (or Multimetric Indexes) and Predictive Models. Both approaches use biologi-cal assemblages of diverse taxonomic groups. The most
fre-quently used groups are macroinvertebrates, fish and algae (GRIFFITHet al. 2005). The logic behind the indexes is to use a set of reaches from reference rivers as a pattern, in order to compare their ecological condition. When the difference be-tween the reference communities and the communities being assessed is high, the ecological condition of the sites under evaluation is considered impaired. KARR & DUDLEY (1981) argue that biotic integrity represents “The ability to support and maintain a balanced, integrated adaptive assemblage of organ-isms having species composition, diversity, and functional or-ganization comparable of that of natural habitat of the region”. Several developed countries, such as United States of America, Canada, Australia and New Zealand have invested on the development of models and biological indicators (PLAFKIN
et al. 1989, WRIGHT 1995, REYNOLDSONet al. 1995, BARBOURet al.
1996, 1999, BONADAet al. 2006). Likewise, the European Union (EUROPEAN COMMISSION 2000) pioneered two projects: AQEM and STAR, meant to develop multimetric indexes based on benthic macroinvertebrate fauna (BUFFAGNIet al. 2004, BÖHMERet al. 2004, HERINGet al. 2004, PINTOet al. 2004, VLEKet al. 2004, FURSEet al.
2006).
Multimetric index for assessing ecological condition of running waters in the
upper reaches of the Piabanha-Paquequer-Preto Basin, Rio de Janeiro, Brazil
Darcilio F. Baptista; Roberta S. G. de Souza; Carla A. Vieira; Riccardo Mugnai;
Ana S. Souza & Renata Bley S. de Oliveira
Laboratório de Avaliação e Promoção da Saúde Ambiental, Instituto Oswaldo Cruz. Avenida Brasil 4365, Manguinhos, 21045-900 Rio de Janeiro, RJ, Brazil. E-mail: [email protected]
ABSTRACT.The objective of this study was to develop a rapid multimetric index using benthic macrofauna as bioindicators of ecological conditions for the upper reaches of the Piabanha-Paquequer-Preto Basin located in the state of Rio de Janeiro, Brazil. A total of 33698 macroinvertebrates were collected in 27 sites. Benthic macroinvertebrates were sampled using the multi-habitat method that consists in sampling 20 m2 of substrate collected in approximate proportion to the
representation of all major habitat types in the reach. A subsampling procedure was used. The main steps followed to develop and test the index were: exclusion of unsuitable metrics using box-whisker plots, considering the degree of overlapping among interquartile limits (1°-3°) and confirmed by Mann-Whitney U test (p ⭐ 0.05) using six reference
rivers and six impaired rivers. From all the candidate potential metrics, 36 were considered suitable. After identifying redundant metrics, through Spearman correlation analysis, and considering practical application criteria, six core metrics were selected to compose the Piabanha-Paquequer-Preto Multimetric Index (PPPMI) using the continuous method: Family richness, Shannon-Wiener family diversity, EPT family richness, %Diptera, %MOLD (Mollusca + Diptera) and %Collectors. The sensitivity of the index was tested in 15 rivers using a Principal Components Analysis (PCA) of the six environmental variables. The first axis of the PCA was highly correlated to the PPPMI scores (r = 0.703, p < 0.001). The PPPMI responded to a set of environmental variables associated to a gradient of human disturbance affecting the ecological condition of the waterbodies. This indicates that the PPPMI is an effective tool for biological monitoring and decision making in the hydrographic region of the Piabanha-Paquequer-Preto rivers.
In the last two decades, multimetric indexes built to as-sess the impact of anthropogenic disturbances on fauna have used different spatial scales to estimate specific or multiple impacts. In the USA, many studies found an important rela-tionship between macroinvertebrate fauna and macro scale environmental conditions (ecoregions) (BARBOURet al. 1996, KARR & CHU 1997, WAITEet al. 2000, MYKRÄet al. 2004, FRIMPONGet al.
2005, MUNNet al. 2009). MCCORMICKet al. (2001) created one index for multiple ecoregions. Other studies suggest, however, that it might be necessary to create different indexes of biotic integrity for bioregions located within a single ecoregion (FORE
et al. 1994, MAXTEDet al. 2000). The review of the first national assessment of stream ecosystems in the USA presented by PAULSEN et al. (2008) indicates that it is feasable to use multimetric indexes in large scale monitoring programs in or-der to assess the ecological condition of rivers.
In Brazil, monitoring programs of aquatic ecosystems carried out by public authorities usually are restricted to physi-cal-chemical analyses of water (BRAGAet al. 2002). These evalu-ations might be unsuitable since they most likely do not assess the ecological condition of surface waters. However, some Bra-zilian research institutions have recently developed biological monitoring tools in response to the extreme impairment of aquatic ecosystems in Brazil. Most of these initiatives have used benthic macroinvertebrates (JUNQUEIRA & CAMPOS 1998, JUNQUEIRA
et al. 2000, BAPTISTAet al. 2007, MUGNAIet al. 2008, MONTEIROet
al. 2008, MORENOet al. 2009).
In all regions of the Atlantic Rain Forest, aquatic ecosys-tems have suffered severe man-induced stress and are threat-ened by pollution and loss of riparian vegetation. This generates physical disturbances that directly impact the ecological con-dition of the aquatic ecosystems. The objective of this work was to develop a rapid index of biotic condition using the macroinvertebrate fauna for small and mid-sized rivers from the Piabanha-Paquequer-Preto hydrographic region following the methodologies used in Europe (HERINGet al. 2006) and the USA (STODDARDet al. 2008).
MATERIAL AND METHODS
Study area
The region drained by the Piabanha, Paquequer and Preto rivers covers an area of 2075 km2. Its population is estimated to
be 590,000. The vegetation of the region is Atlantic Rain Forest. Its headwaters are located in the Serra dos Órgãos region, within the central portion of the Serra do Mar in the state of Rio de Janeiro. The region supplies water to 10 municipalities (Areal, Carmo, Paraíba do Sul, Paty do Alferes, Petrópolis, São José do Vale do Rio Preto, Sapucaia, Sumidouro, Três Rios and Teresópolis). The headwater streams are usually in steep slopes and include wadeable riffles and pools. The substrate size ranges from silt to large boulders. The lower reaches of the rivers, close to the Paraíba do Sul river, are non-wadeable.
The most preserved forested areas are located in the high mountainous zone of the basin. Within the valleys, in the mid-sized reaches located at altitudes below 850 m a.s.l, the land is used for agriculture and urban development, which increases water pollution caused by sewage discharge, riparian vegeta-tion loss, physical habitat modificavegeta-tion and nonpoint source pollution caused by use of pesticides and fertilizers (MOREIRAet al. 2002). The region includes several conservation units (Serra dos Órgãos National Park, Três Picos State Park, Araras Biologi-cal Reserve) that supply water to this hydrographic region (BERGALLOet al. 2009).
Study sites and sampling design
The benthic macrofauna was sampled during the dry sea-son (August 2007) in 27 sites from the Piabanha, Paquequer and Preto sub-basins (Fig. 1). This set of sites was selected ac-cording to three criteria: (i) minimally impaired areas (refer-ence; eight rivers); (ii) fair or slightly impaired areas (intermediate; 10 rivers) and (iii) severely impaired areas (nine rivers). Sites were located at 800-1100 m a.s.l as no reference sites were found in lower areas. The headwaters of the hydro-graphic region are located within the Serra dos Órgãos (SO). The SO region covers an area of approximately 12,904 km2,
with 200 km2 protected by the Serra dos Órgãos National Park
(22°26’58”S, 42°59’08”W). The climate is tropical super humid, with an annual average temperature of 18°C and annual pre-cipitation between 1250 and 1500 mm. To characterize the stream-typology used in this study, the criteria adopted include catchment area between 10-100 km2 and granite geology.
An a priori classification of river conditions was carried out using an Index of Habitat Integrity (IHI) (BARBOURet al. 1999). The percent of forested area upstream from the sampling loca-tions was calculated using a digital map of the watershed. For the river basin, a site was considered “minimally impaired” when it met all of the following criteria: water pH 6-8; dissolved oxy-gen ⭓ 4 mg/l; maximum urbanized basin area of 20% and ⭓
75% of forested upstream area; riparian vegetation width ⭓ 15
m; no visible channelization, and a Excellent or Very Good clas-sification according to the IHI (BARBOURet al. 1999). For the “im-paired” condition, any of the following a priori conditions should be met: deforestation of the upstream area ⭓ 75%, and a Poor
classification according to the IHI index.
Environmental and microbiological data
The following environmental variables were determined in the field, using a YSI550A analyzer: dissolved oxygen (DO), pH, electric conductivity. Other physical-chemical water vari-ables were measured with a HATCH SR 2500 analyzer: total ammonia, nitrate, nitrite, chlorides, and total alkalinity. Water samples were preserved in sterile plastic bags (whirl-pak) and the analyses conducted through the Colibert-Hach method in order to measure fecal and total coliforms. The percentage of sand in the reach under study was based on the number of samples (m2) that contained sand out of the total sampled
Figure 1. Map of Brazil and the study site in state of Rio de Janeiro. Light grey areas indicate limits of the Piabanha-Paquequer-Preto rivers watershed. White solid points indicate the macroinvertebrate assemblage sampling sites. Reference areas (white squares), im-paired areas (circles) and intermediate areas (diamonds). Municipality (black squares).
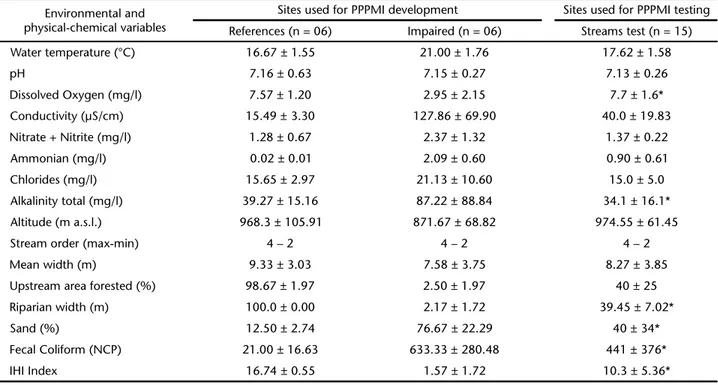
Table I. Environmental and physical-chemical variables measured at sites in the Serra dos Órgãos region,Rio de Janeiro, Brazil (Median, SD). * Indicates variables used during the analysis of the environmental PCA for the sensibility test of the Piabanha-Paquequer-Preto Multimetric Index (PPPMI). All sites (reference, impaired and test) have the same stream typology: size classes (based on catchment area-10 -area-100 km2), geology of the catchment area constituted of granite and altitude between 700-1200 m a.s.l.
Environmental and physical-chemical variables
Sites used for PPPMI development Sites used for PPPMI testing
References (n = 06) Impaired (n = 06) Streams test (n = 15)
Water temperature (°C) 16.67 ± 1.55 21.00 ± 1.76 17.62 ± 1.58
pH 7.16 ± 0.63 7.15 ± 0.27 7.13 ± 0.26
Dissolved Oxygen (mg/l) 7.57 ± 1.20 2.95 ± 2.15 7.7 ± 1.6*
Conductivity (µS/cm) 15.49 ± 3.30 127.86 ± 69.90 40.0 ± 19.83
Nitrate + Nitrite (mg/l) 1.28 ± 0.67 2.37 ± 1.32 1.37 ± 0.22
Ammonian (mg/l) 0.02 ± 0.01 2.09 ± 0.60 0.90 ± 0.61
Chlorides (mg/l) 15.65 ± 2.97 21.13 ± 10.60 15.0 ± 5.0
Alkalinity total (mg/l) 39.27 ± 15.16 87.22 ± 88.84 34.1 ± 16.1*
Altitude (m a.s.l.) 968.3 ± 105.91 871.67 ± 68.82 974.55 ± 61.45
Stream order (max-min) 4 – 2 4 – 2 4 – 2
Mean width (m) 9.33 ± 3.03 7.58 ± 3.75 8.27 ± 3.85
Upstream area forested (%) 98.67 ± 1.97 2.50 ± 1.97 40 ± 25
Riparian width (m) 100.0 ± 0.00 2.17 ± 1.72 39.45 ± 7.02*
Sand (%) 12.50 ± 2.74 76.67 ± 22.29 40 ± 34*
Fecal Coliform (NCP) 21.00 ± 16.63 633.33 ± 280.48 441 ± 376*
Sampling, sorting and identification of organisms
Benthic fauna was sampled using a kick-net sampler (30 x 30 cm), with 500-micron mesh netting. Samples were ob-tained from a reach length of approximately 20 times the chan-nel width. The multi-habitat approach was used for sampling, where the substrates were sampled in an approximate propor-tion to the representapropor-tion of all major habitat types within the reach. In each reach, 20 substrate samples were taken and com-bined into one composite sample. Each sample represented 1 m2 of substrate(HERINGet al. 2003).The samples were preserved in 80% ethanol and then sorted in the laboratory. After removal of coarse material, the remaining composite sample was mixed together and sub-sampled in a tray sub-divided in 24 units (10 x 10 cm), from which six units were randomly selected to compose a single sub-sample. The effectiveness of the sub-sampling process had been previously tested (OLIVEIRAet al. 2011). The sub-sample was then sorted to remove all benthic macroinvertebrates, which were identified to genus level except for those only iden-tified to family level, namely Diptera, Lepidoptera and Hemi-ptera. Other non-insect groups were identified to higher taxonomic levels. The specimens collected and identified were stored in the Laboratório de Avaliação e Promoção da Saúde Ambiental/FIOCRUZ.
Data analysis
The individual metrics must reflect the stress caused by specific impacts and the addition of all metrics composing the index should respond to cumulative disturbance (KARR & CHU 1999). SUTER (1993) addresses a risk of biological information loss when using a multimetric method without doing a robust evaluation, calibration and statistical analysis. Accordingly, data was analyzed in three stages: (a) selection of the core metrics to compose the index; (b) building of the multimetric index and (c) test of the index.
Selection of core metrics
Twelve sites (six reference and six impaired sites) were used to select the core metrics for the multimetric index, where the following Richness and Diversity metrics were calculated: Total Richness; Dominance (D); Shannon Diversity (H); Simpson Diversity (1-D); Evenness (e^H/S); Menhinick Index; Margalef Index; Equitability (J Index); Fisher Alpha Index; Berger-Parker Index; Family Richness; Plecoptera Family ness; Ephemeroptera Family Richness; Trichoptera Family Rich-ness; EPT Family RichRich-ness; Shannon-Wiener Family Diversity; Margalef Family Diversity; Simpson Family Diversity; Plecoptera Genera Richness; Ephemeroptera Genera Richness; Trichoptera Genera Richness; EPT Genera Richness.
Likewise, the following Composition metrics (%Co-leoptera; %Ephemeroptera; %Plecoptera; %Diptera; %Trichop-tera; %Odonata; %EPT), Tolerance metrics (MOLD – Molusca + Diptera – richness; %MOLD; BMWP-CETEC; BMWP-ASPT; IBE-IOC; proportion Baetidae/Ephemeroptera; Hydropsychidae/
Trichoptera; %Chironomidae), and Trophic metrics (%Scraper – periphyton consumers; %Shredder – leaf consumers; %Col-lector – feed on suspense and deposited fine particulate organic matter; %Predator; %Filterer – feed on drifting fine particulate organic matter – were also calculated.
The selection of core metrics for the multimetric index (MI) was conducted in four steps: 1) analyses of metrics that discriminate between “reference” sites and impaired sites was achieved using box-whisker plots, considering the degree of overlap among interquartile limits (1°-3°) along with the di-rection and intensity of the response as the impact increased; 2) statistical significance of metric values differences between reference and impaired sites using a Mann-Whitney U test (those metrics with p values ⭐ 0.05 were considered suitable.
This test was used to confirm the sensitivity of metrics to im-pairment); 3) identification of redundancy among suitable metrics using a Spearman correlation analysis; 4) selection of metrics considering key operational criteria to employ the in-dex, e.g. coarse taxonomic resolution level required to apply the metric.
Multimetric Index construction and validation
The Continuous Scoring Method suggested by FREY (1977) was used to score or standardize the metrics values. BLOCKSOM (2003) recommended it as the best option because it increases the sensitivity and stability of the resulting index. This method was originally used by MINNSet al. (1994) in the littoral zone of the Great Lakes. GANASAN & HUGHES (1998) and KLEMMet al. (2003) used it in stream ecosystems. The scoring method uses the dis-tribution of values from each set of reference or impaired riv-ers. The following descriptors were used: minimum and maximum values, and first and third quartile. The scoring pro-cedure is completed using these distribution metrics and two formulae (see below), to determine whether metric values in-crease or dein-crease when degradation inin-creases.The procedure used to apply the index was achieved in five steps: 1) computing all six core metrics; 2) scoring the metrics using the formula (a) for metrics that decrease with increasing impairment and formula (b) for metrics that increase with increasing impairment; 3) applying a simple interpola-tion to adjust values to a range between 0-10 (negative values must be considered zero and the highest value must be consid-ered 10); 4) multiplying the values of each one of the metrics times 1.6 (individual weights) in order to obtain values rang-ing from 0 to 100; 5) in this last step the values of each metric are summed to obtain a final score for the Piabanha-Paquequer-Preto Multimetric Index (PPPMI). This final PPPMI value that results from the application of the index in each test site falls into one of five quality categories, indicating the ecological integrity of the assessed location.
Formule (a)
(
)
(
)
Standardized metric Metric result percentile of impaired sites
percentile of reference sites percentile of impaired sites
th
th th
= −
−
× 25
Formule (b)
(
)
(
)
Standardized metric Metric result percentile of impaired sites
percentile of reference sites percentile of impaired sites
th
th th
=
=
− ×
75
25 75 10
The formulas above follow the continuous scoring method to score metrics, using distribution values from metrics in reference and impaired sites. The procedures are different for metrics with values that increase or decrease as degrada-tion increases (KLEMMet al. 2003).
Test of the index
A validation test of the PPPMI sensitivity was conducted in 15 sites located in the upper reaches of the Piabanha-Paquequer-Preto basin, judged to be representative of the degra-dation gradient. These sites were not used to build the index. The test was performed using a Principal Component Analysis (PCA) of environmental variables (%DO, conductivity, total al-kalinity, width of riparian area, fecal coliforms, IHI index). The data matrix was standardized by applying (xi-x)/, where x
i is
the observed value, x is the mean and is the standard
devia-tion. The assessment of the index was done using a Pearson cor-relation between the scores of sites in PCA axis 1 and the PPPMI scores. Analyses were done using BioEstat 2.0 (AYRESet al. 2000).
RESULTS
Benthic fauna
Ninety one benthic macroinvertebrate Operational Taxo-nomic Units (OTU) were found in the rivers from the Piabanha-Paquequer-Preto hydrographic region. The highest OTU richness belonged to the group of aquatic insects, with nine insect orders composed of 49 families and 43 identified genera (some taxa were only identified to family level) (Appendix).
Of the 42 metrics evaluated in this study, 36 were consid-ered sensitive to differences between the reference and the
im-paired areas. There was no overlap among the Box-and-Whisker plots interquartile limits (1°-3°) of these metrics (Fig. 2), which was confirmed by the Mann-Whitney U-test. The six metrics considered unsuitable were: %Odonata, MOLD (Mollusca + Diptera) richness, Baetidae/Ephemeroptera, Hydropsychidae/ Trichoptera, Chironomidae abundance and equitability. The next stage was to test metrics redundancy.
Eight pairs of metrics that were significantly correlated (Spearman correlation, r > 0.75, p < 0.05) were considered re-dundant. All were chosen giving priority to those metrics that facilitate the final application of the index. Of the six metrics that compose the PPPMI (Family Richness, Family Shannon-Wiener Diversity, EPT Family Richness, %Diptera, %MOLD – Mollusca + Diptera and %Collectors), three describe assemblage structure, two describe tolerance and one describes function. For each metric, upper and lower thresholds were set using reference and impaired sites distribution values (Tab. II). The scaling for the different classifications of ecological condition that resulted from the scoring process was divided in five classes of environmental stream quality: Severely Impaired (values ranging from 0-20), Impaired (20-40), Fair (40-60), Good (60-80) and Excellent (80-100).
Validation Test of the PPPMI
The first PCA axis was highly correlated with PPPMI scores (r = 0.703, p < 0.001) indicating a significant response to a gradient disturbance (Fig. 3).
DISCUSSION
This study aims to serve as an example for the develop-ment of multimetric indices for other watersheds and to help the managers of the Serra do Mar region to assess regional im-pacts and disturbances within first to fifth Strahler order
wade-Table III. Expected responses with increased impairment and metric value thresholds for the six metrics selected to integrate the Piabanha-Paquequer-Preto Multimetric Index.
PPPMI metrics Expected response with impairment Metrics values of upper and lower limits
Family Richness Decrease (Upper) 75% – ref. = 29
(Lower) 25% – impaired = 3
Family Shannon-wiener Diversity Decrease (Upper) 75% – ref. = 2.2
(Lower) 25% – impaired = 0.2
EPT Family Richness Decrease (Upper) 75% – ref. = 12
(Lower) 25% – impaired = 0
Percentage of Diptera Increase (Upper) 25% – ref. = 26.3
(Lower) 75% – impaired = 96.5
Percentage of MOLD (Mollusca + Diptera) Increase (Upper) 25% – ref. = 11.8
(Lower) 75% – impaired = 96.0
Percentage of Collectors Increase (Upper) 25% – ref. = 20.0
able streams, using specific regional features. This paper rein-forces the idea that multimetric indices can be built at a water-shed scale (KING & RICHARDSON 2003).
In this study, twenty seven sites were sampled, which is a representative number of sites for rivers that belong to a ty-pology defined by having a catchment area between 10-100 km2, granite geology and altitude ranging between 700-1200
m a.s.l,, within the Paquequer, Piabanha and Preto Basin. In the European Union, multimetric indexes in smaller scales were built considering the concept of river typology which usually involves a smaller number of sites. In the 30 river typologies studied in the European Union, the mean sample size used was 15.23 sites (HERINGet al. 2003).
The core metrics of the PPPMI respond to different im-pacts. In general, the metrics that decrease with impact, for example, diversity indexes do not require adaptation to differ-ent geographical areas (BRADLEY 2008). So, the inclusion of the EPT richness and the Shannon-Wiener Index metrics in the PPPMI was considered useful given its feasibility and also be-cause these are good measures that respond to structural changes and a clear response to the impaired gradient in the macroinvertebrate assemblages (SURIANOet al. 2011).
The other metric that decreases with impact (EPT – Ephemeroptera + Plecoptera + Trichoptera – Richness to family level) includes the Ephemeroptera and Plecoptera, which are sensitive to low oxygen levels and substrate changes (GERHARDT
et al. 2004). This metric also includes the Trichoptera, which include some groups that are tolerant of heavy metals and low oxygen levels (BRADLEY 2008). ARIASet al. (2007) also found some sites, in the study area, which are impaired due to habitat loss and high pesticide contamination, where some genera of Trichoptera (Nectopsyche Mueller, 1879) and Ephemeroptera (Americabaetis Kluge, 1992) were tolerant to these impacts. How-ever, even though studies show that some groups of EPT are tolerant, it is worth using the EPT richness to family level, once it aggregates more sensitive groups than tolerant ones and also because the family identification level used is easily achieved when compared to species and genus level. In addition, other studies showed that the number of EPT families decreased at sites with increasing impact due to disturbance (agricultural, pastures, and urban sites), possibly because of a higher nutrient concentrations (SANDIN & JOHNSON 2000, HEPP & SANTOS 2009).
The metrics which increase with impact (%Diptera, %MOLD – Mollusca + Diptera, %Colletor), respond positively to conditions associated to organic pollution caused by un-treated wastewater effluents in urban areas and to the increase of suspended organic particles in rural areas. The metric %Diptera was one of the best indicators of organic pollution in this study area (BAPTISTAet al. 2007). HEPP & SANTOS (2009) also found that %Diptera tended to increase when degrada-tion increased, while richness, diversity, evenness, and EPT fami-lies decreased with the impact of degradation. The metric %Collector was useful to discriminate multiple impacts and 10
20 30
40 p < 0.005
Family
richness
0
Reference impaired Reference impaired
Family
Shannon
Wiener
Divers
ity p < 0.005
p < 0.005
p < 0.005
Reference impaired
Reference impaired Reference impaired
Reference impaired
p < 0.008 p < 0.005
%
Diptera
%
Collections
%
MOLD
EPT
family
richness
100
80
60
40
20
0 20
16
12
8
4
0
0 20 40 60 80 100 0 20 40 60 80 100 1 2 3
Figure 2. Comparison of distributions of each metric composing the PPPMI index. In the Box-&-Whisker plots, center lines repre-sent the median, boxes reprerepre-sent the first and third quartiles, and bars represent the maximum and minimum. P-values were ob-tained using Mann-Whitney U tests.
-4 -3 -2 -1 0 1 2 3 4 20
30 40 50 60 70 80
PPPMI
scores
PCA Axis 1
r = 0.7029*
organic pollution in other rivers within the Serra dos Órgãos, southeastern Brazil (SILVEIRAet al. 2005, BAPTISTAet al. 2007, BUSS & SALES 2007). The core metric %MOLD was chosen as the num-ber of Diptera and Mollusca individuals tend to increase in the assemblages in response to impacts such as increased fine sedi-ments and high organic pollution. This phenomenon has been shown to occur in several regions in Brazil (GIOVANELLIet al.
2005, HEPP & SANTOS 2009).
Diversity and richness metrics of the PPPMI required iden-tification of specimens only to family level. Metrics at the ge-nus level were found to be valid and sensitive. However, they were not chosen due to the limited taxonomic knowledge and additional work to make identifications. Of the metrics used, only %Collector requires some taxa to be identified to genus level, particularly Trichoptera. Even so, at higher levels of taxo-nomic identification, the PPPMI responded appropriately to generalized measurements of disturbance, representing a wide variety of combined stressors, being a suitable and efficient tool to detect environmental impacts.
The good index performance reinforces its potential use to assess ecological quality of water in river reaches. Future studies will indicate if the index can be applied in sites located at altitudes lower than 800 m (a.s.l) belonging to the same ty-pology for which it was developed
ACKNOWLEDGMENTS
The authors thank their colleagues of the LAPSA/IOC/ FIOCRUZ for their help during the study, and Valdiney Valin and Priscilla S. Pereira for water analysis. This study was sup-ported by financial grants from CNPq (Edital Universal/2006 – 475359/2006-2 and CNPq/PAPES V – 403496/2008-0); PROEP/ CNPq/Fiocruz.
LITERATURE CITED
ARIAS, R.L.A.; D.F. BUSS; C. ALBURQUERQUE; A.F. INÁCIO; M.M. FREIRE; M. EGLER; R. MUGNAI & D.F. BAPTISTA. 2007. Utilização de bioindicadores na avaliação de impacto e no monitoramento da contaminação de rios e córregos por agrotóxicos. Ciên-cia & Saúde Coletiva 12 (1): 61-72.
AYRES, M.; M. AYRES JR; D.L. AYRES & A.S. SANTOS. 2000. BioEstat 2.0: aplicações estatísticas nas áreas das ciências biológi-cas e médibiológi-cas. Belém, Sociedade Civil Mamirauá, 272p. BAPTISTA, D.F.; D.F BUSS; M. EGLER; A. GIOVANELLI; M.P. SILVEIRA &
J.L. NESSIMIAN. 2007. A multimetric index based on benthic macroinvertebrates for evaluation of Atlantic Forest stream at Rio de Janeiro State, Brazil. Hydrobiologia575: 83-94. BARBOUR, M.T.; J. GERRITSEN; G.E. GRIFFITH; R. FRYDENBORG; E.
MCCARRON; J.S. WHITE & M.L. BASTIAN. 1996. A framework for biological criteria for Florida streams using benthic macro-invertebrates. Journal of the North American Benthological Society15: 185-211.
BARBOUR, M.T.; J. GERRITSEN; B.D. SNYDER & J.B. STRIBLING. 1999.
Rapid Bioassessment Protocols for use in streams and wadeable rivers: Periphyton, Benthic Macroinvertebrates and Fish. Washington, D.C., U.S. Environmental Protection Agency, Office of Water, EPA 841-B-99-002, 2nd ed.
BRADLEY, H.A. 2008. Sediment chemistry and benthic macro-invertebrate communities within an acid mine drainage impacted stream Earth & Environment 3: 1-31.
BRAGA, B.; M. PORTO & C.E.M. TUCCI. 2002. Monitoramento de Quantidade e Qualidade das Águas, p. 635-649. In: A.C. REBOUÇAS; B. BRAGA & J.G.TUNDISI (Eds). Águas Doces no
Bra-sil: Capital Ecológico, Uso e Conservação. São Paulo, Ed. Escrituras, 703p.
BERGALLO H.G.; E.C.C. FIDALGO; C.F.D. ROCHA; M.C. UZÊDA; M.B. COSTA; M.A.S. ALVES; M. VAN SLUYS; M.A. SANTOS; T.C.C. COSTA & A.C.R. COZZOLINO. 2009. Estratégias e ações para a
con-servação da biodivcersidade no Estado do Rio de Janei-ro. Rio de Janeiro, Instituto Biomas, 344p.
BLOCKSOM, K.A. 2003. A performance comparison of metric scoring methods for a multimetric index for Mid-Atlantic highlands streams. Environmental Management 31 (5): 670-682. BOHMER, J.; C. RAWER-JOST & A. ZENKER. 2004. Multimetric assessment
of data provided by water managers from Germany: assessment of several different types of stressors with macrozoobenthos communities. Hydrobiologia516: 215-228.
BONADA, N.; N. PRAT; V.H. RESH & B. STATZNER. 2006. Developments in aquatic insect biomonitoring: a comparative analysis of recent approaches. Annual Review Entomolology 51: 495-523.
BUFFAGNI, A.; S. ERBA,; M. CAZZOLA & L.L. KEMP. 2004. The AQEM multimetric system for the southern Italian Alpennines: assessing the impact of water quality & habitat degradation on pool macroinvertebrates in Mediterranean rivers.
Hydrobiologia516: 313-329.
BUSS, D.F. & F.F. SALLES. 2007. Using Baetidae species as biological indicators of environmental degradation in a Brazilian River Basin. Environmental Monitoring and Assessment 130: 365-372.
CHESSMAN, B.C.; L.A. THURTELL & M.J. ROYAL. 2006. Bioassessment in a harsh environment: a comparison of macroinvertebrate assemblages at reference and assessment sites in an Australian river system. Environmental Monitoring Assessment 119 (1-3): 303-330.
EUROPEAN COMMISSION. 2000. Directive 2000/60/EC of the European Parlament & Council, establishing a framework for Community action in the field of water policy. Official
Journal of the European Community327: 1-72.
FREY, D.G. 1977. Biological integrity of water – a historical approach, p. 127-140. In: R.K. BALLENTINE & L.J. GUARRIA (Eds).
The integrity of water. Washington, D.C., US Environmen-tal Protection Agency.
predictors of Stream Health. Environmental Management 36 (6): 899-917.
FORE L.S.; J.R. KARR & L.L. CONQUEST. 1994. Statistical properties of an index of biotic integrity used to evaluate water resources. Canadian Journal of Fisheries & Aquatic Sciences 51: 1077-1087.
FURSE, M.; D. HERING; K. BRABEC; A. BUFFAGNI; L. SANDIN & P. VERDONSCHOT. 2006. The STAR project: context, objectives and approaches. Hydrobiologia 566: 3-29.
GANASAN, V. & R.M. HUGHES. 1998. Application of an index of biological integrity (IBI) to fish assemblages of the rivers Khan and Kshipra (Madhya Pradesh), India. Freshwater Biology 40: 367-383.
GIOVANELLI, A.; C.L.P.A. C. SILVA; G.B.E. LEA & D.F. BAPTISTA. 2005. Habitat preference of freshwater snails in relation to environmental factors and the presence of the competitor snail Melanoides tuberculatus (Müller, 1774). Memórias do Instituto Oswaldo Cruz 100 (2): 169-176.
GERHARDT, A; J.L. BISTHOVEN & A.M.V.M. SOARES. 2004. Macroin-vertebrate response to acid mine drainage: community metrics and on-line behavioural toxicity bioassay.
Environmental Pollution 130: 263-274.
GRIFFITH, M.B.; B.H. HILL; F.H. MCCORMICK; P.R KAUFMANN; A.T. HERLIHY & A.R. SELLE. 2005. Comparative application of indices of biotic integrity based on peiphyton, macroinvertebrates and fish to southern Rocky Moutain streams. Ecological Indicators 5: 117-136.
HERING, D.; A. BUFFAGNI; O. MOOG; L. SANDIN; M. SOMMERHÄUSER; I. STUBAUER; C. FELD; R. JOHNSON; P. PINTO; N. SKOULIKIDIS; P. VERDONSCHO & S. ZAHRÁDKOVÁ. 2003. The development of a system to assess the ecological quality of streams based on macroinvertebrates – Design of the sampling programme within the AQEM Project. International Review of Hydrobiology 88 (3-4): 345-361.
HERING, D.; P.F.M. VERDONSCHOT; O. MOOG & L. SANDIN. 2004. Overview and application of the AQEM assessment system: Integrated Assassment of Running Waters in Europe.
Hydrobiologia 516: 1-20.
HERING, D.; O. MOOG; T. OFENBÖCK & C.K. FELD. 2006. Cook book for the development of a Multimetric Index for biological condition of aquatic ecosystems: experiences from the European AQEM and STAR projects and related initiatives.
Hydrobiologia 566: 311-324.
HEPP, L.U. & S. SANTOS. 2009. Benthic communities of streams related to different land uses in a hydrographic basin in southern Brazil. Environmental Monitoring Assessment 157: 305-318.
JUNQUEIRA, V.M. & S.C.M. CAMPOS. 1998. Adaptation of the “BMWP” method for water quality evaluation to Rio Das Velhas watershed (Minas Gerais Brazil). Acta Limnologica Brasiliensia 10 (2): 125-135.
JUNQUEIRA, V.M.; M.C. AMARANTE; C.F.S. DIAS & E.S. FRANÇA. 2000. Biomonitoramento da qualidade das águas da Bacia do A;to
Rio das Velhas (MG/Brasil) através de macroinvertebrados.
Acta Limnologica Brasiliensia 12: 73-87.
KARR, J.R. & D.R. DUDLEY. 1981. Ecological perspective on water quality goals. Environmental Management 5: 55-68. KARR, J.R. & E.W. CHU. 1997. Biological monitoring: Essential
foundations for ecological risk assessment. Human and Ecological Risk Assessment 3: 933-1004.
KARR, J. R & E.W. CHU. 1999. Restoring life in running waters: Better Biological Monitoring. Washington, D.C., Island Press, 206p.
KING, R.S. & C.J. RICHARDSON. 2003. Integrating bioassessment and ecological risk assessement: an approach to developing numerical water-quality criteria. Environmental Manage-ment 31 (6): 795-809.
KLENN, D.J.; K.A. BLOCKSOM; F.A. FULK; A.T. HERLIHY; R.M. HUGUES; P.R. KAUFMANN; D.V. PECK; J. L. STODDARD; W.T. THOENY; M.B. GRIFFTH & W.S. DAVIS. 2003. Development and evaluation of a macroinvertebrate biotic integrity index (MBI) for regionally assessing mid-atlantic highlands streams.
Environmental Management 31: 656-669.
MAXTED, J.R.; M.T. BARBOUR; J. GERRITSEN; V. PORETTI; N. PRIMROSE; A. SILVIA; D. PENROSE & R. RENFROW. 2000. Assessment framework for Mid-Atlantic coastal plain streams using benthic macro-invertebrates. Journal of the North American Benthological Society19: 128-144.
MCCORMICK, F.H.; R.H. HUGHES; P.R. KAUFMANN; D.V. PECK; J.L. STODDARD & A.T. HERLIHY. 2001. Development of an index of biotic integrity for the Mid-Atlantic Highlands Region. Transactions of the American of Fisheries Society 130: 857-877. MINNS, C.K.; V.W. CAIRNS; R.G. RANDALL & J.E. MOORE. 1994. An
Index of Biotic Integrity (IBI) for fish assemblages in littoral zone of Great Lakes areas of concern. Canadian Journal of Fisheries and Aquatic Sciences 51: 1804-1822.
MUNN, M.D.; R.I. WAITE; D.P. LARSEN & A.T. HERLIHY. 2009. The relative influence of geographic location and reach-scale habitat on benthic invertebrate assemblages in six ecoregions. Environmental Monitoring and Assessment 154 (1-4): 1-14.
MYKRÄ, H.; J. HEINO & T. MUOTKA. 2004. Variability of lotic macroinvertebrate assemblages and stream habitat characteristics across hierarchical landscape classifications.
Environmental Management 34 (3): 341-352
MORENO, P.; J.S. FRAÇA; W.R. FERREIRA; A.D. PAZ; M.I. MANTEIRO & M. CALLISTO. 2009. Use of the BEST model for biomonitoring water quality in neotropical basin. Hydrobiologia 630: 231-242. MUGNAI, R.; R.B. OLIVEIRA; A.L. CARVALHO & D.F. BAPTISTA. 2008
Adaptation of the Indice Biotico Esteso (IBE) for water quality assessment in rivers of Serra do Mar, Rio de Janeiro State, Brazil. Tropical Zoology 21: 57-74.
OLIVEIRA, R.B.S.; R. MUGNAI; C.M. CASTRO & D.F. BAPTISTA. 2011. Determining subsampling effort for the development of a rapid bioassessment protocol using benthic macroinvertebrates in streams of Southeastern Brazil. Environmental Monitoring Assessment 175: 75-85.
PINTO, P.; J. ROSADO; M. MORAIS & I. ANTUNES. 2004. Assessment methodology for southern siliceous basins in Portugal.
Hydrobiologia 516: 193-216.
PLAFKIN, J.L.; M.T BARBOUR; K.D. PORTER; S.K. GROSS & R.M. HUGHES. 1989. Rapid Bioassessment Protocols for use in Streams
and Rivers: Benthic Macroinvertebrates and Fish.
Wa-shington, D.C., U.S. Environmental Protection Agency, EPA-444/4-89-001.
PAULSEN, S.G.; A. MAYIO; D.V. PECK; J.L. STODDARD; E. TARQUINIO; S.M. HOLDSWORTH; J.V. SICKLE; L.I. YUAN; C.P. HAWKINS; A.T. HERLIHY; P.R. KAUFMANN; M.T. BARBOUR; D.P. LARSEN & A.R. OLSEN. 2008. Condition of stream ecosystems in the US: an overview of the first national assessment. Journal North American Benthological Society 27 (8): 812-821.
REYNOLDSON, T.B.; R.C. BAILEY; K.E. DAY & R.H. NORRIS. 1995. Biological guidelines for freshwater sediment based on Benthic Assessment of SedimenT (the BEAST) using a multivariate approach for predicting biological state.
Australian Journal of Ecology 20: 198-219.
SANDIN, L. & R.K. JOHNSON. 2000. The statistical power of selected indicator metrics using macroinvertebrates for assessing
acidification and eutrophication of running waters.
Hydrobiologia422: 233-243.
SILVEIRA, M.P.; D.F. BUSS; J.L. NESSIMIAN; M. EGLER & D.F. BAPTISTA. 2005. Application of biological measures for stream integrity assessment in south-east Brazil. Environmental Monitoring and Assessment 101: 117-128
STODDARD, J.L.; A.T. HERLIHY; D.V. PECK; R.M. HUGHES; T.R. WHITTIER & E. TARQUINIO. 2008. A process for creating multimetric indices for large-scale aquatic surveys. Journal of the North American Benthological Society 27: 878-891.
SURIANO, M.T.; A.A. FONSECA-GESSNER; F.O. ROQUE & C. G. FROEHLICH. 2011. Choice of macroinvertebrate metrics to evaluate stream conditions in Atlantic Forest, Brazil. Environmental Monitoring and Assessment 175: 87-101.
SUTER, G.W. 1993. A critique of ecosystem health concepts and indexes. Environmental Toxicology and Chemistry 12: 1533-1539.
VLEK, H.E.; P.F.M. VERDONSCHOT & R.C. NIJBOER. 2004. Toward a multimetric index for the assessment of Dutch streams using benthic macroinvertebrate. Hydrobiologia 516: 173-189. WAITE, I.R.; A.T. HERLIHY; D.P. LARSEN & D.L. KLEMM. 2000.
Comparing strengths of geographic and nongeographic classications of stream benthic macroinvertebrates in the Mid-Atlantic Highlands, USA. Journal of the North American Benthological Society 19: 429-441.
WRIGHT, J.F. 1995. Development and use of a system for predicting the macroinvertebrate fauna in flowing waters.
Australian Journal of Ecology 20: 181-197.
Submitted: 25.VIII.2010; Accepted: 04.V.2011. Editorial responsibility: Adriano S. Melo
Appendix. List of taxa collected in the Piabanha-Paquequer-Preto hydrographic region, state of Rio de Janeiro, Brazil, to compose the PPPMI.
Ephemeroptera Baetidae
Baetodes Needham & Murphi, 1924 Cloeodes Traver, 1938
Americabaetis Kluge, 1992 Euthyplociidae
Campylocia Needham & Murphi, 1924 Caenidae
Caenis Stephens, 1835 Leptohyphidae
Leptohyphes Eaton, 1882 Tricorhytodes Ulmer, 1920 Thricorythopsis Traver, 1958 Leptophlebiidae
Askola Peters, 1969
Farrodes Peters, 1971 Massartela Lestage, 1930
Hylister Dominguez & Flower, 1989 Miroculis Edmunds, 1963
Thraulodes Ulmer, 1920
Hermanella Needham & Murphy, 1924 Ulmeritoides Traver, 1959
Odonata Aeshnidae
Staurophlebia Brauer, 1865 Calopterygidae
Haeterina Hagen & Selys, 1853 Libellulidae
Erythrodiplax Brauer, 1868 Megapodagrionidae
Heteragrion Selys, 1862 Protoneuridae
Plecoptera
Gripopterygidae
Gripopteryx Pictet, 1841 Paragripopteyx Enderlei, 1909 Guaranyperla Froehlich, 2001 Perlidae
Anacroneuria Klapálek, 1909 Kempnyia Klapálek, 1916 Tupiperla Froehlich, 2001 Macrogynoplax Enderlei, 1909 Hemiptera
Helotrephidae (nd) Mesovellidae (nd) Naucoridae (nd) Notonectidae (nd) Pleidae (nd) Vellidae (nd) Megaloptera Corydalidae
Corydalus Lastreille, 1802 Trichoptera
Calamoceratidae
Phylloicus Müller, 1880 Hydrobiosidae
Atopsyche Banks, 1905 Helicopsychidae
Helicopsyche Siebold, 1856 Hydroptilidae
Ochrotrichia Mosely, 1934 Hydroptilidae (nd)
Hydropsychidae
Blepharopus Kolenati, 1859 Leptonema Guérin, 1843 Macronema Pictet, 1836 Smicridea McLachlan, 1871 Synoestropsis Ulmer, 1905 Leptoceridae
Grumichella Müller, 1879 Nectopsyche Müller, 1879 Triplectides Kolanati, 1859 Oecetis McLachlan, 1877 Odontoceridae
Barypenthus Burmeister, 1839 Marilia Müller, 1880 Polycentropodidae
Cyrnellus Banks, 1903
Sericostomatidae
Grumicha Mueller, 1879 Xiphocentronidae
Xiphocentron Brauer, 1870 Lepidoptera (nd)
Coleoptera
Dytiscidae (nd) Dryopidae (nd) Elmidae
Heterelmis Sharp, 1882 Hexacylloepus Hinton, 1940 Elmidae
Hexanchorus Sharp, 1882 Macrelmis Motschulsky, 1859 Microcylloepus Hinton, 1935 Neoelmis Musgrave, 1935 Phanocerus Sharp, 1882 Promoresia S&erson, 1954 Xenelmis Hinton, 1936 Hydrophilidae (nd) Lutrochidae (nd) Psephenidae (nd) Staphilinidae (nd) Diptera
Ceratopogonidae (nd) Chironomidae (nd) Culicidae (nd) Dixidae (nd) Ephydridae (nd) Empididae (nd) Psychodidae (nd) Simuliidae (nd) Stratiomyidae (nd) Syrphidae (nd) Tabanidae (nd) Tipulidae (nd) Crustacea
Decapoda (nd) Acarina (nd) Annelida
Hirudinea (nd) Oligochaeta (nd) Chelicerata(nd) Mollusca