Measurement of nitrogen content in rice by inversion of hyperspectral
reflectance data from an unmanned aerial vehicle
Medição do conteúdo de nitrogênio no arroz por inversão de dados de refletância hiperspectral de um veículo aéreo não tripulado
Du Wen1 Xu Tongyu1*,2 Yu Fenghua1,2 Chen Chunling1,2
ISSNe 1678-4596
INTRODUCTION
Nitrogen is the primary component of rice protein and chlorophyll, which is critical for crop growth and yield (LEE et al. (2008); WANG et al. (2011)). Liaoning province in northeast China is currently facing three issues with the application of nitrogen fertilizer. Fertilizer nitrogen levels per hectare are high, fertilization is not balanced, and the utilization
rate of nitrogen fertilizer is low. Excessive and unguided application of nitrogen fertilizer increases production costs, causes environmental pollution (WANG et al. (2014); DU et al. (2017)), and results in erratic and unstable stem growth (YU & XU, 2016). Conventional nitrogen content detection requires destructive sampling
in the field and subsequent laboratory testing, which cannot be conducted in real time. More efficient
methods for the detection of nitrogen content in rice are
1College of Information and Electrical Engineering, Shenyang Agricultural University, 110866, Shenyang, China. E-mail: yatongmu@163.com. *Corresponding author.
2Research Center for Information Technology in Agriculture, Liaoning Engineering, 110866, Shenyang, China.
ABSTRACT: The Nitrogen content of rice leaves has a significant effect on growth quality and crop yield. We proposed and demonstrated a
non-invasive method for the quantitative inversion of rice nitrogen content based on hyperspectral remote sensing data collected by an unmanned aerial vehicle (UAV). Rice canopy albedo images were acquired by a hyperspectral imager onboard an M600-UAV platform. The radiation calibration method was then used to process these data and the reflectance of canopy leaves was acquired. Experimental validation was conducted using the rice field of Shenyang Agricultural University, which was classified into 4 fertilizer levels: zero nitrogen, low nitrogen, normal nitrogen, and high nitrogen. Gaussian process regression (GPR) was then used to train the inversion algorithm to identify specific spectral bands with the highest contribution. This led to a reduction in noise and a higher inversion accuracy. Principal component analysis (PCA) was also used for dimensionality reduction, thereby reducing redundant information and significantly increasing efficiency. A comparison with ground truth measurements demonstrated that the proposed technique was successful in establishing a nitrogen inversion model, the accuracy of which was
quantified using a linear fit (R2=0.8525) and the root mean square error (RMSE=0.9507). These results support the use of GPR and provide a
theoretical basis for the inversion of rice nitrogen by UAV hyperspectral remote sensing.
Key words: UAV, Hyperspectral remote sensing, Machine learning, Nitrogen content.
RESUMO: O teor de nitrogênio das folhas de arroz tem um efeito significativo sobre a qualidade do crescimento e o rendimento das culturas.
Propõe–se e demonstrou-se um método não invasivo para a inversão quantitativa do teor de nitrogênio do arroz com base em dados de detecção remota hiperespectral coletados por um veículo aéreo não tripulado (UAV). As imagens de albedo do dossel de arroz foram adquiridas por uma imagem de imagem hiperespectral a bordo de uma plataforma M600-UAV. O método de calibração da radiação foi então usado para processar esses dados e a reflectância das folhas do dossel foi adquirida. A validação experimental foi realizada utilizando o campo de arroz da Universidade Agrícola de Shenyang, que foi classificado em 4 níveis de fertilizantes: nitrogênio zero, baixo teor de nitrogênio, nitrogênio normal e alto teor de nitrogênio. A regressão do processo gaussiano (GPR) foi então usada para treinar o algoritmo de inversão para identificar bandas espectrais específicas com a maior contribuição. Isso levou a uma redução no ruído e uma maior precisão de inversão. A análise de componentes principais (PCA) também foi usada para redução de dimensionalidade, reduzindo assim a informação redundante e aumentando significativamente a eficiência. Uma comparação com as medidas de verdade no solo demonstrou que a técnica proposta foi bem sucedida no estabelecimento de um modelo de inversão de nitrogênio, cuja precisão foi quantificada usando um ajuste linear (R2 = 0,8525) e o erro quadrático médio quadrado (RMSE = 0,9507). Estes resultados suportam o uso do GPR e fornecem uma base teórica para a inversão do nitrogênio do arroz pela detecção remota hiperespectral do UAV.
Palavras-chave: UAV, detecção remota hiperspectral, aprendizado de máquinas, conteúdo de nitrogênio.
has provided a low-cost option for the acquisition of such data. This approach has several advantages
including flexibility in the choice of flight altitude,
detection range, spectral resolution, and sensor type. The equipment is fast and easy to transport, allowing
for timely deployment at specific crop life stages.
The UAV-based imaging systems have recently been used for multiple aspects of vegetation monitoring (SUGIURA et al. (2005); LIU, 2014),
including the fast acquisition of canopy reflectance
data from crops (WATTS et al. (2012); COLOMINA & MOLINA, 2014). For example, the nondestructive evaluation of onion canopies led to the establishment of a direct relationship between canopy density and LAI (CÓRCOLES et al., 2013). Acquisition of hyperspectral
images has allowed for the expansion and diversification
of crop measurements, to include parameters such as yield, biomass, and water content (ADAM et al. (2010); GOVENDER et al. (2007)). Spectroscopy data have also been used for phenol typing (ZAMAN-ALLAH et al.
(2015); SANKARAN et al. (2015)), and quantification
of structural and biochemical vegetation properties. (SCHAEPMAN et al. (2009); USTIN & GAMON, 2010; HOMOLAVÁ et al. (2013)).
However, this technology poses an important methodological challenge. Imaging spectroscopy data typically included highly correlated and noisy spectral bands, which frequently cause statistical problems due to small sample sizes. In this study we demonstrated the application of Gaussian process regression (GPR) to overcome these limitations. GPR is a type of machine learning algorithm capable of being trained to differentiate the contributions of various spectral bands. Bands with the
highest weight (contribution to a specific parameter
being measured) are selected while other less relevant bands are ignored. This leads to a reduction in noise and increased parameter measurement accuracy. The
application of GPR is specifically demonstrated for
the inversion of nitrogen content in rice crops.
ear fit. Discussion then provides a rationale for the
choice of GPR and a comparison between this and other UAV-based hyperspectral imaging studies.
Comparisons are made and benefits of this proposed
technique as a novel imaging tool for crop monitoring are presented, plans for future studies are discussed, and the paper is concluded.
MATERIALS AND METHODS
The study site was located at Shenyang
Agricultural University (41°81′63″N, 123°55′85″E;
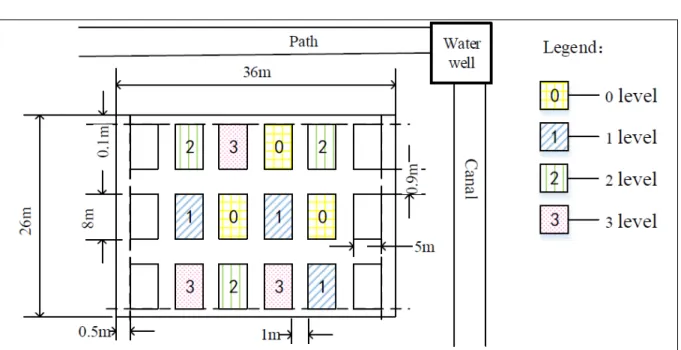
altitude 65 m) in Shenyang, Liaoning Province, China (see Fig.1). The tested rice-529 cultivar were provided by the College of Agriculture at Shenyang Agricultural University. Rice plant spacing was ~30cm, with a growth period of ~149 days. Stalks were transplanted on May 29, 2016. Seedlings were an early-maturing variety with dark green leaves, reaching a full height of ~107cm. A total of 12 plots (5m×8m) were established, consisting of four nitrogen (N) treatments with three replicates in a randomized block design (see Figure 1). Subgroups were arranged as follows:
(1) 0 level (in 2016) designated as no nitrogen. (2) 1 level = 2 level×0.5 (in 2016) designated as low nitrogen. (3) 2 level (N: 0.2kg/ha, P: 0.23kg/ha, K:0.08kg/ha) (in 2016) designated as normal nitrogen.
(4) 3 level = 2 level×1.5 (in 2016) designated as high nitrogen. A plastic plate isolation test plot was used, in which soil was inserted into a 10cm chamber to ensure fertilizer did not penetrate other plots.
UAV hyperspectral image acquisition
A six-rotor UAV (M600, DJI, China) was used for hyperspectral image acquisition. The
device was capable of lifting 6.5kg with a flight time
acquisition process. The Gaiasky-mini imager (Dualix Spectral Imaging, China) was used to collect
top-of-rice hyperspectral reflectance data ranging
from 400 to 1100nm with a 3.0nm resolution (256 bands), from an altitude of 50m. The data acquisition time was consistently between 12:00 and 10:00 to ensure acquisition under the same sky conditions.
Rice canopy spectral information was collected by a black and white calibration board and the digital number (DN) was converted to a
reflectance. The experiment was conducted in the tilling, jointing, heading, filling, and maturity stages of rice. Spectral curves for the five rice growth stages
and four nitrogen levels are presented in figure 2.
Figure 1 - The distribution of experimental plots at varying nitrogen levels.
hyperspectral data requires knowledge of the growth
conditions for each plant. As such, artificial destructive
sampling was used to measure the nitrogen content of each plot and provide a ground truth for validating the nitrogen model. Nitrogen content of the rice was obtained by Kjeldahl determination (AN et al. (2004); SEVERTSON et al. (2016)).A sample of 3-5 crops were selected from each cell and the fresh leaves were placed in an oven at 105°C for 15 minutes, dried at 70°C, and then crushed. After heating, samples were distilled and titrated. Nitrogen content was calculated as follows:
where V (mL) and V0 (mL) are the volumes of the acid standard solution used to titrate the test solution and the acid standard solution used for blank titration, respectively. The terms (mol/L) and m are the acid standard solution concentration and dry sample quality, respectively.
Hyperspectral Data Processing
In addition to rice plant data, this hyperspectral imaging method collects information on the soil and water as well. The spectral angle mapper (SAM) method was used in this study to classify hyperspectral images and obtain pure rice information. This was done using the ENVI 5.3 software package (Harris Geospatial
Solutions, Broomfield, CO, USA) and an n-dimensional
angle to match pixels in the reference spectrum. The algorithm implemented a spectrum of N bands as an N-dimensional spectral vector. The similarity between any two spectra was determined by calculating the angle between the N-dimensional vector and the endmember spectrum, with smaller angles representing higher similarity. In this study, raw data from 50 regions of interest (ROIs) were selected from the hyperspectral remote sensing images. The maximum angle threshold
was set to 0.1 (radians) for all classifications, indicating
that if the angle between the pixel spectrum and
other scenarios. These issues affect prediction accuracy as well as the interpretability of regression (retrieval)
models. As such, it is beneficial to reduce the spectral
dimension, either through reduction techniques or selection of particular spectral regions which are most applicable to targeted biophysical variables.
Principal component analysis (PCA) (CHEN & QIAN, 2011; JOLLIFFE, 2002)was used to improve
operational efficiency and reduce data dimensionality. In
this process, an orthogonal transformation was utilized to transform the original correlated random vectors into new uncorrelated vectors (SHLENS, 2002),thereby decomposing the eigenvalues of the covariance matrix using the Kullback–Leibler approach (ZENG et al. (2013). The feature vector corresponds to the principal component of the data and the eigenvalue corresponds to the weight of each principal component. Each base vector is independent of the other components and each component can be studied separately. The degree of
influence can be determined from the corresponding
eigenvalues, as smaller eigenvalues indicate less
influence. The principal component was selected and the
dimension reduced using singular value decomposition (SVD) (ZHAO et al. (2015)).
In this study, we first collected the initial
hyperspectral data and calculated the correlation
coefficient matrix. The covariance matrix R, established from the normalized correlation data matrix, reflects the
degree of correlation, as higher values are indicative of improved principal component analysis. Among these values, Rij (i, j = 1, 2, …, p) is the correlation coefficient for the original hyperspectral information Xi and Xj. It is worth noting that R is a real symmetric matrix, that is
Rij = Rji. As such, it is only necessary to calculate either the upper or lower triangular elements as follows:
The number of principal components was determined by calculating the eigenvalues of the covariance matrix R, the principal component contribution rate, and the cumulative variance contribution rate. Solutions of the characteristic
equation | λE –R|=0 were used to calculate the
eigenvalues λi (i, j = 1, 2, …, p) in ascending order of
size (λ1 ≥ λ2 ≥ … ≥ λi ≥ 0). These eigenvalues are the
variance (influence) of each principal component. The contribution of a given principal component Zi is given by:
The cumulative contribution rate can then be expressed as:
Eigenvalue criteria were used to select principal components, which were required to be larger than 1 with a cumulative contribution rate of 80–95%. The A values corresponded to main components of 1, 2, and M (m, P), where m is the number of principal components. Characteristic
values λ1, λ2, …, λm corresponded to principal
components 1, 2, …, m (m ≤ p). The initial factor
load matrix was established, in addition to the
correlation coefficient R (Zi, Xi) of the principal
component Zi and original index Xi. The significance of principal components is demonstrated by their correlation with hyperspectral information.
Gaussian Process Regression
Gaussian process regression (GPR) is a nonparametric black box model (TAERYON, 2007) equivalent to kernel ridge regression or kriging (VERRELST et al. (2016)).These methods have not been widely applied in machine learning until recently, due to their high computational complexity. The GPR is a family of kernel methods with the additional advantage of providing full conditional statistical descriptions for predicted variables,
which are primarily used to establish confidence
intervals and set hyper-parameters (RASMUSSEN
& WILLIAMS, 2006). The system can be identified
by searching relationships in the training data, which are suitable for the analysis of high-dimensional, small sample, and nonlinear problems. For any set
of random variables {xi ϵ X, i = 1, 2, …, n}, the joint
probability distribution of the process corresponds to states {Y(x1), Y(x2), …, Y(xn)}, which are subject to
the n-dimensional Gaussian distribution. In function space, all statistical features for the Gaussian process
are determined by its mean μ (x) and covariance
functions C(x, x`) C(x, x`). These can be expressed as:
Where x, x ϵ X are random input variables and
d is a dimensional vector. The Gaussian process can then
be defined as f(x)~GP(μ(x), C(x, x’)). A total of n data sets
were used as the training sample D = {( xi, yi), i = 1, 2, …,
n} for the Gaussian process, where xi is the d-dimensional
input vector and the observed target is denoted as yiϵ R.
Noise affected the observation of the target y and real
output difference for ε. The standard linear regression
model with Gaussian white noise can be expressed as: y= f (X)+, (6) where is a random noise-independent variable
expressed as ε~N (0, ), where is the noise variance.
The prior distribution of the target value x is given by:
(7) where is I the identity matrix.
This Bayesian framework can be used in the
functional space, defined by the GPR prior distribution,
to calculate a posterior distribution of the function and predict its output value. The training sample output y and the test sample output y* were combined with the Gaussian prior distribution as follows:
(8) In this formula, C (X, X) is the covariance
matrix of positive definite n x n order. The correlation
between xi and xj is characterized by the arbitrary term
cij. The term C (X, x*) represents the covariance matrix
for the training set input X and the test set x*. The term
C (x*, x*) is the covariance of the test set x*.
The objective of GPR, given a known input
x* and training set D, is to compute . The Bayesian
probability of the posterior distribution is then given by:
The predictive value of y* follows the
normal distribution, with an expected value of μy* and
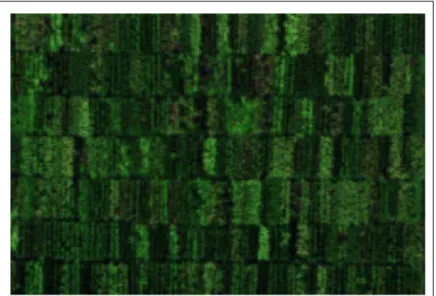
In addition to rice plants, fields include
soil, water, and green algae which act as interference factors (see Fig. 3). It is necessary to classify and extract images to obtain pure hyperspectral information from rice, which is used for the subsequent inversion modeling. The SAM method was used in this study to classify hyperspectral data. Figure 4 demonstrates the viability of this technique as the rice can be easily separated from adjacent objects. This is because the average spectrum of known rice points was extracted from the image as a reference and the similarity between the two spectra was determined. The generalized angle was calculated between each pixel vector and the reference spectral vector in each hyperspectral image. This method assumes the image data have
been reduced to ‘apparent reflectance,’ which implies
all dark radiation and path radiation deviations have been removed.
(UTO et al. (2013)).Zhu et al. (2009) used a low-altitude UAV and object-oriented segmentation to estimate nitrogen rates in rice crops (ZHU et al. (2009)).While GPR has been used previously for the monitoring of various rice plant parameters, such as LAI (CAMPOS-TABERNER et al. (2016)),this study represents the
first application of GPR specifically to measuring rice
nitrogen content. The GPR was selected for this study, as opposed to more conventional techniques, because
of its efficiency and accuracy.
Verrelst et al. (2012) recently evaluated several parametric and non-parametric techniques for estimating vegetation parameters, using data from the hyperspectral Compact High-Resolution Imaging Spectrometer (CHRIS) (VERRELST et al. (2012)).This comparison included conventional parametric techniques such as generic narrowband vegetation indices (VIs) and the normalized area over
reflectance curve method. The GPR outperformed
these other methods while including only 4 of the
available 62 bands. This represents a significant
decrease in data processing requirements, leading
to increases in operational efficiency and reduced
runtimes. The GPR has also been shown to provide higher estimation accuracy when compared with support vector regression (SVR), general regression neural networks, and band ratio polynomial
regression (PASOLLI et al. (2010)).As discussed by Verrelst et al. (2013), GPR algorithms are easier to train than neural networks and allow for more
flexibility than support vector machines (SVMs) in
the choice of kernel type (VERRELST et al. (2012)); ARENAS-GARCIA et al. (2013)).The utilization of dimensionality reduction further increased the
efficiency of the proposed technique (MAATEN
Figure 4 - Pure hyperspectral images of rice.
low inversion accuracy. In future research, the scope of this study will be broadened to include other wavelengths, as well as various sampling sights, terrain distributions, and crop types.
CONCLUSION
In this study, a hyperspectral remote sensing platform was used to extract nitrogen content from a rice canopy. Machine learning based on Gaussian process regression was utilized to identify the most relevant spectral bands, thereby reducing noise and increasing inversion accuracy. Ground truth rice leaf nitrogen levels were obtained by invasive ground sampling and compared with information from the proposed inversion technique. Principal component analysis was used for dimensionality reduction to eliminate redundant spectral data, thereby increasing
system efficiency. Results demonstrated the proposed
spectral angle mapper could acquire accurate pure rice information from the original image. These processed data were used to establish a nitrogen inversion model, the accuracy of which was assessed using two metrics with resulting values of R2=0.8525 and RMSE=0.9507. This suggested that the proposed method could be a valuable new imaging tool for the non-invasive
measurement of nitrogen nutrition levels in rice fields.
ACKNOWLEDGMENTS
This work was funded by National Key R&D Program of China and by Ministry of Science and Technology of the People’s Republic of China (2016YFD0200600 and 2016YFD0200603).We would like to thank the Liaoning Engineering Research Center for Information Technology in Agriculture for the use of their equipment..
DECLARATION OF CONFLICTING OF INTERESTS
We have no conflict of interest to declare.
ARENAS-GARCIA, J. et al. Kernel Multivariate Analysis Framework for Supervised Subspace Learning: A Tutorial on Linear and Kernel Multivariate Methods. IEEE Signal Processing
Magazine, v.30, p.16-29, 2013. Available from:
<http://sci-hub.tw/10.1109/msp.2013.2250591>. Accessed: Jun. 15, 2017. doi:10.1109/MSP.2013.2250591.
CAMPOS-TABERNER, M. et al. Multitemporal and multiresolution leaf area index retrieval for operational local rice crop monitoring. Remote Sensing of Environment, v.187, p.102-118, 2016. Available from: <http://agri.ckcest.cn/ass/NK005-20170130005.pdf>. Accessed: Feb. 11, 2017. doi:10.1016/j. rse.2016.10.009.
CHEN, G.Y., QIAN, S.E. Denoising of hyperspectral imagery using principal component analysis and wavelet shrinkage.
IEEE Transactions on Geoscience and Remote Sensing, v.49,
p.973-980, 2011. Available from: <https://ieeexplore.ieee.org/ document/5607305/>. Accessed: Jun. 10, 2017. doi:10.1109/ TGRS.2010.2075937.
COLOMINA, I., MOLINA, P. Unmanned aerial systems for photogrammetry and remote sensing: A review. ISPRS Journal
of Photogrammetry and Remote Sensing, v.92, p.79-97, 2014.
Available from: <https://zenodo.org/record/57983#.WyO_o0xuJPY>. Accessed: Sep. 17, 2016. doi:10.1016/j.isprsjprs.2014.02.013.
CÓRCOLES, J.I. et al. Estimation of leaf area index in onion (Allium
cepa L.) using an unmanned aerial vehicle. Biosystems Engineering, v.115, p.31-42, 2013. Available from: <https://www.sciencedirect. com/science/article/pii/S1537511013000214?via%3Dihub>. Accessed: Mar. 7, 2017. doi:10.1016/j.biosystemseng.2013.02.002.
DU, W., XU, T.Y. Effect and assessment of UAV spraying parameters at japonica rice canopies. Journal of Agricultural Mechanization Research, v.4, p.182-186, 2017. Available from: <http://www.wanfangdata.com.cn/ details/detail.do?_type=perio&id=njhyj201704036>. Accessed: May. 03, 2016. doi: 10.3969/j.issn.1003-188X.2017.04.036.
GARRIGUES, S. et al. Validation and intercomparison of global Leaf Area Index products derived from remote sensing data.
Journal of Geophysical Research: Biogeosciences, v.113,
2008. Available from: <https://agupubs.onlinelibrary.wiley.com/ doi/abs/10.1029/2007JG000635> . Accessed: Jul. 13, 2017. doi:10.1029/2007JG000635.
GOVENDER, M. et al. A review of hyperspectral remote sensing and its application in vegetation and water resource studies. Water
HOMOLOVÁ, L. et al. Review of optical-based remote sensing for plant trait mapping. Ecological Complexity, v.15, p.1-16, 2013. Available from: <http://library.wur.nl/WebQuery/ wurpubs/442967>. Accessed: May. 15, 2017. doi:10.1016/j. ecocom.2013.06.003.
JOLLIFFE, I.T. Principal Component Analysis. Second Edition, New York: Springer, p.1-6, 2002.
LAN, Y.B. Agricultural aviation applications in USA. Transactions
of the Chinese Society for Agricultural Machinery, v.5,
p.194-201, 2013. Available from: <http://www.wanfangdata.com.cn/ details/detail.do?_type=perio&id=nyjxxb201305034>. Accessed: Apr. 14, 2017. doi:10.6041/j.issn.1000-1298.2013.05.034.
LEE, Y.J. et al. A simple spectral index using reflectance of 735nm to assess nitrogen status of rice canopy. Agronomy Journal, v.100, p.205–212, 2008. Available from: <https://dl.sciencesocieties.org/ publications/aj/abstracts/100/1/205>. Accessed: Jan. 13, 2017. doi:10.2134/agronj2007.0018.
LI, M. et al. A systematic comparison of different object-based classification techniques using high spatial resolution imagery in agricultural environments. International Journal of Applied
Earth Observation and Geoinformation, v.49, p.87-98, 2016.
Available from: <http://agri.ckcest.cn/ass/NK005-20160328004. pdf>. Accessed: Mar. 24, 2016. doi: 10.1016/j.jag.2016.01.011.
LIU, F. Study on monitoring fractional vegetation cover of garden plots by unmanned aerial vehicles. Transactions of the Chinese
Society for Agriculural Machinery, v.45, p.250-257, 2014.
Available from: <http://www.wanfangdata.com.cn/details/detail.d o?_type=perio&id=nyjxxb201411039>. Accessed: Dec. 11, 2017. doi:10.6041/j.issn.1000-1298.2014.11.039.
MAATEN, L.J.P.V.D. et al. Dimensionality Reduction: A Comparative Review. Journal of Machine Learning Research, v.10, 2007. Available from: <https://core.ac.uk/display/23318387>. Accessed: May. 19, 2017. doi:10.1.1.364.6824.
MULLA, D.J. Twenty-five years of remote sensing in precision agriculture: Key advances and remaining knowledge gaps.
Biosystems engineering, v.114, p.358-371, 2013. Available
from: <http://ccc.inaoep.mx/~mdprl/documentos/17062015.pdf>. Accessed: May. 20, 2016. Doi:10.1016/j.jag.2016.01.011.
PASOLLI, L. et al. Gaussian process regression for estimating chlorophyll concentration in subsurface waters from remote sensing data. IEEE Geoscience and Remote Sensing Letters, v.7, p.464-468, 2010. Available from: <https://www.infona.pl/resource/ bwmeta1.element.ieee-art-000005411816>. Accessed: Jul. 18, 2016. doi:10.1109%2FLGRS.2009.2039191.
RASMUSSEN, C., WILLIAMS, C. Gaussian processes for machine learning. MIT Press, 2006.
SANKARAN, S. et al. Field-based crop phenotyping: Multispectral aerial imaging for evaluation of winter wheat emergence and spring stand. Computers and Electronics in Agriculture, v.118, p.372-379, 2015. Available from: <https://www.sciencedirect. com/science/article/pii/S0168169915002768>. Accessed: May. 15, 2017, doi:10.1016/j.compag.2 015.09.001.
SCHAEPMAN, M. E. et al. Earth system science related imaging spectroscopy-an assessment. Remote Sens. Environ, v.113, p.123-137, 2009. Available from: <https://www.sciencedirect.
com/science/article/pii/S0034425709000819>. Accessed: Mar. 02, 2017, doi:10.1016/j.rse.2009.03.001.
SEVERTSON, D. et al. Unmanned aerial vehicle canopy reflectance data detects potassium deficiency and green peach aphid susceptibility in canola. Precision Agriculture, p.1-19 2016. Available from: <https://link.springer.com/article/10.1007 %2Fs11119-016-9442-0>. Accessed: Jul. 20, 2016 doi:10.1007/ s11119-016-9442-0.
SHLENS, J. A tutorial on principal component analysis. New York: Cornell University, 2002.
SUGIURA, R. et al. Remote-sensing technology for vegetation monitoring using an unmanned helicopter. Biosystems Engineering, v.90, p.369–379, 2005. Available from: <http:// elibrary.asabe.org/abstract.asp?aid=17837>. Accessed: Sep. 15, 2017. doi: 10.13031/2013.1 7837.
SWAIN, K.C. et al. Adoption of an unmanned helicopter for low-altitude remote sensing to estimate yield and total biomass of a rice crop. Transactions of the ASABE, v.53, p.21-27, 2010. Available from: <https://naldc.nal.usda.gov/download/41029/ PDF>. Accessed: May. 26, 2016,
TAERYON, C. Alternative posterior consistency results in nonparametric binaryregression using Gaussian process priors.
Journal of Statistical Planning and Inference, v.137,
p.2975-2983, 2007. Available from: <https://linkinghub.elsevier.com/ retrieve/pii/S0378375807000407>. Accessed: Sep. 26, 2017. doi:10.1016/j.jspi.2006.11.001.
USTIN, S., GAMON, J. Remote sensing of plant functional types. New Phytologist, v.186, p.795-816, 2010. Available from: <https://www.ncbi.nlm.nih.gov/pubmed/20569415>. Accessed: Apr. 22, 2016. doi:10.1111/j.1469-8137.2010.03284.x.
UTO, K. et al. Characterization of rice paddies by a UAV-mounted miniature hyperspectral sensor system. IEEE Journal of Selected
Topics in Applied Earth Observations and Remote Sensing,
6, 851-860, 2013. Available from: <https://ieeexplore.ieee.org/ document/6482672/>. Accessed: Mar. 16, 2017. doi: 10.1109/ JSTARS.2013.2250921.
VERRELST, J. et al. Gaussian process retrieval of chlorophyll content from imaging spectroscopy data. IEEE Journal of
Selected Topics in Applied Earth Observations and Remote
Sensing, v.6, p.867-874, 2013. Available from: <https://www.
mendeley.com/research-papers/gaussian-process-retrieval-chlorophyll-content-imaging-spectroscopy-data/>. Accessed: Jun. 28, 2017. doi: 10.1109/JSTARS.2012.2222356.
VERRELST, J. et al. Retrieval of vegetation biophysical parameters using Gaussian process techniques. IEEE Transactions on
Geoscience and Remote Sensing, v.50, p.1832-1843, 2012.
Available from: <https://www.mendeley.com/research-papers/ retrieval-vegetation-biophysical-parameters-using-gaussian-process-techniques/>. Accessed: Nov. 18, 2016. doi:10.1109/ TGRS.2011.2168962.
VERRELST, J. et al. Spectral band selection for vegetation properties retrieval using Gaussian processes regression.
International Journal of Applied Earth Observation and
Geoinformation, v.52, p.554-567, 2016. Available from: <http://
www.mdpi.com/2072-4292/4/6/1671>. Accessed: Jul. 14, 2017. doi:10.3390/rs4061671.
YU, F.H., XU, T.Y. Models for estimating the leaf NDVI of japonica rice on a canopy scale by combining canopy NDVI and multisource environmental data in Northeast China. International Journal of
Agricultural and Biology, v.9, p.132-142, 2016. Available from:
<https://ijabe.org/index.php/ijabe/article/view/2266>. Accessed: Feb. 09, 2017. doi:10.3965/j.ijabe.20160905.2266.
Development, v.47, p.23-32, 2015. Available from: <http://www. wanfangdata.com.cn/details/detail.do?_type=perio&id=jsjyjy fz201001004>. Accessed: Dec. 23, 2016.
ZHU, J. et al. Quantifying nitrogen status of rice using
low altitude UAV-mounted system and object-oriented
segmentation methodology. ASME 2009 International Design