http://dx.doi.org/10.1590/1980-57642018dn12-030003
Validity and reliability of the Brazilian
Portuguese version of the Australian
National University – Alzheimer’s Disease
Risk Index (ANU-ADRI)
Marcus Kiiti Borges1, Alessandro Ferrari Jacinto2, Vanessa Albuquerque Citero3
ABSTRACT. The ANU-ADRI is a self-report tool that assesses risk for Alzheimer’s Disease (AD). Objective: To validate an adapted Portuguese version of this instrument and to carry out the reliability Test-Retest of the ANU-ADRI in Brazil.
Methods: In this longitudinal study, the sample was formed (n=100) by two groups (A and B): each comprising 50 patients assisted by GPs (general practitioners) or specialists in dementia. All participants were cognitively healthy upon screening using the MMSE. The ANU-ADRI was applied at baseline (Test) and again within 1 week of the test (Retest).
Results: There was a correlation between the mean scores of the ANU-ADRI Test and Retest (r=0.918, P<0.001). Group A had higher ANU-ADRI scores than those of group B (P<0.05). There was a moderate negative linear relation between the ANU-ADRI and MMSE scores (r= –0.353, P<0.001). Conclusion: The ANU-ADRI is a valid and reliable instrument to assess whether community-dwelling Brazilians are at greater risk for AD. Low levels of education were associated with higher risk scores on the ANU-ADRI.
Key words: Alzheimer’s disease, dementia, risk factors, primary prevention, geriatric assessment.
VALIDADE E CONFIABILIDADE DA VERSÃO BRASILEIRA DO ÍNDICE DE RISCO DA DOENÇA DE ALZHEIMER DA “AUSTRALIAN NATIONAL UNIVERSITY” (ANU-ADRI)
RESUMO. O Índice de Risco da Doença de Alzheimer da “Australian National University” (ANU-ADRI) é uma ferramenta baseada em auto-relato que avalia o risco para Doença de Alzheimer (DA). Objetivo: Validar uma versão adaptada em português deste instrumento e realizar a confiabilidade Teste-Reteste do ANU-ADRI no Brasil. Métodos: Neste estudo longitudinal, a amostra foi composta (n=100) por 2 grupos (A e B): cada um com 50 pacientes assistidos por clínicos gerais ou especialistas em demência. Todos os participantes eram cognitivamente normais após o rastreio usando o MEEM. O ANU-ADRI foi aplicado no início (Teste) e até uma semana após o teste (Reteste). Resultados: Houve uma correlação entre a média de pontuações do ANU-ADRI no Teste e Reteste (r=0,918, P<0,001). O grupo A teve pontuações maiores no ANU-ADRI que as do grupo B (P<0,05). Houve uma relação moderada linear entre as pontuações do ANU-ADRI e MEEM (r= –0,353, P<0,001). Conclusão: ANU-ADRI é um instrumento válido e confiável para avaliar se brasileiros que vivem na comunidade estão à risco maior para DA. Baixos níveis de escolaridade foram relacionados às pontuações mais altas do ANU-ADRI.
Palavras-chave: doença de Alzheimer, demência, fatores de risco, prevenção primária, avaliação geriátrica.
A
lzheimer’s disease (AD) is the most com-mon form of dementia and represents amajor public health problem in older people.1
There is a substantial body of
epidemiologi-This study was conducted at the Departmentof Psychiatry of the Federal University of São Paulo, SP, Brazil.
1MSc, Postgraduate Program in Psychiatry, Escola Paulista de Medicina, Universidade Federal de São Paulo (EPM/UNIFESP), São Paulo, SP, Brazil. 2PhD Associ-ate Professor, Department of Internal Medicine, Faculdade de Medicina de Botucatu, Universidade Estadual Paulista Júlio de Mesquita Filho (UNESP), Botucatu, SP, Brazil. 3PhD Associate Professor, Department of Psychiatry, Escola Paulista de Medicina, Universidade Federal de São Paulo (UNIFESP), São Paulo, SP, Brazil.
Marcus Kiiti Borges. R. Borges Lagoa, 570 / 9 andar – 04038-030 São Paulo SP – Brazil. E-mail: [email protected]
Disclosure: The authors report no conflicts of interest.
cal data regarding primary prevention of the disease.2
Current evidence shows multiple risk factors associated with cognitive impairment and dementia.3
While biological and some other factors are non-modifiable, nutritional or behavioral factors can be mod-ified through lifestyle interventions. Early identification of modifiable risk factors and reliable estimation of the risk are important for the development of strategies to delay dementia onset.4
One of the challenges of interpreting findings of review studies on risk factors for AD is distinguishing factors associated with the increase or reduction of risk for AD. The most relevant non-modifiable risk factors are age and the apolipoprotein E4 (APOE4) gene vari-ant. There is strong evidence indicating that these fac-tors increase the risk of AD.5-7
Several cardiovascular (CV) and metabolic or psy-chiatric disorders often co-occur (e.g. hypertension, obesity, diabetes, hyperlipidemia and depression) and interact during lifetime.8 These disorders may be
associ-ated with an increased risk of AD. Behavioral or lifestyle-related risk factors have also been described such as low social engagement9,10 (loss of spouse and living alone or
without a partner) or current smoking.11 It is therefore
important to identify factors that may slow progression of AD among persons at risk and in whom the condition has already been diagnosed.
By contrast, some factors may reduce risk of demen-tia (e.g. involvement in cognitive activities later in life and educational attainment,12-14 physical activity,10,15,16
or other leisure activities17 that are beneficial for
cog-nitive reserve18 and functioning.19 A healthy diet20 and
light-to- moderate alcohol consumption15 have shown a
possible protective role, while the Mediterranean diet21
may reduce the risk of dementia.
It is crucial that preventive intervention focuses on the identification of modifiable risk factors. Models have been developed for predicting dementia.22
Unfortu-nately, there is no gold standard model for dementia risk prediction from a population-based perspective.23 No
comparable measure has been developed for risk factors measured in older adults (60 years of age or older), since CV risk factors that are assessed in a younger popula-tion were typically not the same CV risk factors used in cohorts with elderly. For example, high cholesterol and body mass index (BMI) are risk factors for AD in middle-aged patients, but both would no longer be considered risk factors in late life.24
In the CAIDE study, 1,449 participants were evalu-ated at an average age of 50 and followed up 20 years later for dementia.25 Based on this sample, a Mid-Life
Dementia Risk Index was derived, that included age, sex, education, BMI, blood pressure, total cholesterol, physical activity, and APOE. Scores were obtained by standardizing β coefficients from a multivariable logis-tic model. In 2009, Barnes et al. published a Late-Life Dementia Risk Index for predicting dementia risk strata (low, moderate, or high) within a 6-year follow-up.26
The Cardiovascular Health Cognition Study, nested in the Cardiovascular Health Study (CHS), began in 1998-1999 and included 3608 CHS study participants, all of whom had an MRI scan and Modified Mini-Mental State Examination (3MS) scores for 1991-1994. Although the Late-Life Dementia Risk Index has somewhat stronger prediction characteristics than the Mid-Life Dementia Risk Index, its purpose was only for 6-year prediction. In addition, it required informa-tion that may not be readily obtained from individuals at the population level, including quantitative Mag-netic Resonance Image (MRI) analyses. To circum-vent this problem, the same investigators pooled data from four cohort studies, the CHS, the Framingham Heart Study (FHS), the Health and Retirement Study (HRS), and the Sacramento Area Latino Study on Aging (SALSA).27
In Australia, Anstey et al.,28 used a different approach
to develop a risk index called the Australian National University Alzheimer’s Risk Index (ANU-ADRI) that could be inexpensively applied in populations. The ANU-ADRI has been validated in three large cohorts and this tool addresses issues involving risk and protective factors for AD.24
This index used the existing literature on dementia and AD risk to select risk factors that could be readily obtained by questionnaire, without clinical assessment, neuropsychological testing, genetic evaluation, or imag-ing studies. This approach did not rely on data from one study only, but rather estimated coefficients from exist-ing meta-analyses of risk factors.
The use of self-reported data alone can be viewed as an advantage in terms of ease of data collection, but it can also be regarded as a liability in terms of the accu-racy of exposure ascertainment. Individual scores were developed using the same technique as Kivipelto et al.,25
consumption, social engagement, physical activity, cog-nitive activity, fish intake, and pesticide exposure.
Satizabal et al.,29 found that educational levels might
have contributed to the 5-year delay that they observed in the mean age at onset of clinical dementia. Partici-pants from the Framingham Heart Study who had at least a high school diploma had showed a reduced risk of dementia but the authors concluded that “the inci-dence of dementia has declined over the course of three decades”. The factors contributing to this decline have not been completely identified.29 Chary et al.,30
con-ducted another cohort study and concluded that early predictors of dementia differ according to educational level.
We aimed to validate the ANU-ADRI for the Brazil-ian population by investigating whether education levels affect performance of the instrument. The Test-Retest reliability of the ANU-ADRI was determined for a sam-ple of individuals assessed within two different settings (Primary and Secondary Care) in Brazil.
METHODS
Study design: longitudinal study
Participants were assessed for eligibility as follows:
• Inclusion criteria: the target sample included mid-dle-aged individuals (40-60 years) and older adults (>60 years) living in Curitiba, Brazil.
• Exclusion criteria: participants with a history of sensory or motor deficits that would affect cognition and the assessment (e.g. hearing loss or visual impair-ment, parkinsonism); significant neurologic or psychiat-ric conditions (e.g. stroke or epilepsy, psychosis, bipolar disorder or schizophrenia); as well as other significant medical events or health problems (e.g. recent cardiovas-cular event, renal failure or treatment for cancer); and cognitive impairment or a diagnosis of any dementia were excluded.
Participants who met all inclusion and no exclusion criteria were invited for the baseline test between July 2015 and June 2016. All participants were recruited by GPs. Patients were referred to dementia specialists in order to exclude cases of dementia (at baseline). Briefly, the DSM-V31 diagnostic criteria were used for dementia.
Sample size: Data from 100 patients (n=100) were used. All participants were cognitively healthy (no evi-dence of cognitive decline or dementia at baseline) and divided into 2 groups by convenience (each group n=50): A= patients seen by specialists (Internal Medicine – Ger-iatrician and Neurologist, or Psychiatrist) – Secondary Care at the “Hospital do Idoso Zilda Arns” (HIZA) for the elderly; B= patients only seen by GPs (General
Practitio-ners) - Primary Care at the “Ouvidor Pardinho” Commu-nity Health Center (CHC). All patients were instructed as to study goals and gave written informed consent prior to instrument evaluation.
Assessment tools
The following instruments were used in this study:
1) Pre-test evaluation
• Baseline questionnaire: Data base (sociodemo-graphic questionnaire, clinical inventory): age, gender, marital status, occupation, social support, education (educational level), history of clinical disease or disabil-ity, seen by neurologist or psychiatrist, history of neu-rologic or psychiatric disorders, and use of psychotropic drugs.
• Screening questionnaire: MMSE − Mini-Mental State Examination: participants were required to obtain a score >20 or >25 adjusted for level of education (cut-off scores for illiterate persons: 20; 1-4 years of educa-tion: >25; 5-8 years: >27; and 9 years or more: >28).32,33
2) ANU-ADRI evaluation
• The Australian National University Alzheimer’s Disease Risk Index (ANU-ADRI):28 the main
question-naire was developed as an online self-report tool assess-ing future risk of AD. The ANU-ADRI includes 15 vari-ables (S1 Table) : 11 risk factors and 4 protective factors, consisting of 84 items that are combined into a sum-mary score. The ANU-ADRI is available online at http:// anuadri.anu.edu.au/for-researchers for use by researchers. The instrument was translated from the original lan-guage of English into Portuguese by bilingual transla-tors, and was subsequently reviewed and evaluated as to the degree of difficulty of the translation and equiva-lence.34 All participants were assessed with the Brazilian
Portuguese version of the ANU-ADRI.35
In the present study, test evaluation was applied via individual interviews (face-to-face) by five interviewers trained in data collection to ensure maintenance of the meaning of all items.
Procedures
All participants provided written, informed consent before ANU-ADRI evaluation. The ANU-ADRI was applied at two time points: at baseline (Test) and within a week of the Test (Retest).
• Week 1 (ANU-ADRI Test)
• Week 2 (ANU-ADRI Retest)
(register number: 933.122) and Research Ethics Com-mittee of the Health Department of Curitiba (register number: 1.034.372) which approved the study for fea-sibility of access to the research venue (at HIZA and CHC). The approved research project is available on the “Plataforma Brasil” database (CAAE registry number 38185614.51001.5505).
Statistical analyses
All statistical analyses were performed using SPSS version 20.0 and STATA 12. The sociodemographic and clinical data were analyzed using descriptive analysis. Categorical variables were expressed as relative frequen-cies and absolute numbers. For continuous variables: means, quartiles, minimum, maximum and standard deviation were used. The associations between two categorical variables were tested using the Chi-square test (χ2), or alternatively in cases of smaller samples,36
Fisher’s exact test (F) was used.
The Test-Retest reliability assessment evaluates the extent to which questionnaire scores are free from random error.37 The intraclass correlation coefficient
(ICC) was used, where values close to 1 indicate good agreement between the answers. Based on a minimal acceptable ICC of 0.75 and on the hypothesis that the present findings would be consistent yielding an ICC of 0.90, it was established that a minimum sample size of 112 was required to attain a level of significance and power of 0.9.38 It was anticipated that around 10% of
patients would be excluded or refuse to take part for motivational or practical reasons. Sample size analysis was performed using the PASS 2008 (Power Analysis and Sample Size System) – NCSS.
Bland-Altman39 analysis was used to visualize the
differences and means of the two evaluations on a scat-ter plot. If there is no systematic bias, points around the zero value of the difference can be expected. In addition, the plot shows a confidence interval of 95% for the dif-ference. Construct validity was used because there is no reference instrument (“gold standard” method of mea-surement) for comparison.40 Validation of the Brazilian
Portuguese version of the ANU-ADRI was performed by investigating whether education influences the perfor-mance of the instrument. Higher educated older adults may have a greater cognitive reserve that can delay the clinical manifestation of dementia.41
In order to assess whether the ANU-ADRI is able to discriminate the individuals at risk for AD, the partici-pants were evaluated in two different settings (Primary and Secondary Care) in Brazil. The mean scores of the two groups were compared in patients who were treated
112 Assessed for eligility
12 Excluded 7 Dementia* 2 CIND + morbidities
2 Bipolar disorder 1 Psychosis
Group A
50 assisted by specialists in dementia
Secondary care at HIZA
Group B
50 assisted by GPs Primary care at CHC
CIND: Cognitive Impairment no Dementia; GPs: General Practitioners; CHC: Community Health Center; HIZA: “Hospital do Idoso Zilda Arns” *Dementia cases: assessed and confirmed by experts (neurologists and psychiatrists)
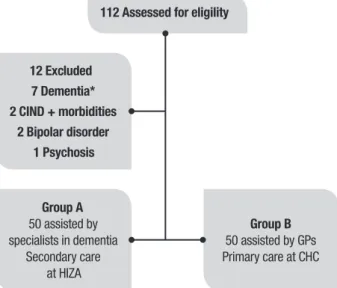
Figure 1. Flow diagram shows initial recruitment, exclusions and samples.
by general practitioners and by specialists in dementia. The mean scores were compared using Student’s t-test and Cohen’s (d) for independent samples. Effect size complements the statistical hypothesis testing and plays an important role in power analyses. Effect sizes for differences between means (d) was defined as small (0.2-0.4), medium (0.4-0.8), or large (>0.8).42
Divergent validation was evaluated based on the cor-relation between Mean Score on the ANU-ADRI Test/ Retest and Mean Score on the MMSE, using Spearman’s correlation (rs) and Pearson’s correlation (r).
A significance level of 5% was adopted for all statisti-cal tests.
RESULTS
A sample of 112 older adults was invited and agreed to participate in this study (Figure 1). Twelve patients were excluded: [1] two patients with cognitive impair-ment no deimpair-mentia (CIND) and morbidities (Parkinson’s Disease or visual impairment); [2] seven patients with dementia*; [3] two patients with Bipolar disorder; and [4] one patient with Psychosis.
Sociodemographic data
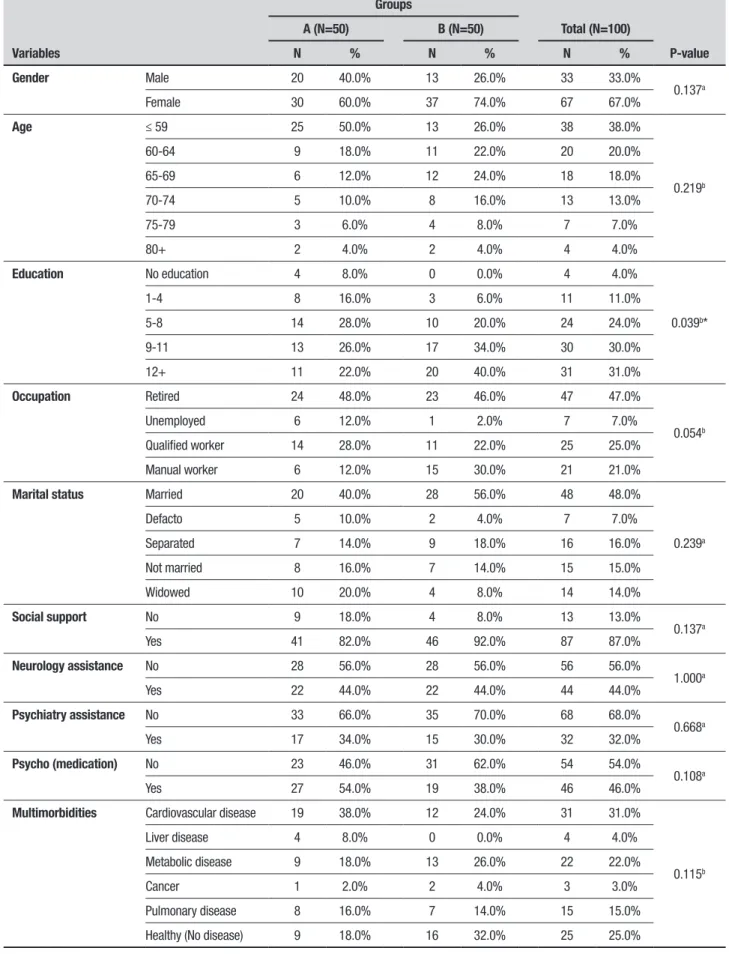
Table 1. Sociodemographic characteristics of the study samples.
Variables
Groups
Total (N=100)
P-value
A (N=50) B (N=50)
N % N % N %
Gender Male 20 40.0% 13 26.0% 33 33.0%
0.137a
Female 30 60.0% 37 74.0% 67 67.0%
Age ≤ 59 25 50.0% 13 26.0% 38 38.0%
0.219b
60-64 9 18.0% 11 22.0% 20 20.0%
65-69 6 12.0% 12 24.0% 18 18.0%
70-74 5 10.0% 8 16.0% 13 13.0%
75-79 3 6.0% 4 8.0% 7 7.0%
80+ 2 4.0% 2 4.0% 4 4.0%
Education No education 4 8.0% 0 0.0% 4 4.0%
0.039b*
1-4 8 16.0% 3 6.0% 11 11.0%
5-8 14 28.0% 10 20.0% 24 24.0%
9-11 13 26.0% 17 34.0% 30 30.0%
12+ 11 22.0% 20 40.0% 31 31.0%
Occupation Retired 24 48.0% 23 46.0% 47 47.0%
0.054b
Unemployed 6 12.0% 1 2.0% 7 7.0%
Qualified worker 14 28.0% 11 22.0% 25 25.0%
Manual worker 6 12.0% 15 30.0% 21 21.0%
Marital status Married 20 40.0% 28 56.0% 48 48.0%
0.239a
Defacto 5 10.0% 2 4.0% 7 7.0%
Separated 7 14.0% 9 18.0% 16 16.0%
Not married 8 16.0% 7 14.0% 15 15.0%
Widowed 10 20.0% 4 8.0% 14 14.0%
Social support No 9 18.0% 4 8.0% 13 13.0%
0.137a
Yes 41 82.0% 46 92.0% 87 87.0%
Neurology assistance No 28 56.0% 28 56.0% 56 56.0%
1.000a
Yes 22 44.0% 22 44.0% 44 44.0%
Psychiatry assistance No 33 66.0% 35 70.0% 68 68.0%
0.668a
Yes 17 34.0% 15 30.0% 32 32.0%
Psycho (medication) No 23 46.0% 31 62.0% 54 54.0%
0.108a
Yes 27 54.0% 19 38.0% 46 46.0%
Multimorbidities Cardiovascular disease 19 38.0% 12 24.0% 31 31.0%
0.115b
Liver disease 4 8.0% 0 0.0% 4 4.0%
Metabolic disease 9 18.0% 13 26.0% 22 22.0%
Cancer 1 2.0% 2 4.0% 3 3.0%
Pulmonary disease 8 16.0% 7 14.0% 15 15.0%
Healthy (No disease) 9 18.0% 16 32.0% 25 25.0%
assessed: 48% married; 47% retired; 87% received social support; 68% had not received psychiatric care; and 31% had cardiovascular morbidities (only 25% without chronic medical condition).
According to (Table 1), the two groups were equiva-lent in terms of the sociodemographic data analyzed with no statistically significant differences between them, except for the difference in distribution of educa-tion (P<0.05). The age range and the ANU-ADRI score range are given in (Tables 2 and 3), respectively. The median age was 62 years, similar to mean age. There was a statistically significant difference (P<0.05) in ANU-ADRI mean score by group (Table 3).
Test-Retest reliability
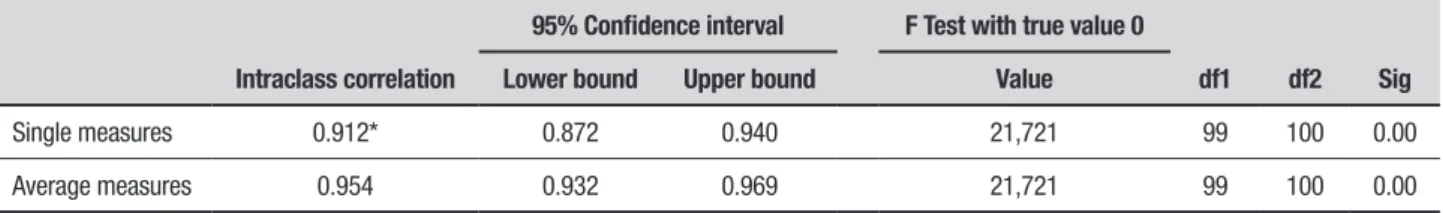
The Test-Retest reliability assessment revealed good measurement reproducibility. The intraclass correlation coefficient (ICC) was 0.912 (P<0.001, 95%CI=[0.872; 0.940]), as shown in (Table 4).
In addition, (Figure 2 and S2 Table) show a strong correlation between the mean scores on the ANU-ADRI Test and Retest (P<0.001).
Bland-Altman plot
The Bland-Altman plot shows two different measures for the same patient.38 Thus, the graph allows
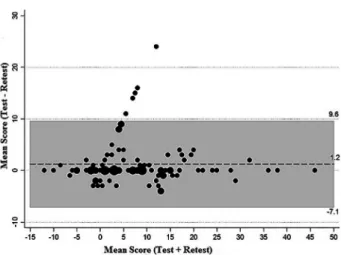
evalua-tion of the magnitude of discordance − by means of the difference as a function of score level (represented by the mean). The Bland-Altman plot for the two measure-ments of the ANU- ADRI score is shown in (Figure 3).
Construct validity (known-groups validity)
Construct validity analyzed whether the ANU-ADRI was related to the variables it should be, thereby charac-terizing a valid instrument. In this approach, the ANU-Table 2. Age range.
Mean SD Minimum Maximum Quartile 1 Median Quartile 3 N
62.6 9.8 40.0 86.0 56.0 62.0 69.0 100
SD: standard deviation.
Table 3. ANU-ADRI score range.
Group Mean SD Minimum Maximum Quartile Median Quartile N P-valuea
A 11.0 10.8 –12.0 46.0 3.0 9.0 15.3 50
0.021*
B 6.2 9.8 –10.0 36.0 –2.0 4.5 13.0 50
ap value calculated using Student’s t-test. *P<0.05.
Table 4. Intraclass correlation coefficient.
Intraclass correlation
95% Confidence interval F Test with true value 0
df1 df2 Sig
Lower bound Upper bound Value
Single measures 0.912* 0.872 0.940 21,721 99 100 0.00
Average measures 0.954 0.932 0.969 21,721 99 100 0.00
*P<0.001
ADRI questionnaire was administered to two known groups to confirm whether the hypothesized difference impact scores of the two groups.
It is notable that in group A, the percentage of indi-viduals with 12 years or more of education was lower than for group B (P=0.039). Accordingly (Figure 4), group A had higher ANU-ADRI scores than group B (P<0.05). A higher mean score on the ANU-ADRI was found in the group of individuals with low education (<12 years of education).
Cohen’s d was used as a measure of effect size, where the comparison of two means revealed a significant dif-ference of 0.469 (95%CI=[0.070;0.865]).
Divergent validity
According to (Figure 5), there was a moderate negative linear relationship between the ANU-ADRI and MMSE scores (P<0.001), indicating that the higher the MMSE score, the lower the ANU-ADRI score (less risk for devel-oping Alzheimer’s disease). Spearman’s correlation between the two scores was rs= –0.350 (P<0.001).
DISCUSSION
Strengths of this study were that the investigation included more risk factors for AD and a younger sample compared to other validation studies with samples of older adults performed in the USA and Europe. The participants were assessed by general practitioners and specialists, thus the utility of the instrument was evaluated in two settings (Primary or Secondary Care). Hence, this instrument can be used by clinicians in different settings.
The present study has several limitations. First, the samples were selected by convenience and may have been affected by selection bias in their initial recruit-ment. There was also the possibility that the risk scores were influenced by residual confounding. This limita-tion applies to other risk indices in the literature.23
Sec-ond, it is important to know the particularities of the sample considering the fact that respondents’ gender, age group, and level of education could have influenced the performance of the instrument. Comparing to those assessed in the other two international samples with higher educational levels (Rush Memory and Aging Study baseline age >53, and Cardiovascular Health Cog-5% of observations were outside the agreement limits of 9Cog-5% (–7.1; 9.6). Mean difference
observed was 1.2 (Standard Deviation=4.3); Mean scores range was –12 to 46.
Figure 3. Bland-Altman plot for the two measurements of the ANU-ADRI . Figure 4. Box – Plot of the ANU-ADRI by groups (A and B).
nition Study >65),24 the present sample (two groups of
individuals with lower mean age and education) had higher risk scores indicating a relatively higher risk of dementia. No comparison was made with the Kungshol-men Project24 (third cohort validated sample), which
included participants older than 75 years and with het-erogeneous level of education.
Lastly, the studies mentioned validated the ANU-ADRI in samples that were followed over time, where they were able to assess the incidence of dementia in the cohort being studied. In the present study, the authors used a construct validation, imposing significant limita-tions when compared to a cohort followed-up over time. The main limitation of this study is the use of only one screening tool (MMSE) to ensure cognitively normal participants.
A randomized, controlled study including a sample of middle-aged adults (mean age=55 years) with a high educational level (mean education=18 years) revealed a lower mean ANU-ADRI score (–1.38) than that found in the present samples (6.2 and 11).43 The author of the
study suggested that the ANU-ADRI should be tested
in “a target sample with lower levels of education and higher ANU-ADRI scores”.
In conclusion, the Brazilian Portuguese version of the ANU-ADRI is a reliable and valid instrument. Lower levels of education were associated with higher ANU-ADRI scores (participants at higher risk for AD) in the Brazilian population. Future research should evaluate the validity of the ANU-ADRI in large population-based samples in order to improve the effect size of validation in different contexts.
Author contributions. All authors contributed
signifi-cantly to, and approved, the content of this manuscript.
Acknowledgements. We are grateful to the researchers
at the Centre for Research on Ageing, Health and Well-being (CRAHW) of the Australian National University (ANU) for their cooperation and, in particular, to the scientist, Dr. Kaarin J. Anstey, for granting permission to use the ANU-ADRI. Also, thanks are extended to the students (Paluch GD, Soares K, Ramos MJF, Adriazola RN, Ramalho V), who assisted in the data collection.
S1 Table. ANU-ADRI items and scoring (Adapted by Anstey et al.).24
• Age e gender (Male <65 = 0; Female <65 = 0) • Education (>11 = 0; 8 to 11 = 3; <8 = 6)
• BMI (Normal = 0; Overweight = 2; Obese = 5) • High cholesterol (No = 0; Yes = 3)
• Diabetes (No = 0; Yes = 3) • TBI (No = 0; Yes = 4)
• Depression (CES-D<16 = 0; CES-D>16 = 2) • Physical activity (Mild = 0; moderate = –2; vigorous = –3)
• Cognitive activities (Low = 0; moderate = –7; high = –6) • Social engagement (low = 6; low to moderate = 4;
moderate to high = 1; high = 0)
• Fish intake (0 to 0.25 = 0; 0.26 to 2 = –3; 2.1 to 4 = –4; ≥4.1 = –5) • Alcohol consumption (None = 0; light to moderate = –3)
• Smoking (Current = 4; Past = 1; Never = 0) • Pesticide Exposure (No = 0; Yes = 2)
S2 Table. The relationship between ANU-ADRI Test with Retest and MMSE.
ANU-ADRI Test
N
ANU-ADRI Retest
N
MMSE
N Pearson
correlation
Sig. (2-tailed)
Pearson correlation
Sig. (2-tailed)
Pearson correlation
Sig. (2-tailed)
ANU-ADRI Test 1 100 0.918* 0.000 100 –0.353* 0.000 100
ANU-ADRI Retest 0.918* 0.000 100 1 100 –0.314* 0.001 100
MMSE –0.353* 0.000 100 –0.314* 0.001 100 1 100
REFERENCES
1. Alzheimer’s Disease International. The Global Impact of Dementia 2013-2050: Policy Brief for Heads of Government. 2013. http://alz.co.uk/ research/GlobalImpactDementia2013.pdf
2. Sindi S, Mangialasche F, Kivipelto M. Advances in the prevention of Alzheimer’s Disease. F1000Prime Rep. 2015;12:7-50.
3. Baumgart M, Snyder HM, Carrillo MC, Fazio S, Kim H, Johns H. Summary of the evidence on modifiable risk factors for cognitive decline and dementia: A population- based perspective. Alzheimers Dement. 2015;11(6):718-26.
4. Lopes OL, Becker JT, Kuller LH. Patterns of compensation and vulner-ability in normal subjects at risk of Alzheimer’s disease. J Alzheimers Dis. 2013;33(Suppl 1):S427-38.
5. Seshadri S, Fitzpatrick AL, Ikram MA, DeStefano AL, Gudnason V, Boada M, et al. Genome-wide analysis of genetic loci associated with Alzheimer disease. JAMA. 2010;303:1832-40.
6. Kotze MJ, van Rensburg SJ. Pathology supported genetic testing and treatment of cardiovascular disease in middle age for prevention of Alzheimer’s disease. Metab Brain Dis. 2012;27(3):255-66.
7. Povova J, Ambroz P, Bar M, Pavukova V, Sery O, Tomaskova H, Janout V. Epidemiological of and risk factors for Alzheimer’s disease: a review. Biomed Pap Med Fac Univ Palacky Olomouc Czech Repub. 2012; 156(2):108-14.
8. Deckers K, van Boxtel MP, Schiepers OJ, de Vugt M, Muñoz Sánchez JL, Anstey KJ, et al. Target risk factors for dementia prevention: a systematic review and Delphi Consensus study on the evidence from observational studies. Int J Geriatr Psychiatry. 2015;30(3):234-46. 9. Polidori MC, Pientka L, Mecocci P. A review of the major vascular risk
factors related to Alzheimer’s disease. J Alzheimers Dis. 2012;32(3): 521-30.
10. Williams JW, Plassman BL, Burke J, Benjamin S. Preventing Alzheim-er’s disease and cognitive decline. Evid Rep Technol Assess (Full Rep). 2010;(193):1-727.
11. Qiu C. Preventing Alzheimer’s disease by targeting vascular risk factors: hope and gap. J Alzheimers Dis. 2012;32(3):721-31.
12. Solomon A, Kivipelto M, Soininen H. Prevention of Alzheimer’s disease: moving backward through the lifespan. J Alzheimers Dis. 2013;33 Suppl 1:S465-9.
13. Prince M, Acosta D, Ferri CP, Guerra M, Huang Y, Guerra M, Huang Y, Llibre Rodriguez JJ, et al. Dementia incidence and mortality in middle-income countries, and associations with indicators of cognitive reserve: a 10/66 Dementia Research Group population-based cohort study. Lancet. 2012;380(9836):50-8.
14. Barnes DE, Yaffe K. The projected effect of risk factor reduction on Alzheimer’s disease prevalence. Lancet Neurol. 2011;10(9):819-28. 15. Daviglus ML, Plassman BL, Pirzada A, Bell CC, Bowen PE, Burke JR, et
al. Risk factors and preventive interventions for Alzheimer disease: state of the science. Arch Neurol. 2011;68(9):1185-90.
16. Norton S, Mattheus FE, Barnes DE, Yaffe K, Brayne C. Potencial for primary prevention of Alzheimer’s disease: an analyses of population-based data. Lancet Neurol. 2014;13(8):788-94.
17. Larson EB. Prospects for delaying the rising tide of worldwide, late-life dementias. Int Psychogeriatr. 2010;22(8):1196-202.
18. Stern Y. Cognitive reserve in ageing and Alzheimer’s disease. Lancet Neurol. 2012;11:1006-12.
19. Song X, Mitnitski A, Rockwood K. Nontraditional risk factors combine to predict Alzheimer disease and dementia. Neurology. 2011;77(3):227-34. 20. Solfrizzi V, Panza F, Frisardi V, Seripa D, Logroscino G. Diet and
Alzheim-er’s disease risk factors or prevention: the current evidence. Expert Rev Neurother. 2011;11(5):677-708.
21. Solfrizzi V, Frisardi V, Seripa D, Logroscino G, Imbimbo BP. Mediter-ranean diet in predementia and dementia syndromes. Curr Alzheimer Res. 2011;8(5):520-42.
22. Stephan BCM, Kurth T, Matthews FE, Brayne C, Dufouil C. Dementia risk prediction in the population: are screening models accurate? Nat Rev Neurol. 2010;6(6):318-26.
23. Tang EY, Harrison SL, Errington L. Current Developments in Dementia Risk Prediction Modelling: An Updated Systematic Review. PLoS One. 2015;10(9):e0136181.
24. Anstey KJ, Cherbuin N, Herath PM, Qiu C, Kuller LH, Lopez OL, et al. A self-report risk index to predict occurrence of dementia in three independent cohorts of older adults: the ANU-ADRI. PLoS One. 2014; 9(1):e86141.
25. Kivipelto M, Ngandu T, Laatikainen T, Winblad B, Soininen H, Tuomilehto J. Risk score for the prediction of dementia risk in 20 years among middle aged people: A longitudinal, population-based study. Lancet Neurology. 2006;5:735-41.
26. Barnes DE, Covinsky KE, Whitmer RA, Kuller LH, Lopez OL, Yaffe K. Predicting risk of dementia in older adults: The late-life dementia risk index. Neurology. 2009;73:173-79.
27. Barnes DE, Beiser AS, Lee A, Langa KM, Koyama A, Preis SR, et al. Development and validation of a brief dementia screening indicator for primary care. Alzheimer Dement. 2014;10(6):656-65.
28. Anstey, KJ, Cherbuin, N, Herath, PM. Development of a new method for assessing global risk of Alzheimer’s Disease for use in population health approaches to prevention. Prev Sci. 2013;14: 411-21.
29. Satizabal CL, Beiser AS, Chouraki V, Chêne G, Dufouil C, Seshadri S. Incidence of Dementia over Three Decades in the Framingham Heart Study. N Engl J Med. 2016;374(6):523-32.
30. Chary E, Pérès K, Orgogozo JM, Dartigues JF, Jacqmin-Gadda H. Short- versus long-term prediction of dementia among subjects with low and high educational levels. Alzheimers Dementia. 2013;9(5):562-71. 31. Diagnostic and statistical manual of mental disorders: DSM-V, 5th ed.
Washington, DC: American Psychiatry Association; 2013.
32. Folstein MF, Folstein SE, McHugh PR. “Mini-mental state”. A practical method for grading the cognitive state of patients for the clinician. J Psychiatr Res 1975;12(3):189-98.
33. Brucki SMD, Nitrini R, Bertolucci PHF, Caramelli P, Okamoto IH. Sugestões para o uso do Mini-Exame do Estado Mental no Brasil. Arq Neuropsiquiatr 2003;61:777-81.
34. Reichenheim ME, Moraes CL. Operationalizing the cross-cultural adapta-tion of epidemiological measurement instruments. Rev Saude Publica. 2007;41(4):665-73.
35. Borges MK, Jacinto AF, Citero VA. Cross-cultural adaptation of the “Australian National University Alzheimer’s Disease Risk Index” for the Brazilian population. Dement Neuropsychol. 2017;11(2):162-75. 36. Machin D, Campbell M, Fayers P, Pinol A. Sample Size Tables for Clinical
Studies, 2nd Edition. Blackwell Science; 1997.
37. Strout PE. Measurement reliability and agreement in psychiatry. Sta. Methods Med. Res. 1998;7(3):301-17.
38. Walter SD, Eliasziw M, Donner A. Sample size and optimal designs for reliability studies. Stat Med. 1998;17:101-10.
39. Bland JM, Altman DG. Statistical methods for assessing agreement between two methods of clinical measurement. Lancet. 1986;1(8476): 307-10. 40. Gifford DR, Cummings JL. Evaluating dementia screening tests: Method-ologic standards to rate their performance. Neurology. 1999;52(2):224-7. 41. Ngandu T, von Strauss E, Helkala EL, Winblad B, Nissinem A, Tuomilehto
J, et al. Education and dementia: what lies behind the association? Neurology 2007;69(14):1442-50.
42. Cohen J. Statistical power analysis for the behavioral sciences. 2nd ed. New Jersey: Lawrence Erlbaum Associates; 1988.