Vol.61: e18160728, 2018 http://dx.doi.org/10.1590/1678-4324-2017160728 ISSN 1678-4324 Online Edition
BRAZILIAN ARCHIVES OF BIOLOGY AND TECHNOLOGY
A N I N T E R N A T I O N A L J O U R N A L
Polyphenols From Cutch Tree (
Acacia catechu
Willd.):
Normalize
In
Vitro
Oxidative
Stress
and
Exerts
Antiproliferative Activity
Rakesh Kumar
1,2
*, Rohit Arora
1
, Jyoti Mahajan
1
, Sonia Mahey
1
, Saroj Arora
1
.
1
Guru Nanak Dev University - Department of Botanical and Environmental Sciences, Amritsar, Punjab, India; 2
DAV University - Department of Botany, Jalandhar, Punjab, India.
ABSTRACT
Oxidative stress, being the main cause of most of the human diseases, has always been the highlight of research worldwide. This stress can be overcome by administration of natural polyphenols. The Acacia catechu Willd. has many refrences available in Ayurveda as important disease curative plant. Its leaves are investigated for ameliorating oxidative stress in present work. Leaves of A. catechu were extracted with 80% methanol to get methanol extract (AME). It was assessed for antioxidant activity using DPPH, ABTS, CUPRAC, ferric ion reducing, superoxide scavenging and peroxyl radical scavenging assays. DNA protective activity was also investigated using plasmid nicking assay. Further, antiproliferative activity was determined using MTT assay in various human cancer cell lines. The quantification of polyphenols was done by UHPLC analysis. Results confirmed that polyphenols of A. catechu were successful in normalizing oxidative stress. AME was found to be most effective in scavenging ABTS radicals while least effective in scavenging ferric ions. UHPLC analysis showed abundance of ellagic acid, rutin and quercetin in AME. Further, AME showed maximum antiproliferative activity against Hep G2 cancer cells. It is concluded that the polyphenols from A. catechu effectively remediates oxidative stress and hence can be used in curing numerous dreadful diseases.
Key words: Acacia catechu, antioxidant, antiproliferative, UHPLC, MTT.
*
2 Kumar, R et al.
INTRODUCTION
Chemotherapeutic drugs have got a wide acceptance over the globe in being the remedial measure for most of the dreadful diseases, yet the side effects associated with them have vindicated the heed of people in traditional medicinal systems [1, 2, 3,
4
]. Medicinal plants contain a wide range of substantive bioactive components like polyphenols, tannins, alkaloids, terpenes, anthocyanidins and vitamins which exert astounding health benefits by acting as reducing agents and detoxifying free radicals [5, 6, 7]. It is now well established that making medicinal plants a regular part of everyday diet subverts the harmful effects of free radicals and immensely decreases the chances of getting diseases like cardiovascular, neurodegenerative, cancer,
arteriosclerosis and parkinson [8, 9].
Acacia catechu Willd. (Family: Mimosaceae) also known as khadira, khair, karingali and kattha is an important medicinal plant found in relatively drier regions of India like Punjab, Rajasthan, Uttar Pradesh, Bihar, Madhya Pradesh, Orissa and Andhra Pradesh [10,11]. There are umpteen references available in Ayurveda projecting it as a valuable tree having numerous medicinal properties. Its antipyretic, antidiarrhoel, hepatoprotective and hypoglycemic properties have been reported [12]. Many polyphenols like catechin, rutin, isorhamnetin and epicatechin have been isolated which could be the reason for its varied medicinal value [11, 13].
In the present study, we evaluated leaf methanolic extract of Acacia catechu Willd. (AME) for its antioxidant, antiproliferative and DNA protective activities. Earlier, the aqueous extract of A. catechu has been studied and reported to be an excellent
source of polyphenolic compounds [14].
MATERIALS AND METHODS
Chemicals
All the chemicals used were of analytical grade.
Preparation of extract
The leaves of Acacia catechu Willd. were harvested in the month of June from tree growing in the Guru Nanak Dev University campus, Amritsar. Taxonomic identification was made by Herbarium of Department of Botanical and Environmental Sciences, GNDU, Amritsar and representative voucher specimen was also submitted with accession number: 7240 in the herbarium. The leaves of plant were thoroughly washed with tap water, dried at room temperature and ground to fine powder. The powdered leaves were extracted with 80% methanol (thrice) by employing maceration method. The supernatant was filtered using Whatman No. 1 sheet, pooled and concentrated using vacuum rotary evaporator (Buchi Rotavapor R-210). The concentrated solutions were then lyophilized to get the dry form of methanol extract of A. catechu (AME).
Phytochemical Analysis
Total Phenol and Flavonoid Content
Total phenolic content of methanol extract was measured colorimetrically by employing method given by Ainsworth and Gillespie [15]. The amount of total phenol was calculated as mg/g Gallic Acid equivalents from calibration curve of standard solution of gallic acid. Total flavonoid content was measured using method of Kim et al [16] and rutin was used as standard. The flavonoid content was expressed as mg/g rutin equivalents.
UHPLC analysis
For UHPLC analysis sample was dissolved in methanol (HPLC grade) and filtered through 0.22 µm syringe filter (PALL Life Sciences). Sample was analyzed on Shimadzu UHPLC Nexera system (Shimadzu, MA, USA), provided with a
photodiode array (PDA) detector. An Enable C18 column (150 mm x 4.6 mm, i.d. 5 µm) was used. The column temperature was maintained at 25 °C. Samples were separated using a gradient mobile phase consisting of 0.1% acetic acid aqueous as solution A and Methanol as solution B. The gradient elution is: 0-1 min, 30 % B; 1-10 min, 65 % B; 1-10-14 min, 80 % B; 14-16 min, 80 % A, 16-17 min: 40 % B, 17-20 min: 35 % B and 20-21 min: 30 % B. The flow rate was set as 1 ml/min and the injection volume was 5 μl. Quantification of peaks was also done using software provided with Shimadzu UHPLC Nexera system.
In Vitro Antioxidant assays
Molybdate ion reduction assay
The ability of AME to reduce molybdate ion was determined by the method of Prieto
et al. [17]. This method is based on the principle of reduction of Mo (VI) to Mo (V) which led to the appearance of green coloured phosphate/Mo (V) complex at acidic pH. 0.3 ml of MEL (100µg/ml) was mixed with 3 ml of reagent solution (0.6 M sulphuric acid, 28 mM sodium phosphate and 4 mM ammonium molybdate). Reaction mixture was given incubation of 90 minutes at 95ºC. The mixture was allowed to cool at room temperature and absorbance was measured at 695 nm. Ascorbic acid was used as standard compound for developing regression equation. Reduction potential of extract/fraction was expressed as mg ascorbic acid equivalents (AAE)/ gram dry weight of AME.
ABTS radical cation decolorization assay
ABTS radical decolorization assay was carried out according to the method of Re et al., [18]. This method exploits the hydrogen donating capacity of both lipophilic as well as hydrophilic compounds. Here oxidation of ABTS (7 mM), brought about by potassium persulphate (2.45 mM), generates a blue/green coloured cationic ABTS.+ radical after 12-16 hours of coincubation. The final absorbance of radical, thus generated in solution form, was fixed at 0.700 ± 0.02 by dilution with ethanol. Hydrogen donating potential of extract was determined by addition of 0.1 ml of extract in 1.9 ml of ABTS.+ radical solution and measuring the absorbance at 734 nm wavelength spectrophotometrically (Systronics 2202 UV-Vis spectrophotometer).
Blanks containing only ABTS.+ solution were kept for each concentration of extract for checking any radical decay. Gallic acid was used as standard. All determinations were carried out in triplicates. Percentage radical scavenging activity was calculated using formula (1-As/Ac) × 100; As = Absorbance of reaction mixture and Ac =
Absorbance of ABTS.+ radical solution.
DPPH radical scavenging assay
DPPH radical scavenging activity was carried out by the method of Blois [19] with slight modifications. In this assay, 0.2 ml of AME was mixed with 3 ml of 0.1 mM DPPH (2,
2’ -Diphenyl -1-picrylhydrazyl) solution. After 30 minutes, absorbance was taken at 517 nm using Systronics 2202 UV-VIS spectrophotometer. The control was prepared without any test compound. Gallic acid was used as phenolic standard. All
tests were performed in triplicates. Radical scavenging activity (%) = (Ac - As/ Ac) × 100; where Ac is the absorbance of control and As is the absorbance of reaction mixture.
4 Kumar, R et al.
Cupric ion reducing power (CUPRAC) assay
The cupric ion (Cu2+) reducing power was determined by the method proposed by Apak et al. [20] with minor modifications. To a mixture of 0.25 ml of 10 mM copper (II) chloride, 0.25 ml of 7.5 mM neocuproine solution and 0.25 ml of 1.0 M ammonium acetate buffer solution was added 0.25 ml of different concentrations (20-200 μg/ml) of AME. The final volume was made up to 2 mL with distilled water. The reaction mixture was kept at room temperature for 30 min and absorbance was measured at 450 nm (Systronics 2202 UV-VIS spectrophotometer). All readings were taken in triplicates. Ascorbic acid was used as standard compound. Percentage reduction was calculated using formula [1 - (1 - As/Ac) ×100] where As = absorbance of standard at maximum concentration tested. Ac = absorbance of test sample.
Ferric ion reducing power assay
The reducing potential of extract was determined using the method of Oyaizu [21]. Different concentrations (20-200 µg/ml) of AME were dissolved in methanol and taken in test tubes in triplicates. To the test tubes, 2.5 ml of phosphate buffer (pH 6.6, 0.2M) and 2.5 ml of 1% potassium ferricyanide solution was added. These contents were incubated at 50˚C for 20 minutes. After incubation, 2.5 ml of 10% Trichloroacetic acid was added and kept for centrifugation at 3000 rpm for 10 minutes. After centrifugation, 2.5 ml of supernatant was taken and to it added 2.5 ml of double distilled water and 0.5ml of 0.1% ferric chloride. The absorbance was measured at 700 nm using Systronics 2202 UV-VIS spectrophotometer. The percentage reduction of the test sample, as compared to standard gallic acid, was calculated using the formula: Percentage (%) of reduction power = [1 - (1 - As/Ac) ×100] where As = absorbance of standard at maximum concentration tested. Ac = absorbance of test sample.
Superoxide anion scavenging assay
The superoxide anion scavenging potential was assessed by the method of Nishikimi
et al. [22] with slight modifications. To 1 ml of sample, taken in triplicates, was added 60 µM NBT, 156 µM NADH and 468 µM phenazine methosulphate (PMS). The reaction mixture was incubated at room temperature for 15 min and absorbance of blue coloured product was measured at 560 nm. The percentage inhibition was calculated as (1-AS/AC) × 100 and the results were compared with gallic acid used as standard.
Lipid peroxidation assay
The amount of lipid peroxidation was determined by the method of Ohkawa et al.
[23]. Reaction was initiated by adding 0.5 ml of different concentration (20-200 µg/ml) of AME to same amount of egg yolk diluted by 0.15 M KCl followed by addition of reaction mixture (Tris HCl, Ferrous Ammonium Sulphate, Ascorbic acid). Later was incubated at 37ºC for 30 minutes. After incubation 2 ml of TBA reagent was added and mixture was heated to 80ºC for an hour. The reaction was stopped immediately by cooling at 0-10ºC. Centrifugation was done to get a clear solution and the absorption was read at 532 nm. The percentage inhibition of lipid peroxidation was calculated as (1-AC/AS) × 100; AC = Absorbance of control and AS = Absorbance of sample.
DNA nicking assay
This assay is based on the principle that hydroxyl radicals generated as a result of Fenton’s chemistry cause DNA damage. The addition of sample protects DNA from damage by scavenging hydroxyl radicals as seen on gel by employing agarose gel
electrophoresis. DNA protection assay was performed using supercoiled pBR322
plasmid DNA with slight modifications [24]. Plasmid DNA (0.3 µl) was incubated with 30 mM H2O2, 50 µM ascorbic acid and 80 µM FeCl3 containing AME
concentrations (200 to 1000 µg/ml) and finally the volume of the mixture was raised up to 20 µl. The mixture was then incubated for 30 min at 37°C followed by addition of loading dye and electrophoresis was carried out in TAE buffer (40 mM Tris base, 16 mM acetic acid, 1 mM EDTA, pH 8.0). DNA was then visualized by ethidium bromide staining. Rutin (200 µg/ml) was used as positive control. Further, the densitometric studies were carried out on DNA bands using Quantity one® software version 4.5.2 of BIO-RAD.
3-(4,5-Dimethylthiazol-2-yl)-2,5-diphenyltetrazolium bromide (MTT) assay
MTT assay was performed using the method of Mossman et al. [25]. IMR32 cell were grown in RPMI (with 2 mM glutamine supplemented with 10% FBS) while A549, Hep-G2, HeLa and MCF-7 were grown in tissue culture flask in complete growth medium DMEM (Dulbeco’s modified growth medium with 2 mM glutamine supplemented with 10% FBS) at 37 °C in an atmosphere of 5% CO2 and 95% relative humidity. The cells were harvested from the culture flask at subconfluent stage by treating with trypsin. Cells viability was checked by trypan blue exclusion
dye before starting assay. Cells were placed in 96-well culture plates (5 × 10³cells per well) and grown overnight at 37°C in a 5% CO2 incubator. 0.1 ml of AME concentration i.e., 10, 30 and 100 µg/ml were added to individual well. Control wells were also prepared by addition of culture medium alone. The plates were incubated at 37° C in a 5% CO2 incubator for 24 hour. Upon completion of the incubation, MTT dye solution was added to each well. After 4 hours of incubation, cells were solubilised with isopropanol to get soluble formazan crystals. These plates were then read on ELISA plate reader at 570 nm. All the treatments were given in triplicates.
Statistical Analysis
All the measurements were taken in triplicates and presented as mean. The results of various in vitro antioxidant models were correlated by applying Pearson correlation coefficient (table 1 and 2) using SPSS software (version 11.5, SPSS Inc., Chicago, IL, USA).
Table1. Total Phenol Content (TPC), Total Flavonoid Content (TFC) and Molybdate ion reduction ability of AME.
Total Phenol Content Total Flavonoid Content Molybdate Ion Reduction Ability
(mg GAE/g dry weight) (mg RE/g dry weight) (mg AAE/g dry weight)
776 420 470
Table 2. Percentage of polyphenolic compounds in AME as detected by UHPLC.
Phenolic compounds Concentration (%)
Ellagic acid 0.706
Rutin 0.682
Quercetin 0.356
Gallic acid 0.205
Catechin 0.159
Chlorogenic acid 0.149
Umbelliferone 0.131
Kaempferol 0.056
Epicatechin 0.012
Coumaric acid 0.008
Caffeic acid 0.001
6 Kumar, R et al.
RESULTS
Phytochemical analysis
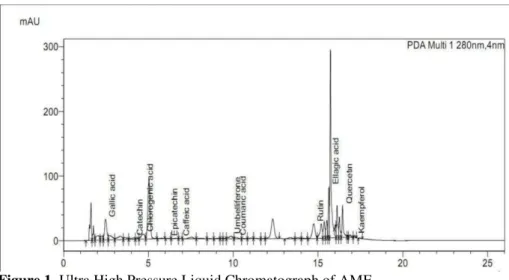
Total phenol and flavonoid content in AME was found to be 776 mg/g gallic acid equivalents and 420 mg/g rutin equivalents respectively (table 1). UHPLC analysis showed plethora of polyphenolic compounds (table 2). Major compounds present in AME were ellagic acid, rutin and quercetin. Other polyphenols detected in minor amounts were gallic acid, catechin, chlorogenic acid, umbelliferone, kaempferol, epicatechin, coumaric acid and caffeic acid (figure 1).
Figure 1. Ultra High Pressure Liquid Chromatograph of AME.
AME reduced molybdate ion
The reduction ability of molybdate ions by AME was expressed in terms of Ascorbic acid equivalents. AME was found to contain 470 mg /g Ascorbic Acid equivalents (table 1).
AME showed potent hydrogen donating ability
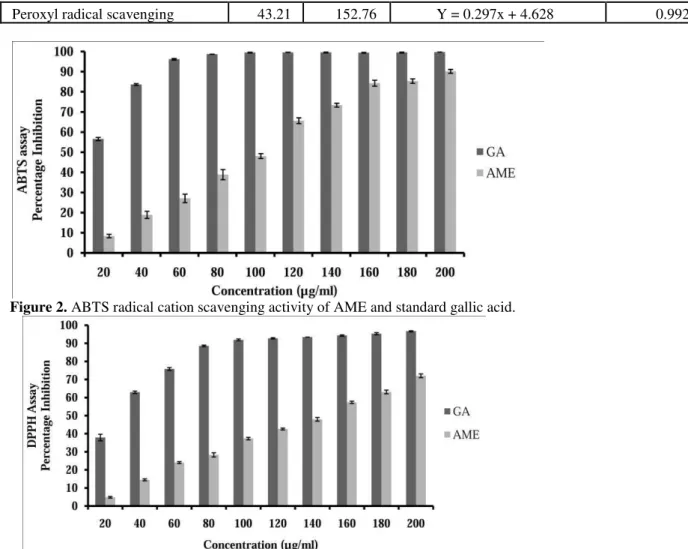
Hydrogen donating potential of AME was investigated against ABTS and DPPH radicals. As depicted in figure 2, AME showed potent hydrogen donating capability with ABTS radical cation scavenging potential of 90.18 ± 0.950 percent at maximum tested concentration of 200 µg/ml. The IC50 value of AME was found to be 101.74 µg/ml (table 3). Gallic acid (GA) was used as standard compound which showed IC50 value of 6.53 µg/ml. A comparative analysis of DPPH radical scavenging
activity of AME with standard GA is compiled in figure 3. A maximum 72.04 ± 1.057 percent DPPH scavenging potential was observed at concentration of 200 µg/ml while GA showed 96.62 ± 0.316 percent inhibition at 200 µg/ml. The IC50
value of AME and GA was observed to be 140.41 µg/ml and 24.04 µg/ml respectively (table 3).
Table 3. The IC50value (µg/ml), regression equation and R2value in variousin vitroantioxidant assays.
Antioxidant Assay IC50 (µg/ml) Regression equation R2
GA AME
ABTS 6.53 101.74 Y = 0.487x – 0.450 0.977
DPPH 24.04 140.41 Y = 0.356x + 0.012 0.995
CUPRAC 88.14 184.30 Y = 0.305x – 6.214 0.986
Ferric reducing power 51.36 232.13 Y = 0.228x – 2.926 0.990
Superoxide scavenging 24.45 175.90 Y = 0.283x + 0.218 0.991
Peroxyl radical scavenging 43.21 152.76 Y = 0.297x + 4.628 0.992
Figure 2. ABTS radical cation scavenging activity of AME and standard gallic acid.
Figure 3. DPPH radical scavenging activity of AME and standard gallic acid.
AME acted as reducing agent
In vitro generated Cu2+chelate and ferricyanide were used to assess the reduction ability of AME. At highest tested concentration of 200 µg/ml AME showed
maximum percentage Cu2+ reduction potential of 57.87 ± 1.256 in CUPRAC assay (figure 4). GA and AME showed IC50 value of 88.14 µg/ml and 184.30 µg/ml (table 3)respectively. Figure 5 depicts the ferric ion reduction potential of AME and gallic acid. AME showed maximum reduction potential of 44.31 ± 2.802 percent at 200 µg/ml concentration. The IC50 value of AME and GA was found to be 232.13 µg/ml and 51.36 µg/ml respectively (table 3).
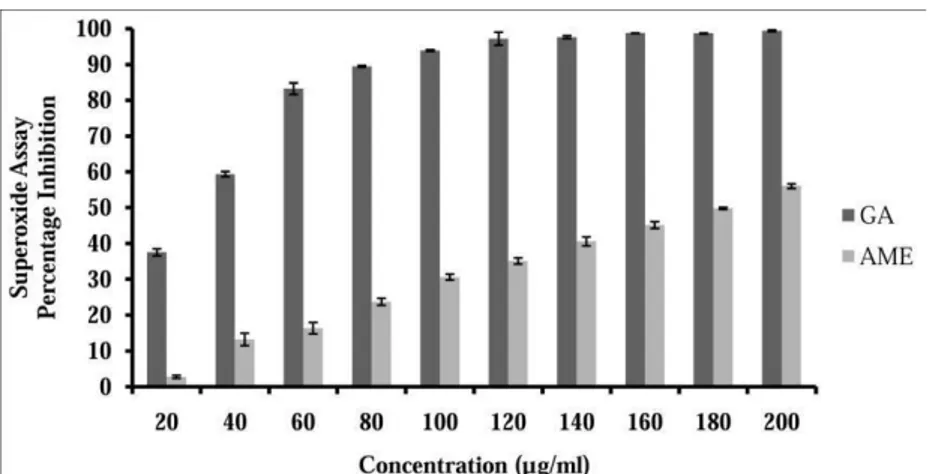
3.4. AME scavenged superoxide and peroxyl radicals
Superoxide scavenging potential of AME and GA is compiled in figure 6. AME and GA have shown superoxide anion scavenging potential of 56.04 ± 0.647 percent and 99.38 ± 0.257 percent at concentration of 200 µg/ml respectively. AME showed IC50
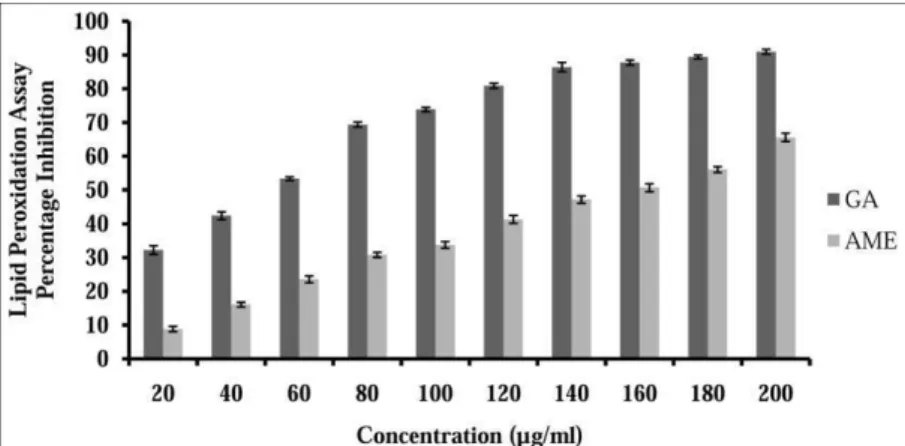
value of 175.90 µg/ml. As shown in figure 7, AME exerted potent peroxyl radical scavenging ability with 65.61 ± 1.249 percent scavenging potential while standard GA showed 90.99 ± 0.730 percent scavenging potential at 200 µg/ml concentration. AME showed IC50 value of 152.76 µg/ml (table 3).
8 Kumar, R et al.
Figure 4. Cupric ion (Cu2+) reducing activity of AME and standard gallic acid.
Figure 5. Ferric ion reducing potential of AME ofA.catechuleaves and standard gallic acid.
Figure 6. Superoxide radical scavenging potential of AME and standard gallic acid.
Figure 7. Peroxyl radical scavenging activity of AME and standard gallic acid.
AME protected plasmid DNA
The DNA protective potential of AME was evaluated using pBR322 supercoiled plasmid DNA (figure 8). Densitometric analyses revealed a dose dependent DNA protective activity of AME against hydroxyl radicals generated by fenton’s reaction. A dose dependent response was observed with maximum quantity of 77.09 % of Form (I) DNA at 1000 µg/ml concentration while 57.86 % at 200 mg/ml concentration. Positive control rutin showed 80.32 % of Form (I) DNA, 19.68 % of Form (II) DNA. Lane with fenton’s reagent showed very less amount of 07.83 % of Form (I) DNA, 75.03 % of Form (II) DNA and 17.14 % of Form (III) DNA. Thus, from densitometric analysis it was observed that AME at all the concentrations protected the supercoiled DNA by scavenging hydroxyl radicals.
Figure 8. DNA protective potential of AME in plasmid nicking assay.
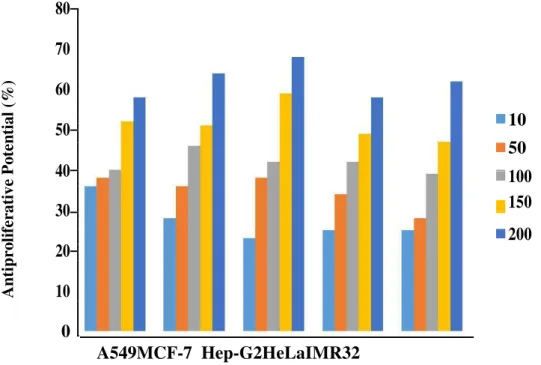
AME induced cell death in cancer cells
Figure 9 compiles the differential antiproliferative activity of AME towards various cancer cell lines. It was observed that AME induced death in all the cancer cells but maximum antiproliferative activity was observed in Hep-G2 cancer cells. AME showed antiproliferative activity of 58%, 64%, 68%, 58% and 62% in A-549, MCF-7, Hep-G2, HeLa and IMR32 respectively at dose of 200µg/ml. Camptothecin
10 Kumar, R et al.
(10µM) was used as standard compound and it showed maximum antiproliferative activity of 83% against Hep-G2 cell line.
A nti pro li fer at ive Po ten ti a l ( % )
80
70
60
50
10
50
40
100
30
150
200
20
10
0
A549MCF-7 Hep-G2HeLaIMR32
Figure 9. Antiproliferative activity of AME concentration (ug/ml) against different cancer cell lines.
DISCUSSION
Present study was undertaken to investigate the antioxidant, DNA protective and antiproliferative potential of leaf methanol extract of A. catechu Willd. The rationale for choosing crude extract of the plant was to study the synergistic effect of various polyphenols present in AME. The polar constituents of the leaves were extracted using 80% methanol to facilitate the extraction of polyphenolic components of the plant. The high polyphenolic and flavonoid content of the plant extract points
towards its importance in naturopathy [26, 27]. Some important secondary metabolites with highly recognized biological properties were identified using UHPLC. Among these, ellagic acid, rutin and quercetin were found to be major polyphenolic compounds. The antioxidant and anticancer properties of these
compounds have been well established [28, 29, 30, 31, 32]. The high level of protective activities imparted by these compounds serves as an evidence for the importance of AME extract in ameliorating the oxidative stress.
The presence of essential phytochemicals in the AME extract formed the basis for investigating its antioxidant properties. The leaf extract showed high molybdate ion reduction ability thus indicating its ability to reduce Mo (VI)-phosphate to Mo
(V)-phosphate [33]. This preliminary study suggested the high antioxidant capacity of AME. Further studies were carried to detect the ability of AME to ameliorate specific free radicals. The extract was found to have a high hydrogen donating potential as observed in ABTS and DPPH assays. A positive correlation was found between ABTS and DPPH assays. The extract thus acts as an excellent hydrogen donor to stabilize the free radicals [34]. This ability was further tested by employing other in vitro reducing assays. The phytochemicals are known to stabilize free
radicals by acting as reducing agents. AME successfully reduced Fe3+ to Fe2+ and
Cu2+ to Cu+ in ferric and cupric ion reducing power assays. These assays suggest the
possible conversion of highly reactive free radicals to lesser reactive reductones [34]. It has been well documented in literature that extracts behaving as good reducing agents are excellent antioxidants as they donate electrons to free radicals and
terminate the radical propagation reaction [35].
The superoxide radical scavenging assay aims towards analyzing the superoxide scavenging ability of the extract. The superoxide radicals are comparatively less toxic but are highly reactive and leads to a series of chain reactions thus generating very toxic radicals via Haber Weiss reaction [36]. The peroxyl radicals indirectly
generated by superoxide radicals are among the most harmful free radicals [37]. These radicals lead to a serious damage to cellular integrity by causing peroxidation
of lipid membrane [38]. A positive correlation was observed in all the antioxidant assays (table 4). The hydroxyl radical scavenging ability of AME was further investigated using plasmid DNA protecting assay. This assay provides an insight towards the ability of our extract to protect the plasmid DNA from Fenton’s reagent generated hydroxyl radical stress. It was observed that the AME imparted a dose dependent protection against in vitro generated hydroxyl radicals as evident from the reduced amount of damaged supercoiled DNA (form II & III). The amount of form I or supercoiled DNA observed using densitometric analysis was found at par with positive control rutin. The high phenol content of the extract might be responsible for its DNA protecting activity [39].
The antiproliferative ability of AME was studied using MTT assay. This assay exploits the ability of extract to convert the yellow colored MTT dye into blue colored formazan crystals by the succinate dehydrogenase enzyme of living cells
[40]. The active test samples check the in vitro proliferation of cancer cells and concomitantly induces death via apoptosis or necrosis. The dead cells are unable to convert yellow coloured MTT dye to blue formazan, while the living cells can catalyze this conversion. A high antiproliferative activity was seen following the treatment with AME. The decreasing order of antiproliferative activity in different cell lines was found as Hep-G2 > MCF-7 > IMR32 > HeLa = A549. A similar result was observed in studies conducted by Sreejamole and Radhakrishnan [41]. They found phenols, flavonoids and alkaloids as prime factors responsible for such antiproliferative activity.
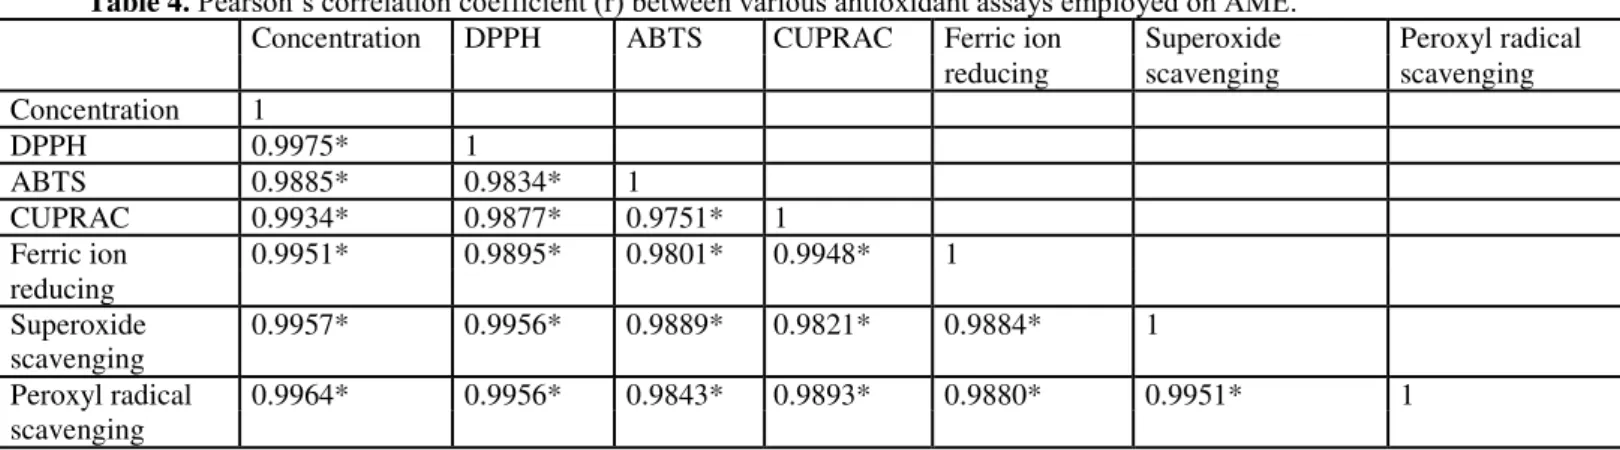
Table 4. Pearson’s correlation coefficient (r) between various antioxidant assays employed on AME.
Concentration DPPH ABTS CUPRAC Ferric ion Superoxide Peroxyl radical reducing scavenging scavenging Concentration 1
DPPH 0.9975* 1
ABTS 0.9885* 0.9834* 1
CUPRAC 0.9934* 0.9877* 0.9751* 1
Ferric ion 0.9951* 0.9895* 0.9801* 0.9948* 1 reducing
Superoxide 0.9957* 0.9956* 0.9889* 0.9821* 0.9884* 1 scavenging
Peroxyl radical 0.9964* 0.9956* 0.9843* 0.9893* 0.9880* 0.9951* 1 scavenging
Asterisks (*) indicate significant positive correlation at P≤0.05.
12 Kumar, R et al.
CONCLUSIONS
It is concluded that AME being rich source of ellagic acid, rutin and quercetin, hence can be an excellent food supplement.
REFRENCES
1. Shukla S, Mehta A, Mehta P, Bajpai, V.K. Antioxidant ability and total phenolic content of aqueous leaf extract of Stevia rebaudiana Bert. Exp Toxico Pathol. 2012; 64: 807-11.
2. Ksouri W.M, MediniF, Mkadmini, K, Legault, J, Magne, C, Abdelly, C, Ksouri, R. LC– ESI-TOF–MS identification of bioactive secondary metabolites involved in the antioxidant, anti-inflammatory and anticancer activities of the edible halophyte Zygophyllum album Desf. Food Chem. 2013; 139: 1073-1080.
3. Khanal S, Shakya N, Thapa K, Pant DR. Phytochemical investigation of crude methanol extracts of different species of Swertia from Nepal. BMC Res Notes. 2015; 8: 821-829. 4. Singh DP, Mani D. Protective effect of Triphala Rasayana against paracetamol-induced hepato-renal toxicity in mice. J Ayurveda Integr Med. 2015; 6: 181-186.
5. Zhu KX, Lian CX, Guo XN, Peng W, Zhou HM. Antioxidant activities and total phenolic contents of various extracts from defatted wheat grain. Food Chem. 2011; 126: 1122-1126. 6. Gouveia S, Castilho PC. Antioxidant potential of Artemisia argentea L’Her alcoholic extract and its relation with the phenolic composition. Food Res Int. 2011; 44: 1620-1631. 7. Liu J, Wang C, Wang Z, Zhang C, Lu S, Liu J. The antioxidant and free radical scavenging activities of extract and fractions from corm silk (Zea mays L.) and related flavones glycosides. Food Chem. 2011; 126: 261-269.
8. Lin JT, Chen YC, Lee YC, Hou CWR, Chen FL, Yang DJ. Antioxidant, antiproliferative and cyclooxygenase-2-inhibitory activities of ethanolic extracts from lemon balm (Melissa officilais L.) leaves. LWT-Food Sci Technol. 2012; 49: 1- 7.
9. Zhang Y, Fang Y, Liang H, Wang H, Hu K, Liu X, Yi X, Peng Y. Synthesis and antioxidant activities of 2-oxo-quinolone-3-carbaldehyde Schiff-base derivatives. Bioorg. Med. Chem. Lett. 2013; 23: 107-111.
10. Chauhan G, Singh SP, Singh OP, Trigunayat A. Khadir (Acacia catechu) a unique ayurvedic remedy. Ind J Res. 2011; 5: 1-4.
11. Devi VG, John A, Devi RS, Prabhakaran VA. Pharmacognostical studies on Acacia catechu Willd and identification of antioxidant principles. IJPSR. 2011; 3: 108-111.
12. ay D, haratchandra , Thokchom I . Antipyretic, antidiarrhoel, hypoglycaemic and hepatoprotective activities of ethyl acetate extract of Acacia catechu Willd. in albino rats. Indian J. Pharmacol. 2006; 38: 408-413.
13. Seigler DS. Phytochemistry of Acacia-sensu lato. Biochem. Syst. Ecol. 2003; 31: 845-873
14. Li XC, Yang LX, Wang HQ, Chen RY. Phenolic compounds from the aqueous extract of Acacia catechu. Chin. Chem. Lett. 2011; 22: 1331-1334.
15. Ainswort EA, Gillespie KM. Estimation of total phenolic content and other oxidation substrates in plant tissue using Folin-Ciocalteu reagent. Nat Protoc. 2007; 2: 875-877. 16. Kim DO, Chun OK, Kim YJ, Moon HY, Lee CY. Quantification of phenolics and their antioxidant capacity in fresh plums. J. Agric. Food Chem. 2003; 51: 6509-6515.
17. Prieto P, Pineda M, Aguilar M. Spectrophotometric Quantitation of Antioxidant capacity through the Formation of a Phosphomolybdenum Complex: Specific Application to the Determination of Vitamin E. Anal. Biochem. 1999; 269: 337-41.
18. Re R, Pellegrini N, Proteggente A, Pannala A, Yang M, Rice-Evans C. Antioxidant activity applying an improved ABTS radical Cation decolorization assay. Free Radic. Biol. Med. 1999; 26: 1231-37.
19. Blois MS. Antioxidant determinations by the use of a stable free radical. Nat com. 1958; 26: 1199-1200.
20. Apak R, Güçlü K, Ozyürek M, Bektaşoğlu B, Bener M. Cupric ion reducing antioxidant capacity assay for antioxidants in human serum and for hydroxyl radical scavengers. Methods Mol Biol. 2010; 594: 215-239.
21. Oyaizu M. Studies on product of browning reaction prepared from glucose amine. Jpn J Nutr. 1986; 44: 307-15.
22. Nishikimi M, Rao NA, Yagi K. The occurrence of superoxide anion in the reaction of reduced phenazine methosulfate and molecular oxygen. Biochem Biophys Res Commun .1972; 46: 849-54.
23. Ohkowa M, Ohisi N, Yagi K. Assay for lipid peroxides in animal tissue by thiobarbituric acid reaction. Anal. Biochem. 1979; 95: 351-358.
24. Lee JC, Kim HR, Kim J, Jang YS. Antioxidant property of an ethanol extract of the stem of Opuntia ficus-indica var. Saboten. J. Agric. Food Chem. 2002; 50: 6490–6496. 25. Mossman T. Rapid colorimetric assay for cellular growth of survival, application to proliferation of cytotoxicity assays. J Immunol Methods. 1983; 65, 55–63.
26. Maksimović Z, Malenčić Đ, ovačević N. Polyphenol contents and antioxidant activity of Maydis stigma extracts. Bioresour Technol.. 2005; 96: 873-877.
27. Pourmorad F, Hosseinimehr SJ, Shahabimajd N. Antioxidant activity, phenol and flavonoid contents of some selected Iranian medicinal plants. Afr. J. Biotechnol, 2006; 5 (11).
28. Majid S, Khanduja KL, Gandhi RK, Kapur S, Sharma RR. Influence of ellagic acid on antioxidant defense system and lipid peroxidation in mice. Biochem. Pharmacol. 1999; 42, 1441-1445.
29. Meyer AS, Heinonen M, Frankel EN. Antioxidant interactions of catechin, cyanidin, caffeic acid, quercetin, and ellagic acid on human LDL oxidation. Food Chem. 1998; 61, 71- 75
30. Pekkarinen SS, Heinonen IM, Hopia AI. Flavonoids quercetin, myricetin, kaemferol and (+)‐catechin as antioxidants in methyl l inoleate. J . Sci. Food Ag r. 1999; 79, 499-5 06.
31. Mertens-Talcott SU, Percival SS. Ellagic acid and quercetin interact synergistically with resveratrol in the induction of apoptosis and cause transient cell cycle arrest in human leukemia cells. Cancer Lett. 2005; 218, 141-151.
32. Lin JP, Yang JS, Lin JJ, Lai KC, Lu HF, Ma CY, Wu RSC, Wu KC, Cheuh FS, Wood WG, Chung JG. Rutin inhibits human leukemia tumor growth in a murine xenograft model in vivo. Environ. Toxicol. 2012; 27: 480-484.
33. Phatak RS, Hendre AS. Total antioxidant capacity (TAC) of fresh leaves of Kalanchoe pinnata. J Pharmacog Phytochem, 2014; 2: 32-35.
34. Dastmalchi K, Dorman HD, Laakso I, Hiltunen R. Chemical composition and antioxidative activity of Moldavian balm (Dracocephalum moldavica L.) extracts. LWT-Food Sci. Technol. 2007; 40, 1655-1663.
35. Kaur R, Arora S. Investigations of antioxidant activity of methanol extract of Chukrasia tabularis A. Juss. leaves. J Chin Clin Med, 2008; 31, 200-205.
36. Shi J, Gong J, Liu JE, Wu X, Zhang Y. Antioxidant capacity of extract from edible flowers of Prunus mume in China and its active components. LWT-Food Sci. Technol. 2009; 42(2), 477-482.
37. Halliwell B. Reactive oxygen species and the central nervous system. In Free radicals in the brain 1992 (pp. 21-40). Springer Berlin Heidelberg.
38. Gutteridge JM. Lipid peroxidation and antioxidants as biomarkers of tissue damage. Clin chem. 1995; 41: 1819-1828.
39. Kaur R, Arora S, Singh B. Activity of the phenol rich fractions of leaves of Chukrasia tabularis A. Juss. Bioresour Technol. 2008. 99(16), 7692-7698.
40. Pacifico , allicchio M, Fiorentino A, Fischer A, Meyer , tint ing FC. Antioxidant properties and cytotoxic effects on human cancer cell lines of a ueous fermented and lipophilic uince (Cydonia oblonga Mill.) preparations. Food Chem. Toxicol. 2012; 50: 4130-4135.
41. Sreejamole KL, Radhakrishnan CK. Antioxidant and cytotoxic activities of ethyl acetate extract of the indian green mussel Perna viridis. Asian J Pharm Clin Res. 2013; 6: 197-201.
Received: February 03, 2016; Accepted: July 14, 2016