FACULDADE DE
ENGENHARIA DA
UNIVERSIDADE DO
PORTO
Advancing Computational Biophysics
with Virtual Reality
Afonso Bernardino da Silva Pinto
Master’s Degree in Informatics and Computer Engineering Supervisor: António Augusto de Sousa
Advancing Computational Biophysics with Virtual
Reality
Afonso Bernardino da Silva Pinto
Master’s Degree in Informatics and Computer Engineering
Resumo
A visualização científica, conceito interdisciplinar entre ciência e computação gráfica, tem como objetivo permitir uma conceptualização visual no processo de pesquisa cientifica. A ca-pacidade dos cientistas visualizarem resultados de computações e simulações é essencial para a aquisição de novos conhecimentos e, por conseguinte, para evolução do campo científico envol-vente.
O método científico é, por natureza, um processo interativo e iterativo o que requer que ferra-mentas de auxílio à visualização gráfica sejam o mínimo limitantes possível no que diz respeito à interação com o ambiente.
A conjunção destas duas conjeturas, com a massificação de headsets de realidade virtual e das tecnologias de visualização que com eles prosperam, abre um espaço atrativo para a introdução de serviços de visualização baseados em realidade virtual com foco na progressão da pesquisa científica.
O objetivo desta dissertação é explorar e avaliar a recetividade das entidades competentes à introdução de realidade virtual como uma ferramenta de visualização científica no campo da biofísica computacional.
A realidade virtual é uma interface de simulação de ambientes tridimensionais, gerados por computador, onde o utilizador pode interagir de forma aparentemente natural com a cena. Uma das formas de implementação desta interface, que foi estudada no presente documento, corresponde à utilização de um headset no utilizador, auxiliado por dois controladores de mão, numa aplicação de visualização interativa.
A estratégia utilizada para quantificar a avaliação proposta passou pelo desenvolvimento de um protótipo de uma aplicação (baseada na web) com visualização de dados científicos através de realidade virtual e submissão deste a um conjunto de testes práticos, qualitativos e quantitativos, com respetivo feedback por parte dos intervenientes. Paralelamente foi elaborado um estudo, segundo o modelo de aceitação de tecnologias.
A solução proposta procurará constituir uma base de trabalho sólida e suficientemente genérica para ser aplicada em contextos onde a visualização de informação científica através de realidade virtual possa ser bem-sucedida.
Foram efetuadas 3 avaliações (avaliação de aceitação, avaliação prática ao protótipo e avali-ação teórica às interações do protótipo) que, embora condicionadas por um número de partici-pantes reduzido, permitiram a obtenção de um feedback positivo sobre o trabalho desenvolvido.
Palavras-Chave: realidade virtual, biofísica computacional, modelção e simulação, software científico, visualização de dados,
Abstract
Scientific visualization, an interdisciplinary concept between science and computer graphics, aims to allow a visual conceptualization in the scientific research process. The ability of scientists to visualize the result of computations and simulations is essential for the acquisition of new knowledge and, therefore, for the evolution of the surrounding scientific field.
The scientific method is, by its nature, an interactive and iterative process which requires that tools to aid graphic visualization are the least possible limiting factors with regard to interaction with the environment.
The combination of these two conjectures, with the massification of virtual reality headsets and the visualization technologies that thrive with them, opens an attractive space for the introduction of visualization services based on virtual reality with a focus on the progress of scientific research. The objective of this dissertation is to explore and evaluate the receptivity of competent entities to the introduction of virtual reality as a scientific visualization tool in the field of computational biophysics.
Virtual reality is a simulation interface of three-dimensional environments, generated by com-puter, where the user can interact in an apparently natural way with the scene. One of the ways of implementing this interface, and which was studied in this document, corresponds to the use of a headset by the user, aided by two hand controllers, in an interactive visualization application.
The strategy used to quantify the proposed evaluation involved the development of a prototype of an application (web based) with visualization of scientific data through virtual reality and sub-mission of it to a set of practical, qualitative and quantitative tests, with respective feedback from the participants. At the same time, a study was prepared, according to the technology acceptance model.
The proposed solution seeks to constitute a solid and sufficiently generic work base to be applied in contexts where the visualization of scientific information through virtual reality can be successful.
We realized three evaluations (acceptance evaluation, practical evaluation of the prototype and theoretical evaluation of the prototype interactions) which, although conditioned by a reduced number of participants, allowed to obtain positive feedback the work developed.
Keywords: virtual reality, computational biophysics, modelling and simulation, scientific soft-ware, data visualization
Acknowledgements
To my advisor, Prof. Augusto Sousa, and to Prof. António Coelho for their support and en-couragement during the dissertation, for their help in reviewing the work registered here and for the opportunity to study an area as exciting as this.
To MetaCell’s staff, for their constant willingness to answer the various questions that were asked and for their precious help at different moments of the realization of this dissertation, espe-cially during the prototype development.
To the friends I created in college, and with whom I shared great moments over the past 5 years. To my family, for their understanding and support and, especially, to my brother and girlfriend for their help in reviewing this document.
Afonso Pinto
“L’essentiel est invisible pour les yeux.”
Antoine de Saint-Exupéry
Contents
1 Introduction 1
1.1 Context and Motivation . . . 1
1.2 Problem Statement . . . 2 1.3 Objectives . . . 2 1.4 Contributions . . . 3 1.5 Related Work . . . 3 1.6 Document Structure . . . 3 1.7 Summary . . . 4 2 Literature Review 5 2.1 Computational Biophysics . . . 5 2.1.1 Computational Neuroscience . . . 6 2.2 Concept of Visualization . . . 12 2.2.1 Sub-fields of Visualization . . . 13 2.2.2 Visualization Advantages . . . 13
2.2.3 The Visualization Pipeline . . . 14
2.3 3D Visualization . . . 15 2.3.1 3D Graphics . . . 16 2.3.2 WebGL . . . 17 2.3.3 Problems . . . 18 2.4 Virtual Reality . . . 19 2.4.1 History . . . 20 2.4.2 Core Concepts . . . 21 2.4.3 Visualization in VR . . . 23 2.4.4 Hardware . . . 24 2.4.5 Software . . . 26 2.4.6 Interaction Techniques . . . 28 2.4.7 Full-Body Tracking . . . 32 2.4.8 Cybersickness . . . 32 2.4.9 Future directions . . . 33 2.5 Summary . . . 33 3 Methodology 35 3.1 Context & Objectives . . . 36
3.2 Project Specification . . . 38
3.2.1 Actors . . . 38
3.2.2 User Stories . . . 38
3.2.3 Technical requirements . . . 40
3.3 Computational Biophysics . . . 40 3.3.1 Models . . . 40 3.3.2 Simulation . . . 41 3.3.3 Visualization . . . 41 3.4 Virtual Reality . . . 42 3.4.1 Navigation . . . 42 3.4.2 Interactions . . . 48 3.5 Summary . . . 51 4 Implementation 53 4.1 Prototype . . . 53 4.2 Architecture . . . 55 4.3 Technologies . . . 55
4.4 The visualization pipeline . . . 57
4.5 User Interactions . . . 57 4.5.1 Navigation . . . 60 4.5.2 Selection . . . 60 4.5.3 Rotation . . . 60 4.5.4 Scaling . . . 60 4.5.5 Bring Closer . . . 61 4.6 Simulations . . . 61 4.7 Scenes . . . 61 4.7.1 Auditory Cortex . . . 62
4.7.2 CA1 Pyramidal Cell . . . 62
4.7.3 Virtual Fly Brain . . . 62
4.8 Summary . . . 63
5 Evaluation and Discussion 65 5.1 Acceptance Evaluation . . . 65
5.1.1 Technology Acceptance Model . . . 65
5.1.2 Participants . . . 65 5.1.3 Results . . . 66 5.1.4 Discussion . . . 69 5.2 Controlled Experiment . . . 69 5.2.1 Design . . . 70 5.2.2 Hypothesis . . . 70 5.2.3 Participants . . . 71 5.2.4 Procedure . . . 71 5.2.5 Results . . . 72 5.2.6 Discussion . . . 73 5.3 Interactions Evaluation . . . 73 5.3.1 Participants . . . 73 5.3.2 Results . . . 74 5.3.3 Discussion . . . 74 5.3.4 Summary . . . 75
CONTENTS xi
A TAM Form 79
A.1 Survey . . . 79
A.2 Survey Results . . . 85
B Interactions Form 87 B.1 Survey . . . 87 B.2 Survey Results . . . 94 C Tests Form 95 C.1 Survey . . . 95 C.2 Survey Results . . . 99 References 101
List of Figures
2.1 Multiscale levels of investigation for studying the brain. Adapted from [21] . . . 7
2.2 Neurons are polarized cells with three main compartments: dendrites, cell body (or soma), and axon . . . 8
2.3 Equivalent circuit model of a dendritic compartment. . . 9
2.4 A competitive recurrent network. . . 10
2.5 Diagram of the scientific method . . . 14
2.6 Visualization pipeline on desktop workstation . . . 15
2.7 Diagram of a ’what if’ type of analysis system . . . 15
2.8 A 3D coordinate system . . . 16
2.9 A 3D mesh . . . 17
2.10 The History of Web3D . . . 18
2.11 Traditional web browser workflow (left side) and web browser workflow using WebGL (right side) . . . 18
2.12 Comparison of pie charts - Item C appears to be at least as large as Item A, whereas in actuality, it is less than half as large . . . 19
2.13 Milgram’s Reality-Virtuality Continuum . . . 20
2.14 The evolution of VR . . . 21
2.15 Monthly-connected Headsets on Steam (by # of headsets) . . . 22
2.16 Visualization pipeline with a VR component . . . 24
2.17 Monthly-connected Headsets on Steam (by # of headsets) . . . 24
2.18 A-Frame online inspector . . . 27
3.1 Example of biophysics visualization application (HNN[68]): Setting model pa-rameters. . . 36
3.2 Example of biophysics visualization application (HNN[68]): Running simulation. 36 3.3 HNN[68]: Simulation results. . . 37
3.4 Block diagram with the layers / features to be implemented in the prototype. . . . 37
3.5 Euler angles representation . . . 43
3.6 (a) Accelerometers measure sum of gravity and linear acceleration (b) To deter-mine tilt error angle φ , the tilt axis is calculated, which lies in the horizontal (XZ) plane. . . 45
3.7 Effect of the correction strategies over time in terms of drift degrees . . . 46
3.8 Ray "shooting" example . . . 49
3.9 Ray example . . . 49
4.1 Auditory Cortex scene . . . 54
4.2 CA1 Cell scene . . . 54
4.3 Virtual Fly Brain scene . . . 54
4.4 Auditory Cortex simulation . . . 54
4.5 CA1 Cell simulation . . . 54
4.6 CA1 visual group that highlights potassium channels . . . 54
4.7 A high-level view of the implementation architecture used . . . 55
4.8 Technology stack diagram . . . 56
4.9 Canvas workflow diagram . . . 58
4.11 User interactions diagram . . . 59
4.10 Oculus controllers schema . . . 59
4.12 Voltage color scale . . . 61
4.13 VFB slices with color mapping . . . 62
5.1 The Technology Acceptance Mode . . . 66
5.2 Path verification . . . 68
5.3 Box plot for VR times . . . 72
List of Tables
2.1 Headsets Comparation . . . 25
2.2 Support Table for the WebXR API . . . 26
2.3 Game Engines Compatibility Comparation . . . 28
3.1 User Stories . . . 39
3.2 Technical requirements . . . 40
5.1 Demographic profile of the respondents. . . 67
5.2 Inter-construct correlations as discriminant validity (square root of AVE in diago-nals). . . 67
5.3 Validity and reliability of the measurement model. . . 67
5.4 Model fit indexes and recommended criteria. . . 69
5.5 Participants demographic and previous expertise information . . . 71
5.6 Summary of the results in terms of completion time, correctness and perceived difficulty . . . 72
5.7 Sociodemographic factors and participants expertise . . . 74
5.8 Summary of the feedback for the prototype interactions . . . 75
A.1 TAM questionnaire results. . . 85
B.1 Interactions questionnaire results. . . 94
C.1 Tests questionnaire results. . . 99
Abbreviations
2D Two Dimensions
3D Three Dimensions
CAVE Cave Automatic Virtual Environment DCM Direction Cosine Matrix
EFA Exploratory Factor Analysis
fps frames per second
HMD Head Mounted Display
HTTP Hyper Text Transfer Protocol IMU Inertial Measurement Unit
NFI Normed Fit Index
PI Place Illusion
PLS Partial Least Squares Psi Plausibility Illusion
VR Virtual Reality
SRMR Standardized Root Mean Square Residual
SSL Secure Sockets Layer
TAM Technology acceptance model
TLS Transport Layer Security
Chapter 1
Introduction
This dissertation involves both virtual reality and computational biophysics areas, with partic-ular focus in visualization tools for scientific data analysis. This chapter will provide an overview on the motivation, context and objectives of the dissertation.
1.1
Context and Motivation
Over the past two decades, computational science has gained more and more relevance in the research academy, industry and laboratories to advance discovery. Its ability to provide scien-tists and engineers with powerful, reproducible and shareable models/experiments has become a prevalent mean of discovery and innovation in essentially all areas of science, allowing them to face new, more exciting and more complex challenges. However, as the scientific problems under investigation becomes more complex, the amount of data that scientist have to deal with grows. The complexity and quantity of data generated by today’s computational scientific tools can make it impossible to process information completely numerically.
Visualization has become a necessity for understanding both large and complex amounts of data generated by the current scientific problems. If it is true that a number of visualization niques can automatically extract features of interest, it is also true that the majority of the tech-niques require human intervention in order to understand and interpret the complex structures in study. Adding interaction (either by allowing the exploration of a three-dimensional scene or by al-lowing the tuning of some visualization parameters) to the receipt, greatly increases a researcher’s perception and understanding [103].
“Interactively exploring a three-dimensional scene can greatly improve a researcher’s understanding of the three-dimensional relationships in an environment through mo-tion parallax.” [48]
With scenarios that require this kind of visual interactivity, we decided to explore an emerg-ing technology, characterized by the immersiveness that provides, which recently saw huge im-provements in the hardware that requires and whose prices are at reasonably affordable levels, to
stimulate the formulation of hypotheses, facilitate the discovery of causality and assess available evidences. The aforementioned technology is VR.
The dissertation was developed in partnership with a neuroscience software company called MetaCell1. MetaCell is the world leader in software for neuroscience. It partners with academic institutions and pharma organizations, providing software for simulation and data analysis and helping them make the most of their neuroscience data and models.
The main goal of this project was to assert if the use of VRin visualization and exploration of scientific data in the fields explored by the company, namely computational biophysics, taking advantage of a more immersive environment, would be a featured accepted by the relevant entities and if it would speed up the verification of theories and new scientific discoveries.
1.2
Problem Statement
This dissertation addresses the problem of trying to measure the relation between the level of interactivity and immersiveness experienced by scientific researchers when using visualization tools and the quality and quantity of their results. More specifically, we want to understand the performance impact of using VR(using head mounted displays) when compared with the current use of standard 3D desktop visualization.
1.3
Objectives
The main objective of this dissertation is the study of the benefits of introducing VR in com-putational biophysics visualization tools.
As an illustration of this technology’s usefulness, a prototype of a very simplistic web-based application with an immersive VR experience for neuroscience data visualization was imple-mented.
Within the scope of this main objective, specific objectives can also be identified: • Preparation of a state-of-the-art technology report;
• Investigation of visualization techniques in VRas well as problems existing in each of them; • Creation of a prototype of a web-based application with an immersive VR experience that allows simple interactions with the data visualized (selection, rotation, scaling and position changes);
• Implementation of a set of experiences in view of the problem under study; • Prototype testing and evaluation.
1.4 Contributions 3
1.4
Contributions
The main contributions of this dissertation include:
• The development of a simplistic visualization application for scientific data in the domain of computational biophysics, based on immersive VR technologies. This application becomes the foundation of this thesis research, which is used as a tool for supporting performance analysis and gather feedback.
• A set of benchmark methodologies to quantify all performance parameters of the prototype application. This prototype application and its associated micro-benchmarks make up as a tool for performance evaluation and analysis.
• An analysis based on the Technology Acceptance Model (TAM), in order to study the ac-ceptance of the introduction of VR in visualization tools for scientific data.
1.5
Related Work
In the area of scientific visualization using VR, Bryson’s paper of 1996 [14] stands out giving a very comprehensive first approach on this issue, with focus on the performance requirements of the given system. A practical use of VR for scientific visualization is covered in [102] although this one is done in the context of big data management. Still regarding the use of VR in scien-tific visualization, but also framed in the topic of recommended strategies for visualization and interactions in VR [52]. Several surveys were also consulted, which proved to be very useful in identifying the most common problems of current 3D visualization systems, some of them being [19] [10]. Moving now to the domain of quantifying the benefits of changing a visualization sys-tem from 3D to virtual reality, [62], despite being an article whose focus is augmented reality, shares most of the concerns to be had when implementing an evaluation method of the same type as the one on the present thesis. The paper [59], although focused on the use of VRhardware in general, also addresses the acceptance of this technology according to an extended technology acceptance model.
1.6
Document Structure
This document is divided into six chapters: Introduction, Literature Review, Methodology, Im-plementation, Evaluation and Discussion and Conclusions and Future Work. This chapter seeks to provide an overview of the topic. Contains a presentation of the context and problem in a syn-thetic way, as well as the goals of the dissertation. In the Literature Review, the state of the art is described for each of the areas related to the dissertation theme, and several alternative solu-tions are presented for each of the problems encountered. Then, in the Methodology chapter, is approached, in a more theoretical way, the solution found and the work developed during the dis-sertation. In this section, the theoretical foundations of the approached methods are presented and,
whenever necessary, the empirical examples that served as the basis for the decisions made. In the next chapter, Implementation, the prototype implemented during the dissertation is described and the most important technical issues that characterize the proposed system are identified. The following chapter, Evaluation and Discussion contains the description and discussion of the eval-uations performed. Finally, in the last chapter, possible concrete applications of this solution are mentioned and pointed out some basic directions for the work that may be developed in the future.
1.7
Summary
This chapter provides an overview of the topic. Contains a synthetic presentation of the context and problem, as well as the goals of the dissertation. It also states the contributions of this thesis and related work.
The next chapter will address the state of the art of the relevant fields of this dissertation: Computational Biophysics, Visualization, 3D Visualization and VR.
Chapter 2
Literature Review
Throughout this chapter, the state of the art of each one of the areas related with this disser-tation will be addressed. The first section is reserved for the state o compudisser-tational biophysics (section2.1). In the second, we will introduce the concept of visualization (section 2.2). The theme of the third section is 3D visualization (section 2.3), where it will be discussed current strategies to develop, as well as identifying some of their common problems. In the forth and last chapter, the concepts of VR(section2.4) will be reviewed, as well as its evolution over the years. This topic will be the most relevant in the context of the chapter, given that this is the main component of the evaluation to be performed in this dissertation and, at the same time, the area that raises the most scientific interest given its recent emergence. Throughout this analysis, several alternatives will be presented and discussed, giving privilege to those who will, at the outset, be more suitable for an end use of according to thesis requirements.
2.1
Computational Biophysics
Computational biophysics is a field at the intersection between computer science, physics, chemistry and biology. It is described by Ilan Samish et al. as:
“Computational biophysics is a hypothesis-driven physics-based treatment of biolog-ical systems.” [82]
Researchers in this area try to understand the influencing factors, the functions and the inter-play between different parts of complex biological systems. The field has become increasingly popular during the last few decades. One factor that has greatly contributed to this growth is the increased availability of computer power. As biology advanced into this century, new levels of quantitative understanding of biological systems were required; if the quality of the hardware had not kept up with those requirements, some of the exciting developments of today would still be beyond imagining.
No single approach can fully characterize the research that falls into this general area and there-fore, in this section (and in this dissertation in general), we will use computational neuroscience (a sub branch of computational biophysics) as a concrete example of computational biophysics.
2.1.1 Computational Neuroscience
As part of the larger field of computational biophysics, computational neuroscience (CNS) tries to understand how does the brain (and the complete nervous system) generate behaviors using computational approaches. The organization for computational neurosciences defines the term "computational neuroscience" as follows:
“Computational neuroscience is an interdisciplinary field for development, simula-tion, and analysis of multi-scale models and theories of neural function from the level of molecules, through cells and networks, up to cognition and behavior. ” [83]
This definition refers a key components of modern research in neuroscience, ’models’. The next subsection will explore this concept in detail.
2.1.1.1 Computational Modelling
Computational models have become an important tool in the study of the nervous system and are commonly used in the simulation of specific aspects of physiology and pathology [2]. The main goal for using computational modeling is to understand the behavior of complex systems using mathematical analysis and computer simulations [66].
A model can be seen as a simplification of the system where we want to test some hypothesis. Thomas Trappenberg describes it as:
“A model is abstraction of a real-word system to demonstrate particular features of, or investigate specific questions about, the system. Or, in more scientific terms, a model is a quantification of a hypothesis to investigate the hypothesis.” [99]
Models are intended to simplify/abstract complex systems, thereby identifying which details of the whole are essential to explain a certain phenomena. Additionally, by being formalized mathematically, the assumptions of the model are explicit, unambiguous and logically consistent, making them easily reproducible.
Further subsections will provide answers to typical questions when deciding to build a com-putational model: What level to model? How detailed the model should be? How to model? How to use the model?
Level of Analysis
No single neural model can be expected to span all the levels of the nervous system (Fig.2.1) and an essential feature at one level of organization may be an insignificant detail at another. The
2.1 Computational Biophysics 7
nature of the scientific question that drives the modelling work is what determines the level at what the model is to be constructed [89].
Figure 2.1: Multiscale levels of investigation for studying the brain. Adapted from [21]
Level of Detail
The level of detail of a model closely relates with how realist we want the model to be. This decision should not be taken lightly as the choice for a more detailed model comes at the cost of higher model complexity and higher computationally power required. Present constraints limit simulations to tiny nervous systems or small components of more complex systems [84].
• Realistic Models - This strategy consists of a very large scale simulation that tries to incor-porate as much of the cellular detail as is available. An example of a realistic model at the level of a single neuron is the Hodgkin-Huxley model [41].
• Simplified Models - This approach consists of models that reproduce the essential proper-ties of physical systems. On one hand, since we do not yet know all the cellular details, there might be important features that are being inadvertently left out. On the other hand, simplifying models of the brain can provide a conceptual framework for isolating the ba-sic computational problems and understanding the computational constraints that govern the design of the nervous system. The scaling of this strategy is an important aspect for practical applications.
Methods
are going to be used for modelling, since they can have a substantial impact in the complexity of the model. In this section we will address the two principal categories of methods that account for most of the research field. These methods are: 1) Single neuron models and 2) Network models.
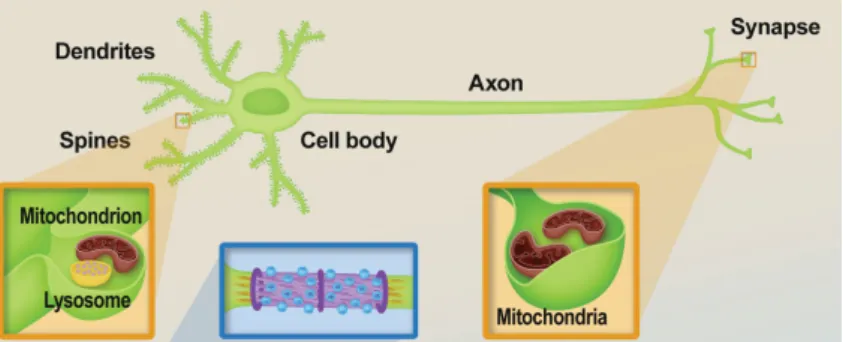
Single Neuron Models Neurons are specialized cells with a high level of polarization de-fined by the presence of three major compartments: the dendrites, a cell body (or soma) and an axon (Fig. 2.2). Dendrites are specialized to receive electrochemical signals, which are then pro-cessed and transferred through the cell body and along the axon to be transmitted to the target cell/s. [28].
Figure 2.2: Neurons are polarized cells with three main compartments: dendrites, cell body (or soma), and axon
Many models have been proposed to modulate the behavior of single neurons, ones extremely complex and others more simplistic.
• Compartmental Models - Are the most detailed class of neuron models. In this modulation technique the cell is modeled as a set of compartments and each dendritic compartment is modeled as an electric circuit (Fig. 2.3) with the equation :
CdV
dt =
∑
j gj(y) [Ej−V ] + Vr−VR (2.1)
where V is the membrane potential, Vr is the resting membrane potential, R is the passive membrane resistance, C is its capacitance, Ej is the reversal potential of synapse j on the path, and gj(t) is the time-varying conductance of synapse j and dV/dt represents the rate of change for V with respect to time [66].
Typically, simulations with compartmental models focus on single cells, or a small number of cells due to performance issues.
• Integrate-and-Fire Models - These models are a simplified version of the compartmental models. This simplification is divided in 3 crucial changes:
1. The entire neuron is modeled by a single compartment. 2. Synapses are model as parameters and not as ion channels.
2.1 Computational Biophysics 9
Figure 2.3: Equivalent circuit model of a dendritic compartment.
3. The action potential generation is modeled by: CdVi
dt = Vi
R+
∑
j wi j∑
k ∂ (t − tjk) (2.2)where wij is the weight (efficacy) of the jth synapse, tjk is the time at which the kth spike arrives at synapse j, and d(t) is the Dirac delta function representing the spike [66].
This modulation technique have been used mostly in network-level modeling of the nervous system.
• Rate Models - These models are a simplification of the integrate-and-fire models. They replace the ∂ (t − tjk) of eq.2.2with a continuous variable, typically
fj(t) = [1 + exp(−λVj]−1 (2.3)
to represent the spiking rate.
Rate models are the simpler models than Integrate-and-Fire and are widely used in neural network models.
• Threshold Models - The simplest class of neuron models which simply views neurons as all-or-none devices. This is due to the replacement of eq.2.3with a binary threshold. A cell that is sufficiently excited has a firing rate of 1 (active), while an insufficiently excited cell has a rate of 0 (inactive).
This models, although very simplistic, allow the simulation and analysis of very large-scale networks, providing very valuable intuitive results regarding the collective behavior of such systems [42].
Network Models The most valuable information in the nervous system occurs not in the individual but at the collective level, so rather than focusing in single neuron models, the primary interest of computational modelling goes on the behavior of networks. Two neural regions can be
very different from each other, but there are some canonical types of network architectures that have been identified as being of general interest no matter the anatomy:
• Feed-Forward Network - This architecture is characterized by signals flowing unidirection-ally from one set of neurons to another (without any feedback). Few are the parts of the brain that do not have feedback actions, but for the ones who don’t and the ones where those effects can be ignored (directed projections from the principal neurons of one area to another) feed-forward architectures are a good way to go. A well-known instance of a feed-forward network is Hubel and Wiesel’s model of feature detectors in simple cells and complex cells of the primary visual cortex [43] [44].
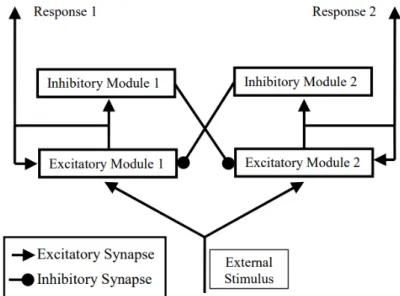
• Recurrent Networks - In this architecture the outputs of cells in a layer feed back to the same cell population or to upstream populations. This strategy is gaining more popularity as new discoveries in the nervous system lead to a substantial relevance of recurrent systems in the brain (e.g. the thalamocortical loop [81], CA3 cell and relations with associative memory [60]). Figure2.4shows an example of a network containing two groups of excitatory neu-rons (increase the likelihood that the neuron will spike) in a cell layer with both recurrent self-excitation and recurrent mutual inhibition.
Figure 2.4: A competitive recurrent network.
2.1.1.2 Computer Simulations
After building the model, one can now use it to test or prove new theories by iteratively change its parameters and evaluate the resulting changes. Traditionally this was done by performing applied mathematics and theoretical physics with a pen and a paper. However, with the appearing of computational modeling, we can now use ’experimental mathematics’. This process consists in running virtual experiments to try understand the behaviors of the model. Compared to the traditionally method it brings the following advantages [57]:
2.1 Computational Biophysics 11
• While traditional methods provide a clean reality, simulations provide an alternative reality, easier to manipulate and access.
• The scope of the model complexity (in terms of calculus) that can be target is incomparably superior.
• Running computer simulations allows one to test specific questions about causality that could only be guessed in a paper-and-pencil modeling.
2.1.1.3 Computational Neuroscience Tools
So far we have seen that being able to run computer simulations is currently a very important feature in computational neuroscience. Another crucial factor, which will be described in detail later on this chapter, refers to visualization. Multiple studies (e.g [46] [51] [104]) suggest that the visualization of 3D models can facilitate the learning of complex conceptual relationships. Therefore, auxiliary neuroscientific tools of today should be able to provide both simulation and visualization features. However, it is often far from trivial to use both of this features together [16].
In one hand, for simulation, the principal set of tools we have available contain: NEURON [40], which according to [97] is better suited for detailed models; BRIAN [37], which provides the most concise language for both large and small networks, NEST [75] which mostly favors large network models and GENESIS [7]
On the other hand, for visualization, various 3D visualisation tools have been developed such as BioLayout Express3D [32], Arena3D [73], Amira 3D [88], V3D [74], the Allen Brain Atlas [56] or Cytoscape [85]. All these tools are very complete, but require local installation and are usually complex to operate for non-expert users.
Typically, in order to solve this fragmentation problem, developers use general purpose pro-gramming languages such as Python, to generate the tool-chains necessary for their needs. How-ever, this solution contributes to the technological division of the field since the tool-chains de-veloped are usually case specific and in some cases inaccessible to many researchers. Such tech-nological barriers have had a remarkable effect in the neuroscience field as a whole, resulting in computational models that are poorly validated and in unexplored model-generated hypotheses [18].
Tools like, Geppetto [18] and Visimpl [34], try to combat that problem by providing an aggre-gated platform to both visualizing neuroscience models and managing simulations.
2.1.1.4 Future directions
In the past decades, digital computers have been increasing in computing power and data storage which transformed how computational neuroscientific experiments are performed, how scientific data are analyzed and the development of brain models and theories. Looking into the future, the field of computational neuroscience promises new opportunities and challenges. The
Brain Initiative 2.0 [67] defines the following priorities for the development of computational neuroscience in the next 5 years (ending in 2025):
1. Discovering Diversity: Identify, determine their roles in health and disease and provide experimental access to the different brain cell types.
2. Maps at Multiple Scales: Generate multi-scale circuit diagrams from synapses to the whole brain.
3. The Brain in Action: Improve methods to monitor large-scale neural activity and try to produce a dynamic picture of the functioning brain.
4. Demonstrating Causality: Improve simulation tools so that precise changes in the neural circuit dynamics can lead to links between brain activity and behavior.
5. Identifying Fundamental Principles: Analyse data and try to produce conceptual basis of understanding for the biological act of mental processes.
6. Advance Human Neuroscience: Develop innovative technologies to try understand the hu-man brain and treat its neurological disorders.
7. From the BRAIN Initiative to the Brain: Aggregate the features/tools resultant from goals #1-6 into a centralized tool to facilitate the discovery of how dynamic patterns of neural ac-tivity are transformed into cognition, emotion, perception, and action in health and disease. Despite all the scientific and technological progress so far, computational neuroscience is still in its early stages and it is expected that in the near future we will see improvements on the modelling studies and their projections of the highly complex biological reality of the human brain.
2.2
Concept of Visualization
The term visualization can be used to name different means, in this thesis, we focused on visualization in computing, which may be technically referred as computer-supported data visual-ization. In this context, G. Scott Owen defines visualization as follow:
“Visualization is essentially a mapping process from computer representations to per-ceptual representations, choosing encoding techniques to maximize human under-standing and communication.” [70]
McCormick goes further and adds the scientific discovery factor to the definition itself: “Visualization is a method of computing. It transforms the symbolic into the geomet-ric, ... Visualization offers a method for seeing the unseen. It enriches the process of scientific discovery and fosters profound and unexpected insights.” [25]
2.2 Concept of Visualization 13
In the above definition, there is a mention to the term "insight". This is a non-trivial concept which is defined by multiple dictionaries as "accurate and deep intuitive understanding". If it is true that this is in fact the objective of those who create and use visualization tools, it is also true that it is a rather complicated notion to objectively measure and evaluate.
Given this perhaps too much vagueness, in the remainder of this dissertation document, when we refer to visualization we will be thinking about the following definition:
“Visualization is a study of transformation from data to visual representations in order to facilitate effective and efficient cognitive processes in performing tasks involving data. The fundamental measure for effectiveness is correctness and that for efficiency is the time required for accomplishing a task.” [20]
2.2.1 Sub-fields of Visualization
Currently the global concept of visualization is typically used into two sub-fields:
Scientific Visualization: displays spatial data associated with scientific processes such as the bonding of molecules in computational chemistry.
Information Visualization: develops visual metaphors for non-inherently spatial data such as the exploration of text-based document databases
The dividing line between these two fields is whether the spatialization is given (scientific) or chosen (information). However, more recently, there seems to be an effort on the part of some members of the visualization community to shrink that line and bring these two fields together. This current of thought is supported by the unprecedented amount of information available from large-scale simulations, experiments, and data collection to scientists today, making the traditional scientific visualization field not well suited for the challenges of today [79]. The merge with information visualization might come in handy, as the latter is described by Alexandre Valle de Carvalho as:
“Information visualization focuses on compactness, meaning the ability to graphi-cally compact large amounts of information in such a manner that allows the observer to more effectively discover, make decisions or provide explanations about patterns individual or groups of information items.” [24]
2.2.2 Visualization Advantages
In order to show some of the visualization advantages, let us consider, as example the task of analyse a stream of numbers compared with graphically visualise the same data:
• Faster Observations - Viewing a graph is much faster than viewing a stream of numbers, since the first facilitates the pre-attentive processing, allowing information to be obtained from the environment unconsciously. [91].
• Stimulating Hypotheses and Other Thoughts - There are some studies suggesting that when visualization is appropriately designed and allows clear and natural interactions, it can help understand the underlying data, find relationships and stimulate hypotheses more effectively [20] [24].
• Evaluating Hypothesis - The scientific method (Fig.2.5) consists of 6 steps. The 5th refers to hypothesis testing and it is critical in this process. Whenever applicable and doable, one should utilise verified testing methods, such as Bayesian hypothesis testing [6]. However, those methods require non-trivial amount of time and work to process. In practice, visu-alization is often used as an intuitive form of hypothesis validation. Typically this process consists in comparing the results of a simulation (hypothesis) with some ground truth data [20].
Figure 2.5: Diagram of the scientific method
2.2.3 The Visualization Pipeline
We can describe the step-wise process of creating visual representations of scientific data the visualization pipeline [52]:
• Simulation: results of numerical simulations are generally the input of the visualization pipeline.
• Data Selection & Filtering: in this pre-processing step the raw data is putted in a specific format by application of for example, smoothing filters, interpolation of missing values or corrections of erroneous measurements.
• Visualization Mapping: in this stage the processed data from the previous step is mapped into the visualization space, i.e. transformed into graphical primitives. According to Mackin-lay [58], this is the most critical step to achieve expressiveness (quality of the graphical language that expresses the desired information) and effectiveness (quality of the graphical language that exploits the capabilities of the output medium and the human visual system)
2.3 3D Visualization 15
• Rendering: At last, the graphical primitives are rendered as images, which are then dis-played on the screen(s).
This sequence of steps (Fig.2.6) shall be seen as an interactive and iterative process, allowing the scientist to explore relevant features or patterns in the data.
Figure 2.6: Visualization pipeline on desktop workstation
By allowing the fine-tuning of the visualization model until the desired result is obtained, we facilitate an exploration of the type ’what if’ analysis, which with enough computational power can lead to an enhancement in productivity through the reduction in time between optimization of visualization control parameters and viewing the results [48].
Figure 2.7: Diagram of a ’what if’ type of analysis system
2.3
3D Visualization
So far we have defined what visualization is and what it can be used for. It’s time now to describe how visualization tools of today typically perform the visualization of scientific data. Traditional tools used to rely on 2D images displayed on a monitor; this forced the viewer to use auxiliary visual cues in order to judge the position and depth of the data. Due to higher demands in terms of data quantity and complexity and improved visualization technologies, the standard is now try to create visualizations that are closer to real-world with 3D visualization. Both 2D and 3D visualization strategies have value for tasks involving 3D spatial data. Springmeyer et al. [87] observed that 2D views are often used to establish precise relationships, whereas 3D views
are typically used to gain a qualitative understanding of the data and present that understanding to others. In [93] it is referred that 3D visualization appears to greatly enhance the ease and efficiency of basic data interpretation, produces no more eye strain or headaches than 2D visualization and is overwhelmingly preferred by the viewers.
In the next sections we will provide a basic introduction to 3D Graphics core concepts and terminology as well as an introduction to the standard 3D graphics library for the web and lastly the common issues associated with 3D visualization systems.
2.3.1 3D Graphics
In his book, Tony Parisi uses the following concept of 3D graphics:
“3D computer graphics, or three-dimensional computer graphics (in contrast to 2D computer graphics), are graphics that use a three-dimensional representation of geo-metric data (often Cartesian) that is stored in the computer for the purposes of per-forming calculations and rendering 2D images. The resulting images may be stored for viewing later (possibly as an animation) or displayed in real time.” [72]
This notion can be break down into 3 components: [72]: • The data is represented in a 3D coordinate system (Fig.2.8);
• It is ultimately drawn (rendered) as a 2D image (for example in a computer monitor); • When dynamically updated, the image is rendered without a perceivable delay.
Figure 2.8: A 3D coordinate system
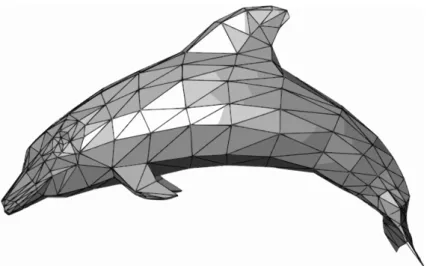
The most common way to draw 3D graphics is by the use of meshes (Fig.2.9). A mesh is an object composed for one or more polygonal shapes, constructed out of edges and vertices (x,y,z) defining the coordinate positions in the 3D space.
2.3 3D Visualization 17
Figure 2.9: A 3D mesh
The way that an object looks and the amount of light it reflects or emits can be emulated by the use of different textures and materials respectively. Changing the position of 3D objects is typically made through the use of transforms, which are operations that let you scale, rotate and translate a rendered mesh.
3D visualization systems typically use a camera to define where the user is positioned and oriented in the scene as well as its field of view. Another crucial aspect of the camera is to deliver the final rendered image of the 3D scene into the 2D viewport defined by the window or canvas. This two distinct tasks are normally matched by the use of two distinct matrix to represent the camera, the position/orientation matrix and the projection matrix, respectively.
The final image of a mesh can finally be rendered with the use of a shader (also known as pro-grammable shader), which is programmed to interpret the high-level structures defined (materials, lights, transforms and cameras) that the graphics hardware can’t process.
2.3.2 WebGL
Traditionally, 3D graphics were restricted to high-performance computers or dedicated game consoles, and required complex programming. However, nowadays hardware is shipped in every computer and mobile device and besides that, we also have the software required to render 3D accessible for free within web browsers. This is possible since the adoption of WebGL (Web Graphics Library) by current web browsers [33].
WebGL is a JavaScript API, based on OpenGL Embedded System (ES) 2.0 [55], that can be used to render high-performance interactive 3D and 2D graphics within any compatible web browser without the use of plug-ins [107].
The ease of use and accessibility of WebGL is what differentiates this technology from others. It produces an advance in usability with respect to the obsolete need to locally install desktop applications. WebGL is a multi-platform technology and because it is/produces web applications
it becomes more flexible in terms of fetching, handling and sharing resources [61], which are key points for scientific research.
The evolution of web standards and protocols1 preceded the appearance of WebGL 1.0. In 2011, this technology was developed and integrated into all of the Web standards of the browsers. In 2017 the second generation of WebGL, called WebGL 2.0, was released with support for real-time rendering and VR (Figure2.10) [107].
Figure 2.10: The History of Web3D
With the introduction of WebGL, the GLSL ES shader language was added to the technological stack of browsers. Figure2.11compares the traditional web page architecture (left side) with the web page architecture using WebGL (right side) [61].
Figure 2.11: Traditional web browser workflow (left side) and web browser workflow using We-bGL (right side)
2.3.3 Problems
Performing interactive 3D visualization on regular 2D screens is prone to problems. One of the typical issues pointed against 3D visualization is the difficulty for users to navigate in 3D spaces using 2D input devices (mouse, tablet, trackball etc.); correlating 2D movements in the real world to movement of objects in the virtual world can be challenging, especially if the planes of movement are not similar [39].
Other complain, referring mouse-based environments, is that the user may desire to do various click-and-drag operations including object selection, scene pan, scene zoom and scene rotation; 1As an example, VRML (Virtual Reality Markup Language) is a standard file format for representing 3D interactive vector graphics that evolved to X3D [12] with the development of XML technology.
2.4 Virtual Reality 19
The management of all those interactions - navigation technique - adds extra complexity to the model interpretation [10].
Another common issue of 3D visualization tools refers to selection and manipulation of ob-jects. Actions to select and navigate, usually overlap, (the common 2D click and drag interaction to create a selection bounding box overlaps the common drag action used for navigation), making the cognitive effort needed by the user increase due to the necessity of managing both operations [10].
Occlusion may also be a problem, as it can distort the user’s perception of the scene, mainly when the information space is dense [96].
3D perspective perception is a complaint as well. Figure2.12shows an example of a mislead-ing 3D chart. In 3D, objects closer to the user appear to be larger than those in the back.
Figure 2.12: Comparison of pie charts - Item C appears to be at least as large as Item A, whereas in actuality, it is less than half as large
2.4
Virtual Reality
The original term VR can be described as a computer generated 3D environment in which the user is being enveloped by, included in, and interacting with [52].
In [13], Bryson defines it as:
“VR is the use of computer technology to create the effect of an interactive 3D world in which the objects have a sense of spatial presence.” [13]
This definition, although correct, fails in distinguish VR from ’other realities’. To do so, we will resort to Paul Milgram et al. work on the "reality-virtuality continuum" [64] (Fig.2.13) which defines the terminology and distinguish the different disciplines of the field.
On the right extremity we have VR environment which correspond to the completely synthetic world, which may or may not mimic follow the real-world environment rules. In contrast, on the left side extremity of the spectrum we have the real-world environment. Augmented Reality is placed between real environment and virtual environment, closer to the former. Both of Aug-mented Reality and VR share interactivity and three dimensional images, between other factors. Yet, the differences between them are quite evident:
1. The level of immersion: Augmented Reality never lets a user lose a sense of presence in the real world as it just supplements some part of reality with virtual factors. In opposition, VR completely consists of computer-generated factors, which makes a user totally immersed in it.
2. Users movement: Augmented Reality typically requires portability of the system, while VR limits an user’s physical movement to specified region.
Figure 2.13: Milgram’s Reality-Virtuality Continuum
2.4.1 History
The present section will explore some of the historical milestones (see Fig.2.14) that have led to the advent of VR technologies.
The first attempts to immerse a person in a different place date back to the mid-19th century (1838) with the Charles Wheatstone stereoscope, which demonstrated that the brain processes the different two-dimensional images of each eye into a single three-dimensional object.
Another important contribution to the VR world happened in the mid-20th century (1950): the development of "the sensorama", an arcade-style theatre cabinet that would stimulate all the senses, by Morton Heilig. A decade later (1960), he produced the first monitor mounted on a VR head, the "telesphere mask". The headset provided stereoscopic 3D and wide vision with stereo sound, but without motion tracking.
Ivan Sutherland’s "ultimate display" was conceptualized 5 years later (1965) and is seen as the core blueprint of the concepts that today encompass Virtual Reality. It describes both concepts of a realistic virtual world, seen through an HMD, with enhanced 3D sound and tactile feedback and the ability to interact with it realistically and in real-time.
Between 1977 and 1982, the first finger tracking gloves for VR, called "Sayre", were invented by Daniel Sandin and Thomas DeFanti.
In 1989, NASA completed the creation of Project VIEW, a VR simulation used to train astro-nauts.
1991 is the year the first reliable HMD, priced less than 10,000 $, VR-2 Flight Helmet from Virtual Research Systems, was launched. In the same year, the CyberEdge Journal, the first com-mercial newsletter for the VR community, was published.
The end of the millennial and the beginning of century 21st, is marked by a decrease of com-mercial interest in VR technology reflected by the failures of SEGA’s VR glasses and Nitendo’s
2.4 Virtual Reality 21
Figure 2.14: The evolution of VR
Virtual boy, due to a mix of high cost, quality below expectations and reports of motion sickness and nausea.
It was not until recently that high-quality VR devices started to reach the consumer market at affordable prices; this change is seen as the main responsible of the recent emergence of VR (Figure2.15) .
2.4.2 Core Concepts
In order to achieve the psycho-physical experience of being present in a virtual environment, we need to integrate VR Hardware with a responsive computer-generated 3D environment. In 2003, Michael Zyda and Tom DeFanti [108] summarized four key concepts that should allow VR to provide that:
Figure 2.15: Monthly-connected Headsets on Steam (by # of headsets)
Virtual World The virtual world can be described as a collection of virtual objects in a virtual environment, the rules and the relationships governing those objects.
Immersion Immersion is possibly one of the more characteristic elements of VR and the one that mostly distinguishes it from other technologies. It generally refers to the emotional or mental state of feeling involved in the experience. This involvement can be both mental (being deeply engaged; suspension of disbelief) and/or physical (bodily entering into a medium, synthetic stimulus of the body’s senses via the use of technology).
It closely relates with the term "presence", which is the illusion of being in the place rendered by VR. Slater in [86] splits the concept of presence into place illusion (PI) - The user feels he is in the scene although cognitively he knows he’s not there - and plausibility illusion (Psi) - The user feels the scene is credible, although cognitively he knows it’s not true.
In order to achieve PI the VR should be perceived through natural sensorimotor contingencies, based on an active vision paradigm [31], this means, we should perceive the virtual world by using our own body, by performing actions like head turning, leaning, reaching, looking around and so on.
On the other hand, Psi requires that the environment responds accordingly to actions of the participants and that it generates spontaneous actions towards them (e.g when the environment includes virtual human characters, these should respond to the presence and actions of the users) .
When both PI and Psi operate, users will be likely to feel immersed in VR.
Sensory Feedback Sensory feedback is an essential ingredient to virtual reality. The VR sys-tem should provide direct feedback to the users based on their actions. The basic example of this behaviour happens with the visual sense that should receive feedback every time the user posi-tion changes. More advanced VR experiences can also provide haptic (touch), sound or smell experiences.
2.4 Virtual Reality 23
The body is a focal point at which PI and Psi are merged [86]. The action involved in looking at your own body and seeing your actions reflected in it provides a very powerful sense of owner-ship. This is the result of the correlation between proprioception (the ability to sense the relative positions of parts of our bodies and the amount of muscular effort being involved in moving them) and visual exteroception (collection of information regarding environmental characteristics) and results in the increase of both PI (your body is where you think it is) and PSI.
Interactivity Jonathan Steuer in [90] defines Interactivity as the extent to which users can par-ticipate in modifying the form and content of a real-time mediated environment; it depends on speed - the rate at which user actions are reflected in the virtual world - range - number of possible results for a user action - and mapping - a system’s ability to map its controls to changes in the mediated environment in a natural and predictable manner.
These concepts are common along the different types of VR systems [94]:
• Cave Automatic Virtual Environment (CAVE) - Uses rear-projections screens, each driven by one of a set of coordinated image-generation systems. It brings wider field of view and the ability to give a shared experience to a small group of users at cost of higher financial costs, higher space requirements and brightness, contrast and color limitations.
• Head-mounted VR (HMD) - Devices worn on the head or as part of a helmet that typically contains two optic displays (one for each eye) which stream data as a stereo scene to the user, from the perspective of each eye.
• Desktop VR .
2.4.3 Visualization in VR
The visualization of scientific data and phenomenons typically involves high-dimensional structures, represented in three-dimensional (3D) structures. The shapes and relations between the 3D structures are often extremely important. The work of Hubona et al. [45] suggests that user’s understanding of a 3D structure improves when they can manipulate the structures. VR can be used to display and manipulate those structures, providing spatial and depth cues that no other platform can. This allows rapid and intuitive exploration of the data [52]. When compared with traditional 3D visualization methods, VR provides easier navigation, more natural interactions, improved spacial awareness, smoother collaborations and more raw pixels which allow the users to make better use of the peripheral vision [101].
The proper employment of VR techniques within computational steering environments, tools that provide the ability to easily adjust simulations, can revolutionize the way the data are visual-ized. Figure2.16shows the visualization pipeline with VR integration.
Figure 2.16: Visualization pipeline with a VR component
2.4.4 Hardware
VR hardware should be able to provide the sensation of space and depth to the users. The hu-man visual system interprets the depth in images using both physiological cues (accommodation, convergence, binocular parallax, and monocular motion parallax) and psychophysical cues (retinal image size, linear perspective, texture gradient, overlapping, aerial perspective shading and shad-ows) [69]. In regular 3D graphics, monocular depth cues such as perspective, shading, shadows and texture gradients are the ones often used. Whereas, in immersive virtual reality, stereo display and head tracking are used to provide the binocular and motion parallax.
Stereo display (Fig.2.17) corresponds to the strategy of displaying a separate image for each eye. This process can be performed with many techniques, being the more popular ones, active stereo and passive stereo. In active stereo, both images are projected alternatively at a high fre-quency and at the same time the glasses obscure the light directed to one of the eyes. As a result, each eye of the user only sees the image intended to that eye. While in passive stereo, the two images for the left and right eyes are projected on a metallic screen by two distinct projectors with polarized filters mounted on them. By using polarized glasses of the user ends up seeing the image from one projector in one eye and from the other projector in the other eye [52].
The head tracking is used to simulate motion parallax by controlling the viewpoint on the virtual world accordingly to the spatial position and orientation of the user’s head.
2.4 Virtual Reality 25
Headset Platform Positional
Tracking Controllers
Controllers
Positional Tracking Optics
Refresh
Rate Resolution Price(in Jul/2020)
HTC Vive Index PC 3 3 3 130o 90 Hz 2880x1600 1100e
HTC Vive Focus Standalone 7 3 7 110o 75 Hz 2880x1600 800e
HTC Vive Cosmos PC 3 3 3 110o 90 Hz 2880x1700 700e
Oculus Quest Standalone 3 3 3 100o 72 Hz 2880x1600 500e
Oculus Go Standalone 7 3 7 101o 72 Hz 2560x1440 140e
Oculus Rift PC 3 3 3 110o 80 Hz 2560x1440 490e
Samsung Gear VR Android 7 3 7 101o 60 Hz 2560x1440 100e
Google Daydream Android 7 3 7 90o 60 Hz 2560x1440 60e
Sony PlayStation VR PlayStation 3 3 3 100o 90-120 Hz 1920x1080 200e
Table 2.1: Headsets Comparation
2.4.4.1 Head Mounted Displays
The classical way to provide the aforementioned cues is through Head Mounted Displays (HMD). An HMD displays images, one for each eye, forming a stereo scene. Each image is calcu-lated and provided separately with the correct perspective of position of each eye with respect to a mathematical description of a three-dimensional virtual scene. Generally they can be split into two categories: high-end HMDs which offer a comfortable user experience with an independent screen screen, complex device structure and advanced technology and mobile-based HMDs that have a simpler structure and are dependent entirely on a smartphone to display stereoscopic animations in VR [105].
There are many VR headsets available on the market, according to [22] and [1], some distin-guishing features are:
• Tracking - Having six degrees of freedom (6DoF) (positional tracking - user can move in space) or only three degrees of freedom (rotational tracking - user can only rotate).
• Refresh Rate - The number of times the display updates with new images (higher refresh rates result in smoother experiences).
• Latency - The time interval between the simulation and response (should be less than 20ms). • Persistence - The time interval to switch between states, pixel on or of (should be less than
3ms).
• Resolution - The number of distinct pixels in each direction (at least 1000x1000 per eye). • Optics - The wideness of the field of view, the ability to calibrate (focus) and the comfort of
the eyebox.
• Power Supply - The device works as a standalone device or is powered by a PC or mobile. A summary of some of the most popular headsets of today and a subset of the aforementioned features in addition to price and the existence of controllers with 6DoF is available on figure2.1.
At the time of writing, the VR industry seems to be trending towards having positionally-tracked headsets with positionally-positionally-tracked controllers.
Feature Name Chrome Firefox Reality Oculus Browser Samsung Internet
WebXR Core Module Supported
Chrome 79+ Supported
Supported 7.0+
Supported 11.2+
WebXR AR Module Experimental Supported Not Supported Supported
11.2+
WebXR Gamepads Module Supported
Chrome 79+ Supported
Supported 7.1+
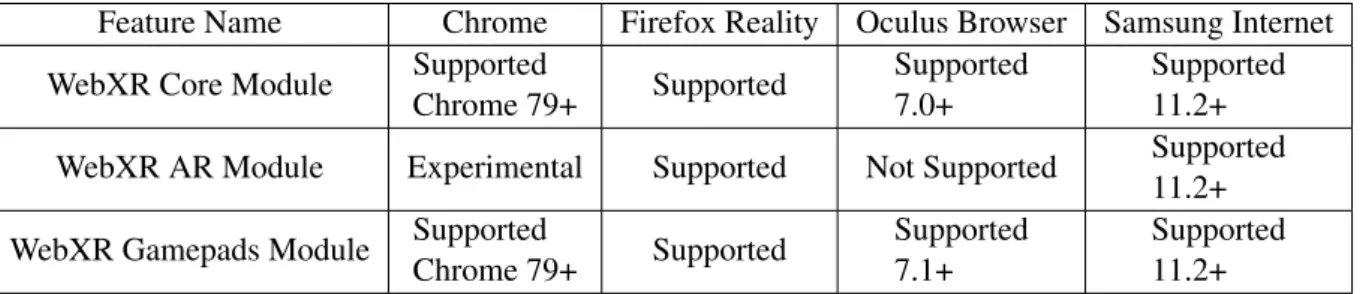
Supported 11.2+ Table 2.2: Support Table for the WebXR API
2.4.4.2 Projection-based Displays
This technology displays the stereo images via projectors, compared to HMDs it provides a larger field of view, with higher resolutions, and usually better image quality. It also allows multiple users to be immersed at the same time. It is the technology used by CAVE-like systems. This way to visualize VR provides a complete surrounding projection.
2.4.5 Software
Previous sections defined what VR is and what hardware is typically used. Next sections will try to describe how to develop for VR these days.
2.4.5.1 WebXR
We will start this section by describing what are the options when deciding to develop VR applications for the web.
WebXR is the API that allows the development of VR and AR Web applications. It supersedes the previous standard: WebVR. Both WebXR and WebVR were invented with the intention of simplifying the development and experience of VR applications in web browsers [92]. In com-paration to WebVR, WebXR combines VRand Augmented Reality into a single API, supports 6 degrees of freedom tracking, has a better management of VR controllers and shows rendering improvements [9]. WebXR applications are built to be seen and reproduced by any VR headset and by working on browsers, where the WebXR API is supported. It allows the users to access applications without the need to install any additional software. At the time of writing, the support for the the WebXR device API is represented in table2.2. The WebXR Gamepads Module is for accessing the state of buttons, triggers, thumbsticks, and touchpads associated with VR(VR) and augmented reality (AR) motion controllers on the Web. The WebXR Augmented Reality Module extends the WebXR Device API to expose the ability to create a basic augmented reality (AR) session. The WebXR Core Module covers what WebVR used to provide (managing the selection of output devices, render the 3D scene to the chosen device at the appropriate frame rate, and manage motion vectors created using input controllers).
2.4 Virtual Reality 27
Frameworks To facilitate and quicken the development of applications, typically developers resort to frameworks. There are only few WebXR ready frameworks existent today: A-Frame and React360. This frameworks eliminate the complexity of dealing with WebXR directly and allow a more efficient use of JavaScript code. A brief comparation between this frameworks, based on [49] [53], will happen in this section.
A-Frame2is an open source framework able to create VR experiences with HTML. It’s based on Three.js3and encapsulates the complicated WebGL and JavaScript code into HTML. It is seen as the most beginner friendly framework available for web developers of VR. A feature that sets A-Frame apart from many other frameworks is its visual inspector (Fig.2.18). It is designed to inspect and tweak A-Frame scenes at runtime [26].
Figure 2.18: A-Frame online inspector
React 3604is a framework designed to create 3D and VR experiences. It is built on the top of React, a popular JS library, and that makes it preferable for websites that have many 2D and 3D elements. However if the application deals with many 3D objects, react 360 is not a fit.
More generic JavaScript libraries such as Three.js and Babylon.js5were also briefly considered as auxiliary tools, due to its usefulness in building animated 3D computer graphics. Three.js is a JavaScript library designed for 3D rendering. It provides developers with complete control over 3D objects and empowers them to create more complex WebXR experiences. Has an extensive documentation and the largest community in this list of frameworks. Babylon.js is a JavaScript-based WebGL library similar to Three.js. Originally created for game development, is a full-featured framework, with a dedicated testing playground and beginner-friendly abstractions. It it is fully capable of creating WebXR experiences.
2https://aframe.io/ 3https://threejs.org
4https://facebook.github.io/react-360/ 5https://www.babylonjs.com/
Game Engine Compatibility Steam VR
Compatibility
Oculus VR WebXR Compatibility
Unity Yes Yes Limited
Unreal Engine Yes Yes No
Table 2.3: Game Engines Compatibility Comparation
2.4.5.2 Game Engines
If the web is not the main target, one should consider the use of game engines when looking for ways to develop VR applications. For this purpose, both Unity3D6and Unreal Engine7 will be briefly described with focus on VR as the end target. Unity3D is a development engine that was first released in 2005 and supports three development languages including C#, UnityScript and Boo. Unreal Engine has a long history as a game engine dating back to 1998, is an open-source engine and only supports C++. Both Unity and Unreal Engine have assets markets that allow purchase of pre-made 3D models, objects and environments. Both have an extensively developed documentation on how to use the engines and on XR development. In terms of graphics department, Unreal Engine 4 has a few advantages over Unity. When it comes to projects that use these tools, C4X Discovery uses Unreal Engine 4 to visualize molecular data in VR [35] and Audi, a german automobile giant, developed a modular VR training with Unity, for example.
One concern with the use of game engine refers to the compatibility with different headsets. The development of VR apps for specific headsets relies on the use of third-party software devel-opment kits (sdk) within the game-engine. By default Oculus SDK works only for Oculus devices; targeting Open VR SDK (Steam VR) instead should work for headsets of different brands (Oculus, Mixed Reality, Vive, etc). Table2.3summarizes the compatibility of the studied game engines.
2.4.6 Interaction Techniques
In this section, we will describe the existing techniques to provide basic interaction for virtual environments, as well as some typical problems with them. We can divide interaction techniques into two categories: navigation and interaction with objects.
2.4.6.1 Navigation
For most scientific visualizations, there is no natural navigation scheme, especially for worlds where you don’t normally walk or fly through. This makes choosing the right navigation technique a crucial decision. There are many different techniques of navigation to be considered:
I Real Walking
In 1999, Fred Brooks et al. [100] pointed out that physical movement powerfully helps the illusion of presence. Real walking allows you to feel kinesthetically how big the spaces are making it better
6https://unity.com/
![Figure 2.1: Multiscale levels of investigation for studying the brain. Adapted from [21]](https://thumb-eu.123doks.com/thumbv2/123dok_br/18909639.936185/29.892.251.680.206.571/figure-multiscale-levels-investigation-studying-brain-adapted.webp)


![Figure 3.1: Example of biophysics visualization application (HNN[68]): Setting model parame- parame-ters.](https://thumb-eu.123doks.com/thumbv2/123dok_br/18909639.936185/58.892.212.642.527.770/figure-example-biophysics-visualization-application-setting-parame-parame.webp)
![Figure 3.3: HNN[68]: Simulation results.](https://thumb-eu.123doks.com/thumbv2/123dok_br/18909639.936185/59.892.255.682.146.383/figure-hnn-simulation-results.webp)
