Universidade do Algarve
Faculdade de Engenharia de Recursos Naturais
T
T
h
h
y
y
r
r
o
o
i
i
d
d
A
A
x
x
i
i
s
s
d
d
i
i
s
s
r
r
u
u
p
p
t
t
i
i
o
o
n
n
b
b
y
y
g
g
o
o
i
i
t
t
r
r
o
o
g
g
e
e
n
n
s
s
:
:
a
a
m
m
o
o
l
l
e
e
c
c
u
u
l
l
a
a
r
r
a
a
n
n
d
d
f
f
u
u
n
n
c
c
t
t
i
i
o
o
n
n
a
a
l
l
a
a
p
p
p
p
r
r
o
o
a
a
c
c
h
h
Dissertação de Mestrado Integrado em Engenharia Biológica
Eduarda Mazagão Guerreiro
Faro, 2008
Universidade do Algarve
Faculdade de Engenharia de Recursos Naturais
Thyroid Axis disruption by goitrogens: a molecular
and functional approach
Dissertação de Mestrado Integrado em Engenharia Biológica
Dissertação orientada por
Supervisor: Professora Dr. Deborah Power
Co-Supervisor: Dr. Patrícia Isabel Pinto
Eduarda Mazagão Guerreiro
Faro, 2008
Acknowledgments
I would like to express my gratitude to Professor Dr. Deborah Power for giving me this opportunity and also thank her and Dr. Patricia Pinto for guiding me along this work, for their support and guidance.
I would also like to acknowledge Angela Ramos, Rita Costa, Nádia Silva and Cristina Rocha for all the help offered and for their company.
Thank you to the Molecular and Comparative Endocrinology group for accepting me and allowing me to develop this thesis.
I also want to express my gratitude to my family and to all my friends, old and new!
I. Abstract
The number of chemicals to which organisms are exposed as a consequence of environmental contamination by Industry and Agriculture is increasing. However, there is a severe lack of information about the biological effects of many frequently occurring chemicals.
The present thesis is focused on the effects on the thyroid tissue of adult zebra fish of the antimicrobial agent Triclosan (TCS) which is frequently found in personnel hygiene products and foodstuff. After 21 days exposure of adult zebrafish to TCS (100 mg/kg/day) and the thyroid disruptor, Propylthiouracil (PTU, positive control) (5 mg/kg/day), histological observation of thyroid tissue in sections of the pharynx was performed. These observations indicated significant (p<0.05) increase in follicle areas coupled with the decrease of thyrocyte height (thyrocyte inactivation) in TCS treated zebrafish. In the PTU treated zebrafish only a reduction in thyrocyte activity was observed.
In order to understand how the test chemical TCS might bring about its effect, the gene expression of Thyroglobulin (Tg), Thyroid Peroxidase (TPO), Sodium-Iodine Symporter (NIS) and Cathepsin B (CtsB) together with Thyroid Stimulating Hormone (TSH) in whole zebrafish head was determined using quantitative real-time Polymerase Chain Reaction (qRT-PCR). After sample normalization against the zebrafish spermatogenic glyceraldehyde-3-phosphate dehydrogenases (GAPDH-2), validated as reference gene for this study, a significant increase (p<0.05) in expression of TSH and NIS were detected. The expression of pituitary TSH increased in the PTU and TCS groups compared to the control group, while NIS expression only increased in the TCS treated zebrafish. For the remaining genes, no significant changes in gene expression were detected, maybe as a consequence of high individual variation.
In summary, the results of the study indicate that the drug TCS at a concentration of 100 mg/kg/day for 21 days appears to influence TH synthesis. The increase in TSH and NIS transcription coupled to the inactivation of the thyroid tissue observed in this work, are indicative of effects caused by a reduction in circulating THs. It remains to be established the mechanism by which TCS reduces thyroid tissue activity in adult zebra fish.
Key works: Triclosan, Propylthiouracil, thyroid disruptor, follicle inactivation, qPCR,
II. Resumo
O número de químicos aos quais os organismos estão expostos diariamente por contaminação ambiental causada pela indústria e/ou agricultura tem vindo a aumentar. Há, no entanto, uma grande falha na informação sobre os efeitos biológicos destes contaminantes.
Esta tese foca-se nos efeitos do agente antimicrobiano Triclosan (TCS), no tecido da tiróide de peixe zebra adulto. Após 21 dias de exposição dos animais, ao TCS (100 mg/Kg/dia) e ao agente Propiltiouracil (PTU, controlo positivo) (5 mg/Kg/dia) foram efectuadas observações histológicas em secções da faringe. Estas observações indicaram um aumento significativo (p<0.05) no tamanho dos folículos assim como inactivação dos tirócitos no grupo exposto ao TCS e redução da actividade dos tirócitos nos peixes tratados com PTU.
Para compreender o modo de acção dos compostos, a expressão dos genes Tiroglobulina (Tg), Tiróide Peroxidase (TPO), Transportador Sódio-Iodo (NIS) e Catepsina B (CtsB), assim como Hormona Estimuladora da Tiróide (TSH), em toda a cabeça de peixe zebra foi estudada recorrendo à técnica de PCR quantitativo em tempo real (qRT-PCR). Após a normalização da amostra contra o gene gliceraldeido-3-fosfato dehidrogenase espermatogénico (GADPH-2), validado como gene referência neste estudo, detectou-se um aumento significativo (p<0.05) na expressão dos genes TSH e NIS. A expressão relativa da TSH aumentou nos grupos TCS e PTU, enquanto que a expressão do NIS mostrou aumento significativo apenas no grupo tratado com TCS. Nas restantes proteínas não foram detectadas alterações significativas das expressões possivelmente pela variação biológica entre os indivíduos.
Os resultados obtidos indicam que o composto TCS, com uma concentração de 100 mg/kg/dia por 21 dias, parece influenciar a síntese das hormonas da tiróide. O aumento da transcrição de TSH e NIS assim como a indução de inactividade do tecido da tiróide, observados neste trabalho, são efeitos indicativos da redução das hormonas da tiróide em circulação. É ainda necessário estudar qual o mecanismo através do qual o TCS reduz a actividade da tiróide nos peixes zebra adultos.
Palavras-chave: Triclosan, Propiltiouracil, hipotiroidismo, inactivação folicular, qPCR,
III. Abbreviations
18 S 18 S ribosomal subunit
ANOVA Analysis of variance
APES Aminopropyltriethoxysilane
bp Base pair
cDNA Complementary DNA
Ct Threshold cycle
CtsB Cathepsin B
CtsBa Cathepsin B, isoform a
DEPC Diethylpyrocarbonate
DIT Diiodotyrosine
DNA Deoxyribonucleic acid
DNase Deoxyribonuclease
dNTP Deoxyribonucleotide triphosphate
ED Endocrine disruptor
EDTA Ethylenediaminetetraacetic acid
GAPDH-2 Spermatogenic glyceraldehyde-3-phophate dehydrogenase
gDNA Genomic DNA
HPT axis Hypothalamic-pituitary-thyroid axis
IPTG Isopropyl-beta-D-thiogalactopyranoside
LB Broth Luria-Bertani broth
MCE Group Molecular and comparative endocrinology group
MIT Monoiodotyrosine
MgCl2 Magnesium Cloride
MMLV-RT Mouse moloney murine leukemia virus reverse transcriptase
mRNA Messenger ribonucleic acid
NIS Sodium-Iodine symporter
PCP Personal care products
pDNA Plasmid DNA
PFA Paraformaldehyde
PTU Propylthiouracil
qRT-PCR Quantitative real-time Polymerase Chain Reaction
RNA Ribonucleic acid
RNase Ribonuclease
rpm Rotation per minute
RT-PCR Reverse transcriptase – polymerase chain reaction
SDS Sodium dodecyl sulphate
SEM Standard error
SQ Starting quantity T3 Triiodothyronine T4 Thyroxine Ta Annealing temperature TCS Triclosan Tg Thyroglobulin TH Thyroid hormone Tm Melting temperature
TPO Thyroid peroxidase
TSH Thyroid stimulating hormone
IV Image list
Page
Fig 1.1 Schematic representation of the relationship of endocrine organs with the body
tissues. As seen in this scheme of the endocrine system, the organs share a
rather complex relationship………... 1
Fig 1.2 Molecular structure of the two thyroid hormone bioactive forms, thyroxine and
triiodo-L-thyronine……… 4
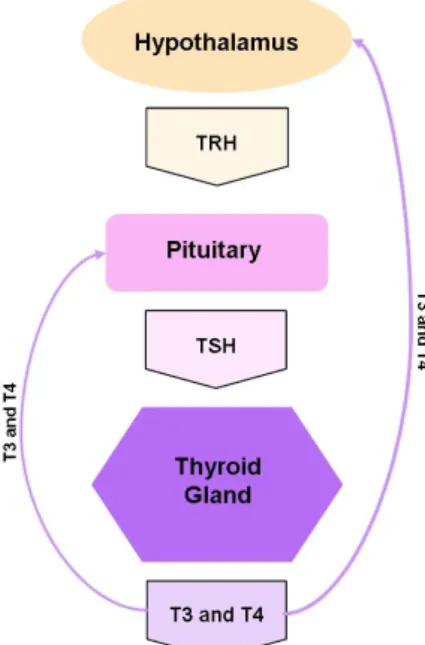
Fig 1.3 Schematic representation of the basic elements of the
Hypothalamic-Pituitary-Thyroid (HPT) Axis: main glands and respective hormones. TRH is secreted by the hypothalamus and stimulates the pituitary to secret TSH, which then stimulates the thyroid to release T3 and T4. These hormones in turn will stimulate the target cells and regulate by negative feedback TRH and TSH
synthesis………. 6
Fig 1.4 Representation of thyroid tissue showing the thyroid follicles containing
colloid which is enclosed by a monolayer of epithelial cells………... 7
Fig 1.5 The thyroid follicular cell and the process of synthesis and secretion of THs.
These events may occur simultaneously in the same cell………. 8
Fig 1.6 Schematic representation of T3 and T4 production and liberation through Tg
solubilisation and degradation by the activity of proteolytic enzymes such as
Cathepsins B, L and K, in the thyroid follicular cells………... 10
Fig 1.7 Schematic representation of the normal response of a cell to a hormone (left)
and for the some of the endocrine disruption mechanisms – hormone mimic
(middle) and hormone blockage (right)……… 11
Fig 1.8 3D Molecular structure of the thyroid disruptor PTU………... 13
Fig 1.9 3-D molecular structure of the thyroid disruptor Triclosan………. 14
Fig 1. 10 Chemical structures of the THs (T3 and T4) and of the goitrogen TCS………. 15
Fig 1.11 Danio rerio (zebrafish)………. 17
Fig 2.1 The fluorescence signal increase throughout the PCR cycles due to the DNA
amplification………. 34
Fig 2.2 Schematic representation of the functioning of the SYBR Green dye and
TaqMan probe. SYBR Green binds to the dsDNA as it is being synthesised, and starts to emit fluorescence. The TaqMan probe binds to the DNA with the primers and as the fluorophore (green) is excited, it transfers the energy to a quencher molecule (orange) present in the probe; as the extension occurs, the probe is broken down, the fluorophore is released emitting
Fig 2.3 Comparison of fluorescence between two amplification plots for the same
amplicon, with CTa = 17 and CTb = 22. The difference between the samples CT is due to the fact that sample b has less starting material (sample b = 1:10 sample a). The horizontal line (orange) is the threshold of the
reaction………. 35
Fig 3.1 Thyroid tissue histology in treated and control fish. A – Scheme (photoshop
rendered of a low magnification photograph) of the region in which the thyroid follicles were observed. Sections were prepared and stained with Cleveland-Wolfe trichrome and when the aorta was visible and the heart evident follicles were analysed in the relevant sections. The scale bar corresponds to 500 m). B - Thyroid tissue stained with Cleveland-Wolfe trichrome from the different treatment groups, (a) - control, (b) - PTU and (c) - TCS, Note the orange staining colloid (3) in the centre of thyroid follicles (2) which are distributed in connective tissue surrounding the aorta (1). The thyrocytes (4) are evident as a layer of cells surrounding the colloid and isolate the follicle lumen from the
surrounding tissue. The scale bar corresponds to 100 µm………... 43
Fig 3.2 RT-PCR products with gene specific primers from zebrafish cDNA (head) in
1.5% agarose gel stained with ethidium bromide, using optimized conditions. The amplified genes were (a) TPO – Ta = 60ºC, [MgCl2] =1mM and 40 cycles; (b) CtsBa - Ta = 59,3ºC, [MgCl2] =2mM and 30 cycles; (c) NIS - Ta = 52ºC, [MgCl2] =2,5mM and 30 cycles, (d) TSH - Ta = 63,4ºC, [MgCl2] =2mM and 30 cycles and (e) Tg - Ta = 60,4ºC, [MgCl2] =2mM and 30 cycles and (f) GADPH-2 - Ta = 60ºC, [MgCl2] =1mM and 40 cycles. Sizes of the bands were compared with the sizes of the 1 Kb Plus DNA Ladder (Invitrogen) (M), which are indicated in base pairs (bp) in the left panel. For the genes CtsBa and NIS, (b and c) the PCR reactions resulted on several fragments; the fragments with the expected size are the most intense and are signalled with the arrow
head……… 45
Fig 3.3 Mean starting quantities (ng) for 18S and GADPH-2 genes for the different
treatments (Control n =5, PTU n = 6 and TCS n = 5). The different letters (a and b) are indicative of significant statistical differences (P <0.05) between the treatment groups, evaluated by a One Way ANOVA of the variable, followed
(for 18S) by a Tukey test………... 47
Fig 3.4 Dispersion (dots) and mean relative expression (gray bars) of the several genes
analysed (Tg, TSH, TPO, NIS and CtsBa) normalized with GADPH-2 (SQ gene/SQ GADPH-2) for the treatments control (n = 5), PTU (n = 6) and TCS (n =5) and respective SEM (bars). The different letters (a and b) are indicative of significant statistical differences (P<0.05) between the treatment groups, evaluated by a One Way ANOVA of the log10 variable, followed by a Tukey
V Table list
Table 2.1 Total body weight (g) for the different groups (n=10) acquired prior to acclimatization. 20
Table 2.2 Primer sequences for 18S PCR reactions, forward (Fw) and reverse (Rw),
previously designed by a member of the Molecular and Comparative
Endocrinology (MCE) group 27
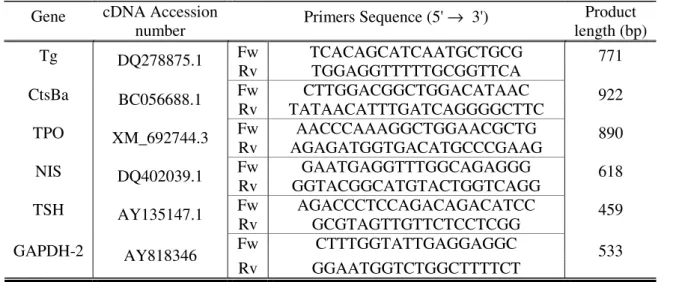
Table 2.3 cDNA accession numbers acquired from the in silico studies, primer sequences
for RT-PCR reactions, forward (Fw) and reverse (Rw), complementary to the cDNA sequences of the genes encoding for the proteins Tg, CtsBa, TPO, NIS and TSH. The amplicon (PCR product) length is indicated in base pairs (bp) 28
Table 2.4 PCR conditions for the reaction mix and cycling conditions used in the PCR of
the different target genes. For the reaction mix the values are the volumes in µL for one reaction of 25µL. The DNA template was 2µL of cDNA from control fish or 5µL of a PCR product previously obtained from 2µl of cDNA using the same PCR conditions (re-amplification, samples marked with *) 29
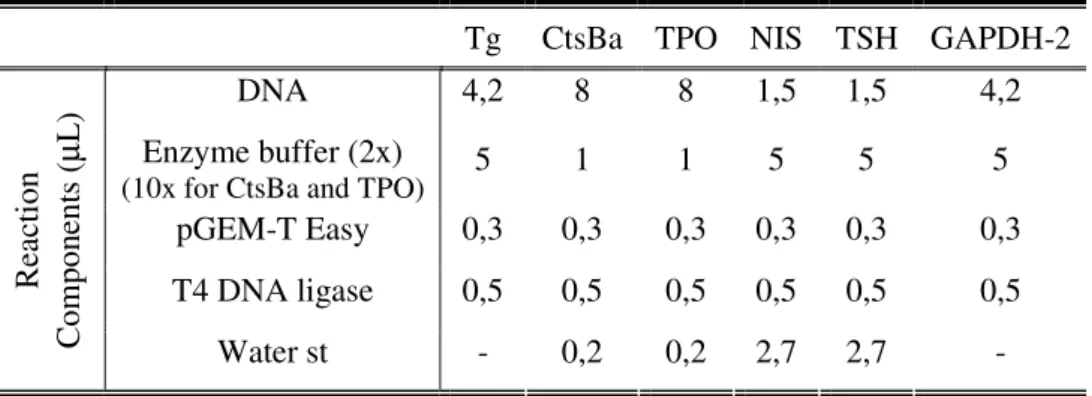
Table 2.5 Reaction components for the ligation of the PCR products of the several genes
to the plasmid pGEM-T Easy (indicated in volume in µL, in a reaction with
10µL in total) 31
Table 2.6 Reagents for the enzymatic digestion of pDNA (insert isolation) containing
each target gene indicated in µl per digestion (EcoRI and SalI from Promega). 33
Table 2.7 Sequences for forward (Fw) and reverse (Rw) primers designed for qPCR using
Beacon Designer (Premier, Biosoft International), complementary to the cDNA sequences of the genes encoding for the proteins Tg, CtsBa, TPO, NIS and TSH. The amplicon (or product) length in base pairs (bp) is indicated 37
Table 2.8 Enzymes and the enzyme reaction components in µl used for the linearization
of the different pDNA to be used for the standard curve of each gene in qPCR. Enzymes and buffers were purchased from Promega (D, H or MC=Multi Core) 39
Table 3.1 Mean body weight (g) and length (cm) (± SEM) for the different treatment
groups after the 21 days exposure to the treatments 42
Table 3.2 qRT-PCR efficiencies for the different genes determined for the standard curve
(with dilution series from 0.5 ng/µl to 0.5 fg/µl of cloned cDNA) and for the cDNA dilution series (1:5 to 1:3125). Ct values for the control cDNA for an
VI Table of contents
I. ABSTRACT ... II II. RESUMO ...III III. ABBREVIATIONS...IV IV IMAGE LIST ...VI V TABLE LIST ...VIII
1. INTRODUCTION ... 1
1.1 THE ENDOCRINE SYSTEM... 1
1.2HORMONES... 2
1.2.1 Hormones with intracellular receptors ... 3
1.2.2 Hormones with extracellular receptors... 3
1.2.3 Control of Endocrine Activity ... 4
1.3 THYROID HORMONES... 4
1.3.1 TH regulation ... 5
1.3.2 Thyroid tissue... 7
1.3.3 Hormone Synthesis... 8
1.3.4 Thyroxine production and release ... 9
1.4 ENDOCRINE DISRUPTORS... 11
1.4.1 Thyroid disruptors – Goitrogens ... 11
1.4.1.1 Anti-thyroid drugs ... 12
1.4.1.1.1 Propylthiouracil (PTU)... 12
1.4.1.2 Environmental thyroid disruptors... 13
1.4.1.2.1 Triclosan ... 14 1.5OBJECTIVE... 15 1.5.1 Goitrogen choice... 16 1.5.2 Experimental Model ... 16 2. METHODOLOGY... 18 2.1EXPERIMENTAL CONDITIONS... 18 2.1.1 Goitrogen dose ... 19 2.1.2 Drug administration ... 19 2.2SAMPLING... 20 2.3HISTOLOGICAL ANALYSIS... 20 2.3.1 Tissue processing... 21 2.3.2 Staining ... 21 2.4MOLECULAR ANALYSES... 22 2.4.1 RNA extraction ... 23
2.4.2.1 RNA quantification ... Erro! Marcador não definido. 2.4.2. Removal of genomic DNA contamination ... 24
2.4.3 Complementary DNA (cDNA) synthesis... 25
2.4.4 In silico identification of predicted cDNA sequences... 25
2.4.5 Polymerase Chain Reaction (PCR)... 26
2.4.5.1 18S ribosomal (r)RNA PCR ... 27
2.4.5.2 Primer design for target gene cloning ... 27
2.4.5.3 Optimization of PCR conditions ... 28
2.4.6 Cloning and transformation... 30
2.4.6.1 Cloning ... 30
2.4.7 Real-Time PCR ... 33 2.4.7.1 Primer design... 36 2.4.7.2 qPCR reactions... 37 2.4.7.3 qPCR optimizations ... 38 2.4.7.4 Normalization ... 40 2.5STATISTICAL ANALYSIS... 40 3. RESULTS... 42 3.1HISTOLOGICAL RESULTS... 42 3.2MOLECULAR RESULTS... 45
3.2.1 Tissue gene expression ... 45
3.2.2 Validation of internal reference genes for qRT-PCR and assay characterization. 46 3.2.2.1 Reference gene validation... 47
3.2.2.2 Changes in Gene Expression ... 48
4. DISCUSSION ... 50
5. CONCLUSION... 58
6. REFERENCES ... 59 ANNEX 1: SOLUTIONS ... A ANNEX 2: APES TREATMENT OF SLIDES... D ANNEX 3: COMPETENT BACTERIA ...E ANNEX 4: pGEM-Teasy RESTRICTION MAP ...F ANNEX 5: NIS ALIGNMENT... G ANNEX 6: TSH ALIGNMENT ... H ANNEX 7: TPO ALIGNMENT ...I ANNEX 8: Tg ALIGNMENT... K ANNEX 9: CtsBa ALIGNMENT...L ANNEX 10: GADPH-2 ALIGNMENT ... M
1.
Introduction
1.1
The Endocrine System
The tissues and organs of the vertebrate body cooperate to maintain homeostasis of the body’s internal environment, through the actions of multiple regulatory mechanisms that involve many organs of the body [1]. The endocrine system regulates many of these mechanisms.
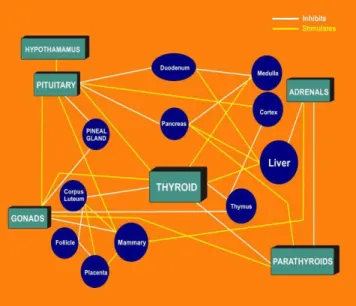
The endocrine system sends information to the tissues using chemical substances released by the endocrine glands. These substances – hormones – are released into the circulatory system and transported to all parts of the body [2] thus establishing a complex interaction between organs, as represented in figure 1.1.
Fig 1.1: Schematic representation of the relationship of endocrine organs with the body tissues. As seen in this
scheme of the endocrine system, the organs share a rather complex relationship. Taken from [3].
A hormone is traditionally defined as a substance that 1) is produced in small amounts by a set of cells in endocrine glands, 2) is secreted into the interstitial spaces, 3) enters into the circulatory system that carries it to other parts of the body, and 4) affects a limited number of cells, which are called target cells [2, 4]. However, it is now known that they may move by circulation in blood, other body fluids or diffuse between
cells, and may act in distant organs in the body (endocrine action) or the chemical regulatory molecules may be released and act within an organ regulating the same cell type which produced it (autocrine) or act in different tissues of the same organ (paracrine) [1].
The response of target cells to the hormone to which they are sensitive is due to the presence of hormone-specific receptors on the cells. These receptors might be found on the surface, extracellular receptors, or in the cytoplasm or nucleus of the cell,
intracellular receptors. The type of hormone and the kind of receptors to which the
hormone is associated, depends of the chemical nature of the hormone molecule.
1.2 Hormones
Nature uses a diverse spectrum of molecules as hormones, and, like all molecules, hormones are synthesized, exist in a biologically active state for a time, and then degrade or are destroyed [4].
Hormones belong to four different chemical categories:
1. Polypeptides. These hormones are composed of chains of amino acids (aa) that are shorter than about 100 aa.
2. Proteins. These are composed of a polypeptide significantly longer than 100 aa, that might be glycosylated.
3. Amines. These are derived from the aa tyrosine and tryptophan. 4. Steroids. These are lipidic hormones derived from cholesterol [1].
In a more general approach, hormones can be divided into those that are lipophilic (lipid soluble) and those that are polar (water-soluble). The lipophilic hormones – all of the steroid hormones and thyroid hormones – as well as other lipophilic regulatory molecules can easily enter cells through the lipid portion of the cell membrane. Water-soluble hormones, in contrast, cannot pass through cell membranes, and must regulate their target cells through different mechanisms at the cell surface [1].
1.2.1 Hormones with intracellular receptors
Hormones are found dissolved in plasma and are transported either in a free form or bound to plasma proteins [2] – carrier proteins, some being specific for a certain hormone. Lipophilic hormones are mainly transported bound to carrier proteins, as they do not dissolve in the plasma. When the hormones arrive at their target cells, they dissociate from carriers and diffuse through the plasma membrane. The hormone binds to specific intracellular receptors (the nuclear receptors) in the cytoplasm or the nucleus, and hormone-receptor complexes then act as ligand-dependent transcription factors in the nucleus, by binding to promoter regions of responsive genes and stimulating/repressing their transcription [1, 4]. The production of these responsive-genes and their protein products will then lead to the final effect of the hormone.
1.2.2 Hormones with extracellular receptors
Hormones that are too polar to cross the plasma membranes of their target cells include all of the peptide, amino acid derivatives and glycoprotein hormones. These hormones bind to receptor proteins located on the outer surface of the plasma membrane [1], initiating a series of events that are mediated by second messenger molecules [1, 4]. Second messengers include organic molecules and Ca2+, and changes in their concentrations in response to hormone-receptor binding trigger a cascade of intracellular signalling responses, generally involving the activation of multiple effector enzymes such as protein kinases, which lead to the hormone’s physiological effect.
The binding of a water-soluble hormone to its receptor is reversible and usually very brief. After the hormone binds to its receptor and activates a second-messenger system, it dissociates from the receptor and may travel in the blood to another target cell somewhere else in the body. Eventually enzymes (primarily in the liver) degrade the hormone by converting it into inactive derivates [1].
1.2.3 Control of Endocrine Activity
The physiologic effects of hormones depend largely on their concentration in blood and extracellular fluid. Thus, precise control over circulating concentration of hormones is therefore crucial [4].
The concentration of hormone that reaches target cells is determined by:
- Rate of production: the synthesis and secretion of hormones is the most highly regulated aspect of endocrine control. Such control is mediated by positive and
negative feedback circuits.
- Rate of delivery: an example of this effect is blood flow to the target organ or to a group of target cells – high blood flow delivers more hormone than low blood flow.
- Rate of degradation and elimination [4].
Feedback circuits are at the root of most control mechanisms in physiology, and are particularly prominent in the endocrine system. Instances of positive feedback certainly occur, but negative feedback is much more common [4]. Negative feedback ensures that the cellular concentrations of products determine the rates of their formation, thus ensuring that the cell synthesizes only as much as it needs [5].
1.3
Thyroid hormones
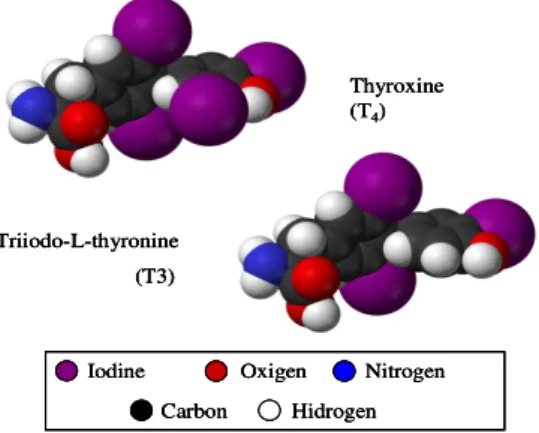
Thyroid hormones (TH) are small liposoluble molecules with two bioactive
forms, tetraiodo-L-thyronine (thyroxine, T4) and triiodo-L-thyronine (T3), which
contain four or three iodine atoms respectively [6], as showed in figure 1.2.
Thyroxine (T4) Triiodo-L-thyronine (T3) Iodine Oxigen Hidrogen Carbon Nitrogen Thyroxine (T4) Triiodo-L-thyronine (T3) Thyroxine (T4) Triiodo-L-thyronine (T3) Iodine Oxigen Hidrogen Carbon Nitrogen Iodine Oxigen Hidrogen Carbon Nitrogen
Fig 1.2: Molecular structure of the two thyroid hormone bioactive forms, thyroxine and triiodo-L-thyronine. Taken
THs stand out from all others present in vertebrates since they are the only iodine-containing compounds of physiologic significance [8].
THs are produced by all vertebrates, primarily as T4 in the thyroid gland and
are subsequently converted to the more bioactive T3 form in peripheral tissues through
the action of a family of enzymes the deiodinases [9].
These hormones are known to play a crucial role in maintenance of normal physiological functions [10] as they stimulate oxidative respiration in most cells in the body and, in doing so, help to set the body’s basal metabolic rate [1].
THs are present in all vertebrates. For instance in children, they promote growth and stimulate maturation of the central nervous system, while in amphibians THs are needed for the metamorphosis of the larvae into adults [1]. In avian species, THs are required for nervous system and skeleton development [8].
In fish, TH action has also been demonstrated to regulate both larval and metamorphic development. It has also been showed that at later life stages in fish, THs assist in the control of various physiological functions including osmoregulation, metabolism, somatic growth, development, metamorphosis, etc. [11].
Although THs regulate many biological functions, their levels are also influenced by nutritional status in both endothermic (birds, mammals) and ectothermic (fish) vertebrates and poor nutrition is linked with a decreased T3 and T4 [8].
For the correct concentrations of THs to be maintained there are mechanisms which regulate THs synthesis. These mechanisms are found in the
Hypothalamic-Pituitary-Thyroid (HPT) Axis, which, as the name indicates, consists of the
hypothalamus, pituitary and the thyroid gland.
1.3.1 TH regulation
The activity of the thyroid gland, and all structures associated in the HPT axis, is predominantly regulated by the concentration of the pituitary glycoprotein hormone,
thyroid stimulation hormone (TSH). Thus, regulation of thyroid function in normal
individuals is to a large extent determined by the factors which regulate the synthesis and secretion of TSH. Those factors are mainly thyrotropin releasing hormone
(TRH), produced in the hypothalamus, and the feedback effects of circulating THs at the hypothalamic and pituitary levels of TRH and TSH (“thyrotropin”) [8].
TRH is delivered to the pituitary gland and selectively stimulates the synthesis of the TSH beta subunit. Pituitary TSH is composed of two sub-units, alfa and beta [10]. The beta subunit confers specificity to the molecule, since it interacts with the thyroid cell TSH receptor leading, through enzymatic activity, to the increase in TH synthesis and liberation [8]. However, the TSH beta sub-unit in its free form is inactive, and requires non-covalent combination with the alfa subunit to express hormonal bioactivity [8].
TRH synthesis and release are regulated by the THs, an integral part of the negative feedback loop regulating thyroid status [8]. On the other hand, the major regulators of TSH production are represented by the inhibitory effects of thyroid hormones (negative feedback loop) and by the stimulatory action of TRH (figure 1.3) [8].
Fig 1.3: Fig. Schematic representation of the basic elements of the Hypothalamic-Pituitary-Thyroid (HPT) Axis:
main glands and respective hormones. TRH is secreted by the hypothalamus and stimulates the pituitary to secret TSH, which then stimulates the thyroid to release T3 and T4. These hormones in turn will stimulate the target cells and regulate by negative feedback TRH and TSH synthesis.
1.3.2 Thyroid tissue
The thyroid tissue is composed of functional units called the thyroid follicles. The follicles are lined by a simple epithelium and their central cavity contains a gelatinous substance called colloid [12] (figure 1.4).
Fig 1.4: Representation of thyroid tissue showing the thyroid follicles containing colloid which is enclosed by a
monolayer of epithelial cells. Taken from [13].
The specialized epithelial cells found in the thyroid follicles concentrate iodide and incorporate it into thyroglobulin (Tg), which is subsequently hydrolysed to release THs. These processes require cell-type specific gene-products, which include Tg,
thyroid peroxidase (TPO), the receptor for the thyroid stimulating hormone
(RTSH) and sodium-iodide symporter [14], as explained below.
As mentioned in section 1.2.1, TSH has an important role in TH regulation. This hormone interacts with its receptor found in the thyroid cells which leads to transcription of the Tg, TPO, RTSH and NIS genes [10].
Although THs and thyroid tissue are present in all vertebrates there exist significant differences among species. In general, the gland is often a collection of aggregated follicles as described for mammals, highly vascularised and encapsulated by connective tissue [10]. However, the thyroid of many teleosts is not a compact single organ. They have the thyroid follicles loosely distributed within the mesenchyme of the ventral head area [11], although it maintains the tissue organization as thyroid follicles.
Despite these structural differences, the biochemistry and regulation of thyroid hormone synthesis are identical [10].
1.3.3 Hormone Synthesis
Synthesis and accumulation of THs takes place in four stages: synthesis of thyroglobulin, uptake of iodide from the blood, activation of iodide, and iodination of the tyrosine residues of thyroglobulin [12] (figure 1.5).
Fig 1.5: The thyroid follicular cell and the process of synthesis and secretion of THs. These events may occur
simultaneously in the same cell. Taken from [12].
Synthesis of thyroglobulin – Tg is the substrate from which THs are
synthesised [10]. Tg is secreted from the thyrocytes into the follicular lumen to form the colloid [15]. Tg is synthesised by ribosomes bound to the rough endoplasmatic reticulum and then transported to the Golgi apparatus, where carbohydrate moieties are added [10, 16]. Then Tg is released from vesicles which form at the apical surface of the cell into the lumen of the follicle where tyrosine residues are iodinated and where it is condensed to produce the thyroid hormones, T3 and T4. T3 and T4 remain covalently
bound to Tg as long as they are stored in the lumen [12, 17].
Uptake of circulating iodide – is accomplished in the thyroid follicular cells
[12]. The iodide uptake across the basolateral membrane of polarized cells is dependent of a specific transporter, the Na+/I- symporter or NIS. This is an intrinsic plasma membrane protein on the thyroid epithelial cells, structurally and functionally conserved among vertebrates [10, 18, 19], that passively transports two Na+ and one I- down the Na+ ion gradient, resulting in an iodine concentration gradient from the thyroid cell to the extracellular fluid. The iodide gradient can be increased to as high as 1:400 in conditions of iodine deficiency [16]. Serum iodine plays an important role in regulating
thyroid function because low iodine levels increase the amount of NIS, and thus increase iodide uptake, compensating for the lower serum concentration [12].
Iodide oxidation – Iodide, the form of iodine that enters the cell, must be
oxidized to a higher oxidation state before it is transferred to Tg. Oxidation of iodine is controlled by the enzyme thyroid peroxidise (TPO) [10], a membrane-bound glycoprotein with a central role in thyroid hormone synthesis catalysing iodide oxidation, iodination of tyrosine residues in Tg, and iodothyronine coupling [16]. Like Tg and NIS, the TPO enzyme is also highly conserved among vertebrates [10]. After the iodide is oxidised, another transport protein of the cell is involved, pendrin, that functions as an apical porter of iodide in the thyrocyte, transporting iodide into the follicle lumen [20].
Iodination of tyrosine residues – There are four major sites on the Tg protein
where iodine becomes covalently attached. These “sites” are tyrosyl residues that accept an iodine atom as the consequence of TPO activity. Tg appears to be iodinated at the interface colloid-thyroid follicle cell [10], to produce MIT (monoiodotyrosine) and DIT (diiodotyrosine) [8]. Specific tyrosyl residues are coupled within the backbone structure of Tg, and this is the material stored in the colloid of the thyroid follicle [10], in the form of a matrix of covalently cross-linked material.
THs are stored in the colloid as part of the iodinated Tg molecule. Therefore, prior to their secretion from the thyroid gland, T4 and T3 must be released from the
peptide linkage within Tg [10].
1.3.4 Thyroxine production and release
Thyroid hormone liberation begins with the solubilisation of Tg from its matrix of covalently cross-linked material. Proteolysis is a necessary prerequisite for solubilisation of Tg from the globules and must precede its endocytosis by thyroid epithelial cells, leading to the rapid liberation of T4 [10].
degradation of Tg at the apical plasma membrane [21]. The proteolytic enzymes described as being involved in solubilisation of Tg and its posterior degradation are
cathepsin B, L and K.
Friedrichs et al. [22] have shown that the lack of expression of single or multiple cathepsins caused a reduction in circulating levels of T4 and altered the histological
appearance of the colloid itself. Specifically, in the absence of enzymes (cathepsins B and L) that solubilise the cross linked Tg in the colloid, the material cannot be removed from the colloid and the follicle continues to expand as the result of continued synthesis of Tg [10].
The secretion of lysosomal enzymes from thyroid epithelial cells is a regulated process. Secretion of mature cathepsin B is triggered by TSH [21] and it is transported to endososmes/lysosomes in which it matures to become an active peptidase. After endocytosis, the Tg backbone is broken down by the action of lysosomal enzymes after fusion of the endosome with a secondary lysosome [10], as schematically presented in
figure 1.6. The enzymes responsible for Tg degradation are not unique to the thyroid
gland but are common lysosomal enzymes [10].
Fig 1. 6: Schematic representation of T3 and T4 production and liberation through Tg solubilisation and degradation
by the activity of proteolytic enzymes such as Cathepsins B, L and K, in the thyroid follicular cells. Taken from [22].
The metabolic pathway required to liberate T4 and T3 from the Tg molecule is an
important physiological event and its potential disruption by environmental chemicals may be an important mechanism by which adverse effects of specific toxicants can occur [10].
1.4
Endocrine disruptors
Endocrine disruptors (EDs) are exogenous substances that act like hormones in the endocrine system and disrupt the physiologic function of endogenous hormones [7]. Endocrine-active compounds can be natural and synthetic hormones or industrial chemicals which interfere by stimulating or inhibiting the binding or synthesis of hormones or their receptors and binding proteins [23].
EDs act in very small doses but generally over a long period of time. So, the relevant doses of EDs in the environment are minute, but with the capacity of affecting the organisms. Since the majority of chemicals with ED ability are also persistent in the environment and bioaccumulative, it’s difficult to establish a direct relation to the effects of one single substance [24].
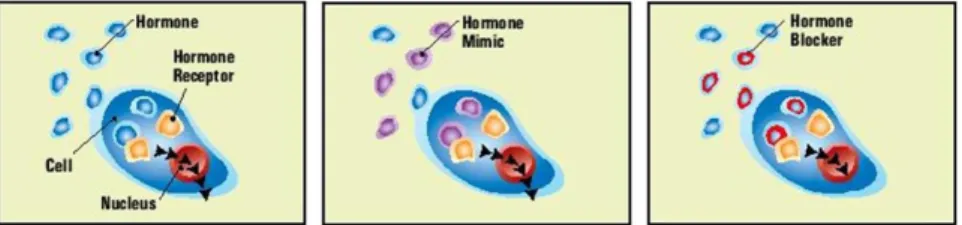
Fig 1.7: Schematic representation of the normal response of a cell to a hormone (left) and for the some of the
endocrine disruption mechanisms – hormone mimic (middle) and hormone blockage (right). Image taken from [25].
Some chemicals mimic a natural hormone, leading the body to respond to the stimulus (as in figure 1.7, middle), or respond at inappropriate times. Other EDs block the effects of a hormone by binding to certain receptors (figure 1.7, bottom). In addition, others directly stimulate or inhibit the endocrine system and cause over or underproduction of hormones [26].
1.4.1 Thyroid disruptors – Goitrogens
The sensitive and tightly regulated feedback control system (thyroid gland autoregulation) and the large intrathyroidal storage pool of THs serve to provide a constant supply of thyroid hormone to peripheral tissues, even if perturbations are imposed by external environment, chemicals and drugs [8]. This work focused on perturbations of the HPT axis by chemicals and drugs. Many drugs affect the transport, metabolism, action and excretion of T4 and its derivatives as well as regulation at all
levels of the HPT axis [8].
Irrespective of their mechanism of action, they are collectively called
goitrogens, because as a result of a decrease in serum TH level, TSH secretion is
enhanced, causing goiter formation. Among the goitrogens, the least toxic and those possessing the highest thyroid-inhibiting activity are clinically used in the treatment of hyperthyroidism [8].
1.4.1.1 Anti-thyroid drugs
An anti-thyroid drug is any agent or substance which suppresses, prevents or opposes the biosynthesis of thyroid hormones [27]. According to their principal mode of action on thyroidal iodine metabolism, antithyroid drugs are divided into two categories: 1) the monovalent anions which inhibit iodide transport into the thyroid gland, and 2) a large number of compounds that act through inhibition of thyroidal iodide binding and iodotyrosine coupling. The most important representatives of this latter category of compounds are the group of thionamides. Certain monovalent anions inhibit the transport of iodide into the thyroid gland and thereby depress iodide uptake and hormone formation [8].
On the other hand, the thionamide group of goitrogens does not prevent transport of iodide into the thyroid gland, but rather impairs covalent binding of iodide into Tg. They may be competitive substrates for TPO, preventing the peroxidation of iodide by this enzyme [8].
From a medical point of view, anti-thyroid agents can be defined as agents that are used to treat hyperthyroidism by reducing the excessive production of thyroid hormones [27] the most commonly used drug is Propylthiouracil (PTU).
1.4.1.1.1 Propylthiouracil (PTU)
PTU is a derivative of thiocarbamide. It is an anti-thyroid, reversible goitrogen drug, effective and safe in the treatment of hyperthyroidism [28] with a well-known mechanism of action: it inhibits intrathyroidal synthesis of thyroid hormones by
interfering with the iodine utilization by TPO and with the coupling of MIT and DIT required for the formation of T3 and T4. Furthermore, it blocks the peripheral conversion
of T4 to T3 [29], thus maintaining the T4 concentration in blood at a higher level that is
normal.
Fig 1.8: 3D Molecular structure of the thyroid disruptor PTU. Taken from [7].
According to INFARMED, Autoridade Nacional do Medicamento e Produtos de Saúde, I. P., (the Portuguese entity for medical drugs regulation) the doses for PTU for clinical application are 300 to 600 mg/day for adults until clinical control, following a gradual reduction to maintenance doses of 50 to 100 mg/day [30].
1.4.1.2 Environmental thyroid disruptors
A large number of substances may affect thyroid gland function and thyroid hormone metabolism and action. The list continues to grow with the introduction of new diagnostic agents, drugs and food additives [8].
A number of chemical contaminants are suspected to display endocrine disrupting activity at environmentally relevant concentrations and may interfere with normal growth and developmental processes that involve THs [31-33].
Environmental chemicals may interfere with thyroid homeostasis through many mechanisms of action, such as binding to transport proteins, in cellular uptake mechanisms or by modifying the metabolism of THs. Several environmental chemicals have a high degree of structural resemblance to T4 and T3, and therefore interfere with
There is substantial evidence that polychlorinated biphenyls (PCBs), dioxins and furans cause hypothyroidism in exposed animals and that environmentally occurring doses affect human thyroid homeostasis. Similarly, flame retardants reduce peripheral TH levels in rodents, but human studies are scarce. Studies also indicate thyroid disruptive properties of phthalates, some stimulate TH production, contrary to most other groups of chemicals [34].
The aquatic environment and organisms such as fish are constantly threatened by pollution resulting from human activity [35]. Pharmaceutics and personal care products (PCPs) represent a source of prevalent contaminants in the aquatic environment, and many can be present as complex mixtures within municipal waste effluents. One such contaminant is the bactericidal agent triclosan (TCS) [36].
1.4.1.2.1 Triclosan
TCS (2,4,4’ – trichloro -2’ - hydroxydiphenyl ether; synonym: Irgasan DP 300) is a synthetic, broad-spectrum antimicrobial agent that in recent years has exploded onto the consumer market [37]. It is used in the manufacture of a variety of commercial products including clothing, materials for food processing, PCPs (e.g. soaps and toothpaste) and surgical items (e.g. sutures) [38-44].
Carbon Oxigen Cloride Hidrogen Carbon Carbon Oxigen
Oxigen ClorideCloride Hidrogen Hidrogen
Fig 1.9: 3-D molecular structure of the thyroid disruptor Triclosan. Taken from [7].
Rather than being a general biocide (a chemical substance that disrupts so many cellular functions at once that bacteria encountering it simply cannot survive), TCS may instead be a specific biocide, killing bacteria by targeting specific cellular functions by blocking essential enzymes for fatty acid synthesis. However, this allows the bacteria to mutate, thus building up resistance and developing into “superbugs” [45].
Its ubiquitous usage in consumer products has led to widespread environmental contamination evidenced by detection of TCS in wastewater effluent in the US, UK, Japan and other countries [38-44]. Concentrations in the range of 0.01 – 0.65 µg/L in sewage effluent and 0.4 – 12 µg/L in sludge have recently been recorded from sewage treatment plant sites in North America and Europe [38-44].
During wastewater treatment, many of the chemicals, including biocides, are removed, but some chemicals still reach surface water [46]. It’s the case of TCS, making this an important aquatic environmental contaminant.
The release of TCS into the environment is of particular concern as it is structurally similar to THs (fig 1.10) and may, therefore, represent a potential disruptor of TH action particularly as TCS or its derivatives bioaccumulate in the tissues of wildlife species [35].
Fig 1. 10: Chemical structures of the THs (T3 and T4) and of the goitrogen TCS. Taken from [7].
1.5 Objective
The number of chemicals to which humans are exposed increases as do the quantities which accumulate in the environment, the real effects of these chemicals remain unknown but they may alter whole body homeostasis by affecting the endocrine system. Among all the glands that belong to the endocrine system, this work focuses on the HPT axis, especially the thyroid gland. There are studies which show that the HTP axis is very susceptible to some classes of man-made chemicals, especially as some of those chemicals show high structural resemblance to TH hormones, thus changing the
alterations, the changes may be detected as goitrogen, i.e. the enlargement of the thyroid gland. To evaluate the presence of such abnormalities in the thyroid gland, histological techniques were applied.
The thyroid gland enlargement occurs at a molecular level by alterations to TH synthesis. Among the proteins involved in TH synthesis, Tg, CtsB, TSH, NIS and TPO are among some of the most important, and are susceptible to the presence of some chemical. Using molecular tools, such as qRT-PCR, the level of expression of the mRNA for these proteins was evaluated in this study.
The goal of this work was to study the effects of TCS on the disruption of the thyroid axis by evaluating its effects through a molecular and functional analysis in an in vivo assay.
1.5.1 Goitrogen choice
The potential endocrine disrupting behaviour of TCS was studied in rats as it has previously been reported to alter the level of thyroid hormones in animals [47]. Moreover, the daily exposure to this agent is not insignificant as it has widespread applications in everyday products such as detergents, kitchen sponges, soaps, deodorants, cosmetics, lotion, antimicrobial creams, (…), various plastics including children’s toys, paint, wallpaper, flooring, textiles, curtains, keyboards, countertops [48].
1.5.2 Experimental Model
Since the present study consisted of an in vivo study of TCS, it was necessary to choose a suitable animal model. Having in mind that the objective of the work included the functional analysis of the goitrogenic action of TCS, the zebrafish was chosen.
Zebrafish (Danio rerio a small tropical freshwater fish) from the family Cyprinidae that rarely grows beyond 50–60 mm in length and was first used as a genetic model system is the early 1980s. The zebrafish shares numerous anatomical similarities with higher vertebrates, including humans, both in the general body plan and in specific
organs. Close parallels exist in many aspects of early embryogenesis and in the anatomical and histological features of the brain, spinal cord, sensory systems, cardiovascular system, and other organs. Not infrequently, genetic defects in zebrafish resemble human disorders [49].
Also the large base of established knowledge on the developmental biology and genetics of the zebrafish and the detailed genetic map of this species genome facilitates the identification of modifications in gene expression during endocrine disruption [50].
2. Methodology
The experimental work consisted of in vivo exposure of zebrafish to a goitrogen (TCS) in order to evaluate its effects on thyroid gland morphology and mRNA (messenger ribonucleic acid) expression of key genes encoding proteins involved in the synthesis of the THs namely, TSH in the pituitary gland and Tg, TPO, NIS and isoform a of CtsB in the thyroid.
The fish were exposed orally to PTU a goitrogen commonly used in hyperthyroidism treatment and whose effects on thyroid hormone levels are well studied for different classes of organisms, including fish [23, 51] and the bactericide TCS. The results of administering PTU served as a reference to which the effects of TCS could be compared.
For morphological evaluation of the thyroid, the whole head was processed for histological analysis and several parameters were measured in thyroid follicles, such as internal and external areas, vacuolation and height of the epithelium.
The evaluation of whole head mRNA expression was achieved through the application of a number of molecular tools, such as Polymerase Chain Reaction (PCR), for amplification and cloning of templates and qualitative analysis of tissue expression for key genes, and real-time quantitative PCR (qPCR) to analyse modifications in gene expression. For the successful application of the previous tools, in silico identification of the target gene was needed, to obtain the predicted cDNA sequences of the proteins of interest.
2.1 Experimental conditions
For the duration of the treatment, 21 days, a total of 48 zebrafish imported from Thailand, were weighted and randomly distributed into 6 tanks (8 individuals per tank), containing 5,5 L of freshwater at room temperature (26ºC) and under 12h light:12h dark photoperiod. Water aeration and circulation were achieved using a pump, and water was renewed once a week by replacing approximately 2/3 of the total volume of the tank
with dechlorinated fresh water. The fish were fed once a day with dry food pellets at 3% per kg of fish.
2.1.1 Goitrogen dose
The treatment with TCS (or Irgasan, Fluka, Sigma-Aldrich, Madrid, Spain) was carried out at a daily dose of 100 mg/kg. This dose was defined based on a study by Crofton et al. 2008 [47] in mice, which show that serum T4 decreased in a dose
dependent manner, as the dose of TCS increases. According to the results of the study, the lowest TCS concentration tested which caused a significant decrease in the T4 levels was 100 mg/Kg/day.
Treatment with PTU (Sigma-Aldrich), the positive control treatment, was carried out at a daily exposure rate of 5 mg/kg. This dose was selected based upon the information available from INFARMED [30], in which the recommended exposure, for adults was of 300-600 mg/day (assuming that a human adult weighs approximately 60 kg, the daily exposure dose consisted of 5 to 10 mg/kg/day). The dose of PTU chosen was further supported by the study by Villar et al, in which a PTU dose of 4.4 mg/kg/day up to 35 mg/kg/day resulted in lower concentrations of circulating T4 [52].
Also in previous works from the Molecular and Comparative Endocrinology (MCE) group in fish, concentration of 1mg/kg/day PTU was tested. This concentration did not induced hypothyroidism [53].
2.1.2 Drug administration
The fish exposure to the goitrogens TCS and PTU was achieved orally by applying the drugs in the food. The daily dose of food administered to the animals in each tank was determined assuming that each fish ate approximately 3% of its total body weight. The total mass of goitrogen administered was determined taking into account the sum of the body weight of all the fish per treatment group, prior to acclimatization (table 2.1), and the previous established doses (100 mg/kg/day for TCS and 5 mg/kg/day for PTU).
Table 2.1: Total body weight (g) for the different groups (n=10) acquired prior to acclimatization.
Tank Total body weight (g)
Control 1 3.27 Control 2 3.14 PTU 1 2.69 PTU 2 3.37 TCS 1 2.67 TCS 2 3.25
Stock solutions of TCS (1 mg/mL) and PTU (10 mg/mL) were prepared by dissolving the drugs, weighted using a precision balance, in 95% ethanol in glass tubes. The appropriate volume of stock solution required to attain the desired concentration was diluted to reach a final volume of 100 µL. The food pellets were then immersed in each drug solution (TCS and PTU) or in ethanol only (control group) and then allowed to dry in a fume cupboard.
The dried food pellets were administrated to replicate tanks (n=2) for each treatment.
2.2 Sampling
After 21 days treatment, all the animals were collected (n = 8 per tank) and placed in a vessel containing anaesthetic (2-phenoxyethanol, Sigma, diluted at 1:2,000 in fresh water) in order to euthanize the animals. Once euthanized, the animals were weighted and their standard length [54] measured. Half of the individuals from each tank were immersed in liquid N2 and stored at -80ºC until RNA extraction, while the
other half were immersed in fresh 4% paraformaldehyde (PFA1) after nicking the abdomen to ensure good penetration of the fixative and stored at 4ºC.
2.3 Histological Analysis
The histological analysis was carried out on the tissues of the whole head, where the thyroid gland is located, due to the small size of the animals and the dispersed nature
of the thyroid tissue in fish. The animals (8 fish per group) immersed in the 4% PFA fixative were washed twice in PBS 1X, 30 minutes each, and a final wash with diethylpyrocarbonate (DEPC)-treated water2 carried out for 30 minutes. The samples were then immersed in ethanol 70% in DEPC-treated water and stored at 4ºC.
2.3.1 Tissue processing
The head was isolated from the rest of the animal by cutting off the operculum (gill cover) followed by severing of the head. All tissues were decalcified (removal of calcium ions to soften tissue) [7] in EDTA 0,5M, pH 8,0 for 6 days with agitation and kept away from light.
Decalcification of the head tissues was followed by paraffin embedding using a Leica TP1020 tissue processor, where the tissues were dehydrated through immersion in a gradient of ethanol, 70% (10 min), 95% (30 min x2) and 100% (1 hour x2) followed by a mixture of ethanol:xylene (1:1) (1 hour), saturated xylene (100%) (1 and 1.5 hours), a mixture of xylene:paraffin (1:1) (2 hours) and paraffin (100%) (2 hours). Once the paraffin embedding ended, the tissues were used to prepare the paraffin blocks in 3 consoles: thermal, dispensing and cryo (Miles Scientific), obtaining a total of 6 blocks, 4 heads per block. Serial sections of 5µm were obtained from each block using a Leica RM 2135 microtome and were mounted on glass slides coated with Aminopropyltriethoxysilane (APES)3 (Sigma-Aldrich) and dried overnight (ON) at 37 ºC.
2.3.2 Staining
In order to identify the thyroid structures, the tissues were stained using the Cleveland-Wolfe trichrome method. This method stains the colloid in thyroid follicles bright red while the epithelium stains blue or purple.
2
The first steps of this staining consist of removal of paraffin wax and rehydration of the tissues. The tissues were immersed for 15 min in K-Clear (Kaltec, Padova, Italy), twice, followed by the immersion in a descending series of ethanol dilutions (100% for 10 min, 95% and 70% for 5 min each). The rehydration ended with a 5 min immersion in distilled water. Rehydrated tissues were immersed for 5 min in Erlich’s haematoxylin followed by a wash in tap and distilled waters. The tissues were dipped for 5 min in 1% aqueous Erythrosine and washed with tap and distilled waters. The tissues were stained for 8-10 sec with Orange G (2% in 1% phosphotungstic acid) followed by a fast wash in distilled water before staining with Aniline Blue (0,25% aqueous solution acidified to pH 3-4) for 90 sec. The tissues were then quickly washed in 100% ethanol, incubated 2 x 5 min in K-Clear and mounted for definitive preparation in DPX (Fluka, Sigma).
The tissues were examined in an Olympus BH2 microscope for the presence or absence of colloid and vacuolation in thyroid follicles, follicular epithelial folding and evaluation of follicular size. The internal/external areas and the cell height were measured for sections from control (n = 4), TCS (n = 6) and PTU (n = 4) treated zebrafish using the software ImageJ (freeware-NIH) [55] for digital analysis from the photographs taken from an Olympus DP11 digital camera. The cell height of 2 different thyrocytes per follicle, lying 90º from one another, was also measured for 4 individuals in each of the experimental groups.
2.4 Molecular Analyses
To study if the goitrogens had an effect in the level of expression of the mRNAs for key proteins involved in TH synthesis (CtsBa, Tg, TPO, TSH and NIS), it was important first to isolate the genetic material – the RNA from whole head tissues (where the thyroid gland and pituitary gland are found). So, prior to RNA extraction, the head and body were separated.
As the study was centred on specific gene products, it was also important to test their presence in the extracted RNA. This was achieved by complementary DNA (cDNA) synthesis from whole head RNA from control fish, and the use of specific primers for PCR. These PCR reactions also provided the specific cDNAs to clone each
gene product into a vector, and each cDNA fragment + vector construct was introduced into host cells transforming them. After multiplication of the host cells, each construct was extracted, its identity was confirmed by digestion and sequencing, and it was also used as a standard in qPCR with specific primers, which allowed the quantification of gene expression in the different experimental groups.
2.4.1 RNA extraction and Quantification
For RNA isolation from the head, frozen animals (n=8 per group) were placed on a hard surface, and the heads were severed with a sharp blade. To avoid RNA degradation by the RNases present in the tissues, they were maintained in liquid N2 for
part of the tissue isolation.
The extraction was performed using TRI reagent (TRI, Sigma-Aldrich), following the protocol provided by the company and a manual glass homogenizer. The previously severed and crushed tissue was removed from liquid N2, immersed in 400 µl
of TRI at room temperature and homogenized. The final mixture was transferred to a fresh tube and incubated at room temperature for 5 minutes. 0.2 mL of chloroform/ml TRI was added; the mixture was vigorously mixed and left to incubate at room temperature, and then centrifuged at 12000xg, 15 min, 4ºC. The (superior) aqueous phase was carefully removed to a fresh tube to which 0.5 ml isopropanol/ml TRI was added. The solution was incubated at room temperature followed by a centrifugation step at 12000xg, 15 min, 4ºC to pellet the RNA. The isopropanol was discarded and the pellet washed twice with 1 ml of cold ethanol 75% in DEPC-treated water/ml TRI used. The mix was centrifuged at 12000xg, 10 min, 4ºC and ethanol removed by inversion of the tube. The pellet of RNA was allowed to dry on ice and ressuspended in 200 µl DEPC-treated water (to avoid RNase contamination). 9 µl of ressuspended RNA (diluted 1:10) was applied on 1.5% electrophoresis to evaluate RNA integrity, another aliquot was stored directly at -80ºC (working aliquot), while 2.5 V (volumes) of 100% ethanol and 0.1 V of 3M potassium acetate (KAc) were added to the remaining volume and stored at -80ºC (long-term storage aliquot).
The RNA in the samples was quantified using the Qubit™ fluorometer and the Quant-iT™ RNA Assay kit (Invitrogen, Carlsbad, CA, USA). Quant-iT™ Assay kits utilize advanced fluorophores that become fluorescent upon binding to DNA, RNA, or proteins; the fluorescence intensity of the resulting complex depends directly on the amount of the target molecule in the sample. The Quant-iT™ Reagents only report the molecule of interest – there’s no interference from free nucleotides or other contaminants (the assay Quant-iT RNA assay is highly selective for RNA over double-stranded DNA)[56].
As described in the protocol provided with the kit, the Quant-iT™ working solution was obtained by diluting of Quant-iT™ RNA reagent 1:200 in Quant-iT™ RNA buffer. 1 µl of the samples (each RNA diluted 1:10) and 10 µl of each standard (standard 1 and 2) were loaded in the assay tubes to which 199 µl and 190 µl of working solution were added to the tubes, respectively. The equipment was calibrated with the prepared standards followed by the reading of the samples concentrations.
2.4.2. Removal of genomic DNA contamination
During the RNA extraction, it is isolated from a mixture of DNA and other molecules such as proteins and lipids. Although a great part of the genomic DNA (gDNA) is removed during extraction with TRI reagent, it is necessary to assure that all the gDNA contamination is removed prior to qRT-PCR and for this reason samples were treated with DNase. This step was carried out using the DNA-free™ Kit (Ambion®, UK).
DNase treatment was carried out on 4 µg of RNA which was transferred into a fresh tube to which 2 µl DNase buffer, 1 µl recombinant DNase I, and nuclease-free water, were added, to obtain 20 µl of reaction solution. The solution was mixed gently and incubated for 30 min at 37ºC. 2 µl of inactivation reagent were added and incubated at room temperature for 2 min with occasional vortexing. The mixture was centrifuge at 10000xg, 1.5 min, 4ºC, placed on ice and the supernatant was carefully transferred to a fresh tube. 1 µl of a 1:5 dilution of the treated solution was quantified as described in section 2.4.2.1.
2.4.3 Complementary DNA (cDNA) synthesis
cDNA is a single-stranded DNA molecule with a nucleotide sequence that is complementary to an RNA molecule, and it is synthesised by the enzyme reverse transcriptase (RT) from an RNA template [57]. It also differs from genomic DNA because, like mRNA, it does not contain non-coding sequences that are present in genes, the introns.
The synthesis of cDNA (reverse transcription) was carried out in a Robot-Cycler thermocycler (Stratagene, La Jolla, USA) using 500 ng of DNAse-treated RNA, 200 ng
of pd(N)6 random hexamers (GE Healthcare, UK), 1 µl of
deoxynucleotide-triphosphates (dNTPs) (GE Heathcare, 10 mM each) and sterile water to a final volume of 13µl. The mix was heated to 65ºC for 5 min and incubated on ice for 5 min. 40U of MMLV reverse transcriptase (Promega, VWR, Portugal), 5U of RNAguard Rnase inhibitor (GE Healthcare) and 1x reverse transcriptase buffer (Promega) were then added, in a final volume of 20µl. The samples were run in a synthesis reaction for 10 min at 25ºC, 50 min at 42ºC synthesis was terminated by incubation for 5 min at 72ºC. A –RT control (cDNA synthesis in the absence of RT enzyme) for one of the samples was also performed, to control for genomic DNA contamination.
2.4.4 In silico identification of predicted cDNA sequences
The in silico studies allowed the identification of the gene sequences that correspond to the gene encoding the proteins to be studied as well as acquiring information about the cDNA sequences.
Predicted cDNA nucleotide sequences for the genes of interest (CtsBa, Tg, TPO, TSH and NIS) were obtained by searching the zebra fish genome database of the National Centre for Biotechnology Information (NCBI, www.ncbi.nlm.nih.gov), using the query by gene name. The predicted cDNAs were retrieved from the database, and their identity was confirmed by comparison of their translated sequence with homologous proteins from other organisms, using BlastX against the non-redundant protein sequence database (nr) [58].
For the target genes that were not found in the genome using the query by gene name, homologous cDNAs from other organisms were retrieved from NCBI and used to find the predicted protein in the zebra fish genome by BlastX at the NCBI site. The predicted zebra fish cDNA was retrieved and its identity confirmed by BlastX against the nr protein database.
In order to find the cDNA/protein sequence for genes with high homology to the target genes, which could be co-amplified by PCR due to cross-reaction, the predicted cDNAs of the target genes were blasted against the zebra fish genome (BlastX). Whenever proteins with high homology were found, the corresponding cDNA nucleotide sequence was retrieved and aligned with the cDNA of the target gene using ClustalX 2.0.9 software. These alignments were further used for specific primer design used in the following PCR techniques.
2.4.5 Polymerase Chain Reaction (PCR)
PCR is a process that specifically generates large amounts of DNA in vitro, starting from a small amount of a DNA template, with a three-step cycling process. For this amplification to occur the essential components for PCR amplification are (1) two synthetic oligonucleotide primers, complementary to regions on opposite strands that flank the target DNA sequence, and that, after annealing to the template DNA, have their 3’ hydroxyl ends oriented toward each other; (2) a target sequence in a DNA sample that lies between the pair of primers; (3) a thermostable DNA polymerase that can withstand multiple cycles of heating to 95ºC or higher; and (4) the four dNTPs (adenine, tyrosine, guanidine and cytosine).
The first step in the PCR amplification system is the thermal denaturation of the DNA sample by raising the temperature to 95ºC. In addition to the template DNA this reaction contains a vast molar excess of the two primers. For the second step,
renaturation or annealing, the temperature of the mixture is slowly cooled to ≈55ºC
(depending on the primer sequences). During this step, the primers base pair with their complementary sequences in the template DNA. In the third step, synthesis or
extension, the temperature is raised to ≈72ºC, which is optimum for the catalytic
functioning of Taq DNA polymerase in extending the primers to make copies of the DNA template [59]. These three steps are repeated for a number of cycles (usually
![Fig 1.8: 3D Molecular structure of the thyroid disruptor PTU. Taken from [7].](https://thumb-eu.123doks.com/thumbv2/123dok_br/18939077.939414/25.892.375.580.298.466/fig-d-molecular-structure-thyroid-disruptor-ptu-taken.webp)
![Fig 1.9: 3-D molecular structure of the thyroid disruptor Triclosan. Taken from [7].](https://thumb-eu.123doks.com/thumbv2/123dok_br/18939077.939414/26.892.356.594.742.904/fig-d-molecular-structure-thyroid-disruptor-triclosan-taken.webp)
![Fig 1. 10: Chemical structures of the THs (T3 and T4) and of the goitrogen TCS. Taken from [7]](https://thumb-eu.123doks.com/thumbv2/123dok_br/18939077.939414/27.892.239.658.524.749/fig-chemical-structures-ths-t-goitrogen-tcs-taken.webp)