Departament of History
ECONOMIC AND FINANCIAL ANALYSIS OF THE
PORTUGUESE ART MARKET
Débora Amaral de Matos Nabais
A Dissertation presented in partial fullfillment of the Requirements
for the Degree of Master in Art Markets Management
Supervisor:
Dra. Alexandra Etelvina Martins Marques Fernandes, Assistant Professor, ISCTE - IUL, Business School
E CO N O M IC A N D F IN A N CIA L A N A L Y S IS O F T H E P O RT U G U E S E A RT M A RK E T D ébora A m ara l de M at os N aba is - Lombada - April 2015
ABSTRACT
The object of this dissertation aims to assess the profitability of twelve leading Portuguese art market companies from the two markets – primary and secondary/tertiary – by comparing the economic and financial data of each company with companies from the same sector. It begins with the characterization of the art market and by identifying the differences between the global art market and the domestic market, in order to justify the delay in the development and growth of the Portuguese art market. The study proceeds with data from public and private support to the arts and culture, showing a slow assertion of the arts as an actor and promoter of the cultural, social and economic development of a nation. Finally there is a study based on financial data from twelve contemporary art galleries, antique shops and auction houses, from 2010 to 2013, which goal is to explain the economic viability of this small market, its evolution during this period, and its future trends. The fluctuation and low level of results point out to an unstable and unpredictable market, heavily influenced by the country’s economic situation and the lack of cultural education that devaluates the sector. For an international recognition on the Portuguese art market, the public funding and cultural patronage support must increase, to enable companies to grow financially.
A presente dissertação tem como objetivo efetuar uma análise económica e financeira da situação de doze empresas de referência do mercado de arte português – dividido entre mercado primário e mercado secundário / terciário – comparando as mesmas através de diferentes indicadores de modo a analisar a rendibilidade destas empresas. Assim, o presente estudo inicia-se com uma caracterização do mercado de arte e identificação das diferenças entre o mercado global e o mercado nacional, procurando justificar o atraso no desenvolvimento e crescimento do mercado de arte nacional. O estudo prossegue com dados relativos ao apoio público e privado à cultura e às artes nacionais, demonstrando a lenta afirmação das artes como participante e promotora no desenvolvimento cultural, social e económico de uma nação. Por fim realiza-se um estudo baseado nos dados financeiros de doze galerias de arte contemporânea, antiquários e leiloeiras desde 2010 a 2013, de forma a caracterizar a viabilidade económica das empresas analisadas, a sua evolução neste período e as suas tendências. A oscilação e o baixo nível dos resultados apontam para um mercado instável e imprevísivel, bastante influenciado pela situação económica do país e pela falta de educação cultural que desvaloriza este sector. Para um reconhecimento internacional do mercado de arte português é necessário aumentar o apoio público ou até o mecenato cultural, permitindo às empresas do sector crescerem financeiramente
Keywords: Art Market
Economic and Financial Analysis Economics of the Art Market Management
Palavras-chave: Mercados de Arte
Análise Económico-Financeira
Contexto Económico dos Mercados de Arte Gestão
JEL Classifications:
D400 Market Structure and Pricing D440 Auctions
G100 General Financial Markets
ACKNOLEDGMENTS
I would like to thank a number of people who had an important role in supporting and encouraging me to write this dissertation.
Especially I am thanking Professor Alexandra Fernandes for her orientation, support, avalability, friendship, for the knowledge given, the opinions and critics, for full cooperation in solving my doubts that came along during the production of this study.
Additionally, my gratitude goes to the Professors of ISCTE from my Masters degree who amazingly provide me the knowledge during the academic period of my masters, and inspired me to develop this dissertation.
Thank you to INFORMA D&B for all the information provided, and the valuable help that allowed me to write this study.
Finally, knowing that alone nothing of this would be possible, I want to thank to my friends, my partner, my sisters and my family, specially my parents for being examples of courage, for their invaluable support and patience. I dedicate this dissertation to them.
TABLE OF CONTENTS Abstract ... i Keywords ... ii Acknoledgements ... .. iii Table of Contents ... iv List of Figues ... v List of Tables ... vi Introduction ... 1
Chapter 1 - The Art Market in Portugal ... 4
1.1. Financial Context of the Portuguese economy and its impact on the art market ... 5
1.2. Primary Market ... 7
1.2.1. Contemporary art galleries ... 8
1.2.2. Art fairs ... 9
1.3. Secondary and Tertiary Market ... 11
1.3.1. Antique shops ... 12
1.3.2. Auction houses ... 12
Chapter 2 - Size and numbers of the Portuguese Art Market ... 13
2.1. Public Support ... 13
2.2. Numbers from the Primary and Seconday Market ... 18
Chapter 3 - Economic and Financial Analysis of the Portuguese Art Market from 2010 to 2013 ... 21
3.1. Introduction ... 21
3.2. Analysis of the Collected Data ... 22
3.2.1. Contemporary art galleries ... 23
3.2.2. Antique shops ... 43
3.2.3. Auction houses ... 54
3.3. Turnover and Market Share ... 60
3.4. Results ... 64
Conclusion ... 66
Bibliography ... 67
List of Tables
Table 1 - The Global Art Market: Value and Volume of Transactions ... 13
Table 2 - Culture provision in the state budget in % and million € 1998-2012 ... 14
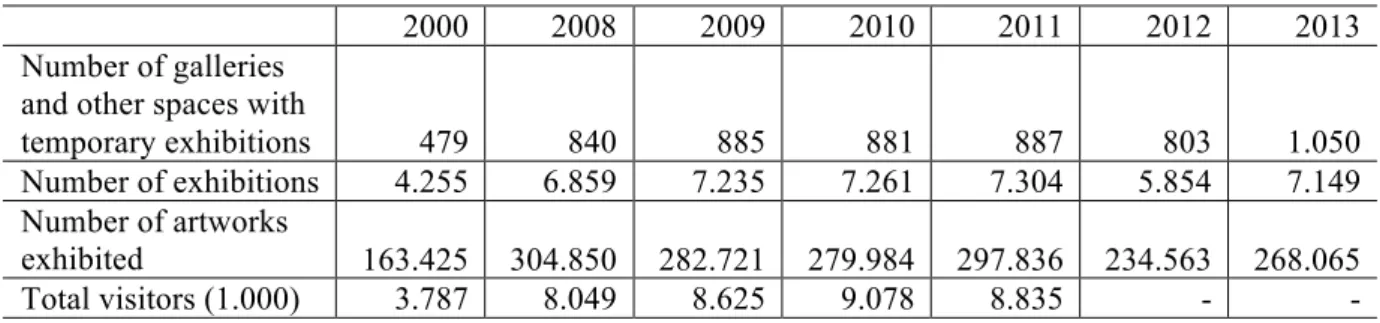
Table 3 - Cultural Statistics on the number of galleries, exhibitions, artworks and visitors... 18
Table 4 - Financial ratios G1... 25
Table 5 - Financial ratios G2 ... 29
Table 6 - Financial ratios G3 ... 31
Table 7 - Financial ratios G4 ... 33
Table 8 - Financial ratios G5 ... 35
Table 9 - Financial ratios G6 ... 38
Table 10 - Financial ratios A1... 44
Table 11 - Financial ratios A2 ... 46
Table 12 - Financial ratios A3 ... 48
Table 13 - Financial ratios A4 ... 49
Table 14 - Financial ratios H1 ... 55
Table 15 - Financial ratios H2 ... 57
Table 16 - Sales Growth Rate ... 63
Table 17 - Form used for the computation of financial ratios ... 71
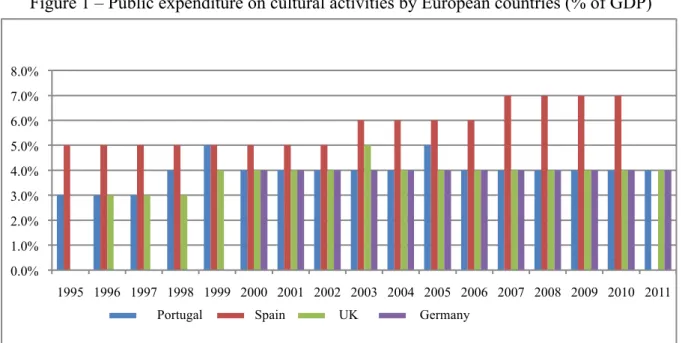
List of Figures Figure 1 - Public expenditure on cultural activities by European countries (% of GDP) ... 15
Figure 2 - Number of supported entities and % of subsidies to Fine Arts by DGArtes ... 16
Figure 3 - Direct funding evolution between 2009-12 by DGArtes ... 16
Figure 4 - Supported entities (%) by DGArtes in 2012 ... 17
Figure 5 - Municipal expenditures in Cultural and Creative Industries ... 18
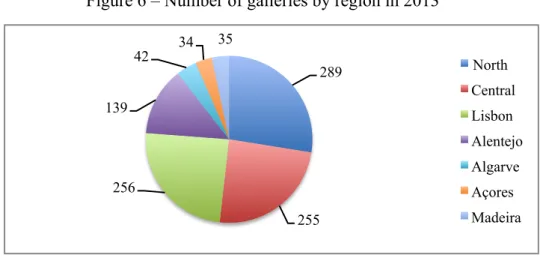
Figure 6 - Number of galleries by region in 2013 ... 19
Figure 7 - Annual turnover by auction houses ... 20
Figure 8 - Contemporary art galleries level pyramid ... 24
Figure 9 - Assets, Liabilities, Equity, Operating Profit and Net Income by G1... 25
Figure 11 - Assets, Liabilities, Equity, Operating Profit and Net Income from G3 ... 31
Figure 12 - Assets, Liabilities, Equity, Operating Profit and Net Income from G4 ... 33
Figure 13 - Assets, Liabilities, Equity, Operating Profit and Net Income from G5 ... 35
Figure 14 - Assets, Liabilities, Equity, Operating Profit and Net Income from G6 ... 38
Figure 15 - Working capital ratio from 2010-2013 by G1, G2, G3, G4, G5 and G6 ... 40
Figure 16 - Activity ratios from 2010 by G1, G2, G3, G4, G5 and G6 ... 41
Figure 17 - Debt / Equity ratio from 2010-13 by G1, G2, G3, G4, G5 and G6 ... 41
Figure 18 - Profitability ratios from 2010-13 by G1, G2, G3, G4, G5 and G6 ... 42
Figure 19 - Profit margin ratio from 2010-13 by G1, G2, G3, G4, G5 and G6 ... 42
Figure 20 - Assets, Liabilities, Equity, Operating Profit and Net Income by A1... 43
Figure 21 - Assets, Liabilities, Equity, Operating Profit and Net Income by A2 ... 45
Figure 22 - Assets, Liabilities, Equity, Operating Profit and Net Income by A3 ... 47
Figure 23 - Assets, Liabilities, Equity, Operating Profit and Net Income by A4 ... 49
Figure 24 - Working capital from 2010-13 by A1, A2, A3 and A4 ... 51
Figure 25 - Activity ratios from 2010 by A1, A2, A3 and A4 ... 52
Figure 26 - Debt / Equity from 2010-13 by A1, A2, A3 and A4 ... 52
Figure 27 - Profitability ratios from 2010-13 by A1, A2, A3 and A4 ... 53
Figure 28 - Profit margin from 2010-13 by A1, A2, A3 and A4 ... 53
Figure 29 - Assets, Liabilities, Equity, Operating Profit and Net Income by H1... 54
Figure 30 - Assets, Liabilities, Equity, Operating Profit and Net Income by H2 ... 56
Figure 31 - Working capital from 2010-13 by H1 and H2 ... 58
Figure 32 - Activity ratios from 2010-13 by H1 and H2 ... 59
Figure 33 - Debt / Equity ratio from 2010-13 by H1 and H2 ... 59
Figure 34 - Profitability ratios from 2010-13 by H1 and H2 ... 60
Figure 35 - Turnover by G1, G2, G3, G4, G5 and G6 ... 61
Figure 36 - Turnover by A1, A2, A3 and A4 ... 61
Figure 37 - Turnover by H1 and H2 ... 62
Figure 38 - Market share by sales in 2013 ... 62
INTRODUCTION
The choice for the theme of this study as to do with a lack of financial case studies on the portuguese art market. As a former student of Art Markets Management Master, I was able to increase my knowledge in the financial and accounting fields, which alongside with the art management helped me to understand the 21st century global art market. The main idea for this dissertation emerged after the first year of studies: find out more about the Portuguese art market, not only in academic terms but also in financial terms, having the goal of understanding how this market has grown in the last 4 years (from 2010 to 2013).
Before introducing the main chapter of this dissertation, the first chapter develops the features of the market, divided in three: contemporary art galleries, considered in the primary trade which deals with art that appears in the market for the first time and is conducted with the selling price on a 50:50 basis in most instances; antique shops and auction houses, considered in the secondary level refers to all subsequent resales of a work, trading in work by established artists, with significant cash and stock.
There are several ancillary services to contemporary art galleries, antique shops and auction houses, that play an important role in which artworks enter the distribution channel onto the market itself. Art collectors and general buyers often seek professional advice and guidance when starting or building a collection and maintaining its aesthetic worth and economic value. In these cases they appeal to art advisers. Well connected art advisers and consultants help their clients to learn about, choose and buy artworks. Their services include educating collectors about trends in the art world, introducing them to new gallery dealers and artists, take them to art fairs, museums and private collections to deepen their understanding of the market. In this study there is no mention of Portuguese art advisors or art consulting enterprises given that this type of service it is not common in the Portuguese market. For the communication link between artists and the public (and possible buyers), the art critics are also important characters. They promote not only national and international cultural aspects but they also give the premises on future artistic trends, while debates start around their opinion and artistic appreciation. In addition to these individual services, since the beginning of the 21st century there is a new business practiced by larger organizations: art investment
funds. The global art investment fund industry is still a nascent and niche market but over the last few years has been proving it will grow gradually. According to data presented in the Art & Finance Report 2013 (Deloitte and ArtTactic), the art fund market is showing modest growth in the United States and Europe as existing art funds raise new capital. In the first half of 2014, the overall art fund market was estimated at US$1.26 billion, down from US$2.13 billion in 2012. In 2014 an estimated 72 art funds and art investment trusts were in operation, and 55 of these were in China. In Portugal the only art investment fund is Art Invest – BANIF.
Keeping in mind this thought of art as an investment could be one of the several reasons why there is a large number of art fairs sprouting like mushrooms across the world. More than showing the new artworks and artists to extend networking and improve portfolios, the art gallery dealers and antique dealers participate in international art fairs to be part of the global art market circle. The rise of art fairs and the event-driven market place has been a well-documented trend over the last ten years, and it has drastically changed the way many art dealers conducted their business. During 2012 art dealers did see both positive and negative sides to this trend. While the positives were clearly the ability to acess new global collectors as well as providing greater opportunities for networking within the trade, the negatives included escalating costs, pressures on supply and acess to fresh material to exhibit and a lack of focus and capacity of their local businesses.
Even though the participation fee and related costs are extremely expensive, in the last few years a number of small and medium-size galleries have been upping their participation, alongside the powerhouse dealers, who have a fair circuit routine, exhibiting in thereabout 15 international fairs a year. Dealer and art fair owner, Ed Winkleman, at Sotheby’s Institute on the event “Art fairs: An irresistable force in the art world?” (27th May 2014, artnet news) stated the rise of the art fair from three main events in 1970 (Cologne, Basel and Brussels) to a recent report that shows in 2005 there were 68 fairs, and by 2011 there were 189, adding that he counted about 220 current contemporary art fairs around the world. Unfortunately in Portugal the art fairs are decreasing in figures and there is a scarce number of art galleries and antique dealers to be part of the international art fairs range nowadays. Only the top end
Portuguese ones can afford the costs of participating in one of the more than 200 international fairs.
This dissertation is divided in three chapters, in which the first and second one are theoretical and chapter three is empirical. In the first chapter the main goal is to describe the financial situation of the global art market and compare it with the Portuguese art market, focusing in its numbers on chapter two. Chapter three has a more analyst nature. It will be presented a financial analysis of data from several Portuguese companies connected to the art world in Portugal: the contemporary art galleries, antique shops and auction houses, from the region of Lisbon. Fundamental analysis of balance sheets and income statements by specific techniques and by calculating and interpreting the financial and economic indicators will underline a diagnose background of the financial position of a company, and therefore the financial position of the art market in the region studied.
This study will provide information about a company’s financial position and performance, useful to a wide range of users in making economic decisions and will be of interest to financial managers and to global investors who are interested to invest in this market. Ultimately the objective of this study is to make an economic and financial analysis between the selected companies using financial economic indicators to understand their evolution over the last four years, and finally be able to draw conclusions on how the Portuguese art market has been flowing and which directions it will take.
CHAPTER 1 – THE ART MARKET IN PORTUGAL
Even though artists and art lovers tend to dissaprove of the monetary connection in art, this connection is nervertheless undeniably present. (Abbing, 2002: 50)
We could define the art market as the space in which art is traded for currency whether that currency is money, art or power. Similar to any economic system where there is an exchange of a commodity through its buying, selling or trading, it differs on the uncertaintly value of what is being sold, as if the value of the artwork is set arbitrarily at first, and then adjusted based on not only multiple factors and influences – promotion, development of the artist’s style, social networking, patron taste, competition, among several others; but also on levels of supply and demand.
To achieve a higher demand and economic sucess, in case of a new or younger artist, there is the need of having an established art gallery owner or art dealer who will work as a marketeer, promoting the artist’s artworks in the corresponding environment – collectors, buyers, art critics, art fairs. The art market revolves around supply and demand of works over time, but in the last few decades this global market has its supply overweighting demand, as buyers compete over a selected group of artists or artworks from a certain period in time, who already have gained recognition, setting disproportionately high prices in the process while the majority of new artists are forced to use their works as a form of currency in maintaining their livelihood while they attempt to reach reputation.
Self-support obviously provides the greatest aesthetic freedom for artists, and with sufficient independent resources they can create their own distribution system. The growth of the art market liberates artists not only from their dealers or the people who subsidize them but also from the tyranny of mainstream taste. The one-person show, often held by almost unknown artists, has become a common sight in most artistic capitals of the world. However, artists must justify their outsider status to become marketable, and therefore distribution channels have a crucial effect on reputations (Goodwin, 2008). Artists are aware that market
value and aesthetic value sometimes correspond. Aesthetic value cannot be independent, it cannot rest on the intrinsic qualities of a work of art. Instead it is a social value, that is influenced by social circumstances including market value.
In the economic extent of this market, the triangle – production – distribution – consumption, compounds the fundamental relationships of the market. In the course of this study we will approach the last two levels – distribution channels and consumption.
Before we start an analysis on how this domestic market has been changingin the last decade, we need to understand the financial context of the country in that period of time.
1.1. Financial context of the Portuguese economy and its impact on the art market
Portugal was the third country to request international financial assistance from the European Union and the International Monetary Fund in 2011, but there were several events during the period of 2000-10 that led up to Portugal’s request. Even before the global financial crisis there were warning signs about some of the countries in the euro area. One of the more pressing alerts came from the small country of Portugal and was brought to the attention of economists and policymakers. Since 2001 Portugal experienced low growth and in 2003 went into recession, and became the only euro area country together with Germany to register negative growth that year (Lourtie, 2011).
The prospect of euro accession in the second half of the nineties had led to a sharp drop in interest rates with real interest rates approaching zero at the end of the decade. This triggered an unprecedented and substantial wealth effect strongly felt by all domestic agents, leading to rapid internal demand growth and decrease of private saving. With domestic demand sustaining the economic boom, unemployement shrank to less than 5 percent exerting a considerable upward and pressure on wages. The economy became overvalued and current account deficits grew increasingly larger (Lourtie, 2011). Additionally the Portuguese economy was hit in the late nineties by important shocks: the enlargement of the European Union to the central and eastern European countries and the inability to compete in world trade markets because of specialization in low-wage and low-value-added goods, which were
especially hurt by competition from Eastern Europe and emerging markets like China (Reis, 2013).
On a political dimension since 2001 the country was in a serious financial situation after the renouncement of the Prime Minister António Guterres, and subsequently the resignation of his successor, Durão Barroso in 2004, to receive the position of President of the European Comission. Developments in the macroeconomic context and in international trade meant that Portugal was not in a good position to profit from rapid European and world expansion in the nineties and 2000’s. When private domestic demand dropped sharply in 2001-02 with it stalled the engine of recent economic growth. The country’s landscape had changed immensely with public investments notably on roads and other public infrastructures. So had consumption patterns changed dramatically and propriety ownership increased substantially in the past 10 years – a new political cycle started in 2002 undercoming the country’s need to cut back past excessive consumption and spending (Lourtie, 2011).
According to Blanchard (2007) Portuguese economy had been in a slump since 2000, with anemic productivity, almost no economic growth and increasing unemployment. At the same time wages had been rising and the country’s competitiveness falling, and both the government and the country’s private sector were acumulating debt at a rapid pace. As suggested by Reis (2013) this slump happened because most of the capital inflows funded unproductive firms in the nontradables sector, causing economy-wide productivity to fall and the real exchange rate to rise, and taking resources away from the tradables sector. Meanwhile generous past promises on the old-age pensions led to continuous increases in taxes, which discouraged work, leaving the country particularly exposed to the financial crisis that came at the end of the decade and after 2010, a sudden stop in capital flows plunged the country into a crash.
In 2008 the art market that was no longer stable for several years, given the impact of a major international crisis emphasized the problems and weakened the domestic art market. By 2010 the Portuguese government announced a package of austerity measures, including cuts in public spending and tax increases, to reduce Portugal’s budget deficit, but one year after the country was forced to apply for European Union financial assistance to help it cope
with its budget deficit. The European Union and the International Monetary Fund agreed a 78bn-euro bailout for Portugal, on condition of sweeping spending cuts. A positive turning point in Portugal’s strive to regain acess to financial markets was achieved on October 2012 and in the beginning of 2014 Portugal managed to exit international bailout without seeking back-up credit from its lenders. The domestic art market only saw its return in the year of 2011, which represented a remarkable recovery from the previous years, approaching art market values of 2007-08.
On an international extent events like the Gulf War or the terrorist attacks of 9/11 show that economic and financial uncertanty are potentially a far greater problem for the art market than an actual financial or economic movement (Forrest, 2008). When the Gulf War started in 1990, the times were of great economic uncertainty and people were seriously questioning the long term viability of the art market. During this war the lack of liquidity of major financial markets combined with the bankruptcy of financial institutions and the economic climate of recession affected the art market and its prices shrank by 55% between 1990-93 (Hernando, Art Pulse Magazine). As a result on national level the increase of prices and thus the closure of new-born art galleries that opened with the economic boom of the mid-80s, the art market felt a sharp decline and would not return fully operational until the flourishing of the economy (Nunes, 2012). The domestic art market saw in the 2000s considerable changes, prompted by the creation of some private art collections, the increase of public sophistication on the art field and a new behaviour of economic elites in the definition of symbolic goods that defined its bylaws (Afonso, 2012). One of the major changes was the growing interest in national modern and contemporary art, manifested in the establishment of private and corporate collections, and the very rapid development of specialized galleries, as we will develop further in the next chapters.
1.2. Primary Art Market
The primary art market is art directly from the artist, offered for the sale for the first time. Contemporary art galleries and its dealers are the utmost important to this market. They have the ability to advertise and promote their artists which help elevate the artists career and provide a certification of quality to the art pieces the dealers endorse. This is crucial in
making the art market flow, especially in terms of contemporary art because it is very much subjective, rendering it vulnerable to sudden fluctuations in price. Artworks purchased directly from the dealer will usually be cheaper than those bought at auction, considering the primary market tries to keep art prices below auction prices, and indubitably because they are newer and fresher.
To be a successful dealer it may be tougher than it seems, as the market is constantly being overwhelmed with new contemporary art galleries every year and to reach the high-end market they must brand themselves and their galleries. According to the National Statistical Institute (INE) from 2013, in Portugal from 2010-11 there were 6 new contemporary art galleries; there was a decrease in 2011-12 when 84 closed; but again an increase of 247 new contemporary art galleries in the turn of 2012-13. According to Don Thompson (2008, p: 32) “the branded dealers are the gatekeepers who permit artists acess to serious collectors”. Being with a branded dealer allows the artist to hang out with other artists at the top of the food chain. Branding is used to the advantage of both the artist and the dealer - through branding and marketing, dealers gain notoriety that is transfered to the artist and their art and commonly leads to a increase in the value of the artist’s work. The success of the artist in turn increases the reputation of the dealer even more and so the system behaves in a cyclical manner.
1.2.1. Contemporary art galleries
The Portuguese case is quite a different issue, as there are no branded dealers but rather a limited group of average and high status contemporary art galleries. Even though the scenario is incredibly distinct from others in European cities, due to the small size of the country and the absense of cultural and artistic support, in Portugal there is a few number of galleries that manage to become international.
In the first decade of the 21st century there were made several studies on the cultural aspects of the Portuguese art market, two of them regarding the art galleries in Lisbon, written with the contribution of the Portuguese art critic and curator Alexandre Melo (2001); João Magalhães – who studied in the Sotheby’s Insitute of Art and wrote for the magazine L+Arte,
made a brief but yet very concise analysis of the market in 2008; on the national contemporary art galleries and their negotiating techniques Inês Curto contributed with her Master’s dissertation in 2011; and finally the most recent (2012) and accurate analysis was made by Alexandra Fernandes and Luís Afonso, focused on the Portuguese auctions and history of the art market in Portugal.
According to Alexandre Melo’s analysis (2001), in the turn of the century the primary market had clear evidences of structural weakness and absense of relevant artistic traditions caused by the non existence of art collections, prestigious artistic institutions and cultural policies during the 20th century; but also due to the hipersensibility to changes in political, economic and ideological circumstances in which the art markets depends on, and is called in question when there are significant changes in the economic and political environment of the country as we have discussed earlier in this study.
1.2.2. Art fairs: the Portuguese case
One of the most important initiatives for the primary market (art galleries) in the beginning of the century was the Lisboarte Contemporânea – a project that linked a number of Lisbon art galleries to the Lisbon City Council in a coordinated chain of initiatives. The last edition was in 2010, and included the participation of simultaneous exhibition openings in fourteen galleries. The project lasted for ten years and its survival had something related to the stubbornness and risk taking of the Lisbon art dealers (Pinharanda, 2001). For the visitors, collectors and art critics continued to be trilled with what was offered to them, and so there was another project that happened in the same period of Lisboarte Contemporânea.
The Lisbon Contemporary Art Fair or Art Lisbon had a notable success in the 2000’s editions. This art fair, responsability of AIP – Fairs, Conferences and Events in partnership with the Art Galleries Portuguese Association (APGA) was performed annualy in November and reached approximately twenty thousand visitors. Maria João Rocha (2001), director of the AIP – Fairs, Conferences and Events, once said the intention was to conduct a quality fair which may enter the international art fairs circuit. Even though being small this fair had the same principles of ARCO Madrid. The only contemporary art fair in the country was held
until 2011, counted with eleven consecutive editions, and was first cancelled in 2012 due to the economic downturn in the sector and again in 2013. The Art Lisbon in its best year, received 45 Portuguese art galleries, and 25 foreign, many from Spain, European countries, Brazil and Mozambique. In 2012 when the Art Lisbon was postpone, there was the introduction of a new project involving the creative industries that still exists nowadays. The Festival IN – Innovation & Creativity is an event that brings together the latest trends of creative economy and is assumed as a promotional platform for innovation and creativity of cultural and creative industries.
After a three year interregnum and the end of the Art Lisbon, in 2014 the first edition of Est Art Fair – International Contemporary Art Fair, took place between 10th and 13th of July at the Estoril Art Congress Centre. This brand new art fair was a positive contribute and a breath of fresh air for the Portuguese art market and thanks to its positive results the fair will continue annually in July, when the international art fairs season ends, and probably in a few years it could be part of the international art fairs circuit. The edition of 2014 featured the presence of 35 galleries whereupon 14 were Portuguese and the remaining were foreign, from nine countries: Brazil, Colombia, France, Germany, Mexico, Portugal, Spain, United Kingdom and United States.
Today the art market players and artists have to deal with the reality that there are far more people who will see their works in a fair than in galleries. Fairs have become more of a lifestyle choice than just for the art world, attracting people with an interest in art, who are not necessarily collectors or dealers and start to include these (social upper class) events in their schedules. Despite the discontinuity of several fairs held during the turn of the century and the economic situation of the country, the 2010s showed signs of increase in the interest of the market players in participating and organizing events and fairs as they are becoming more important for the development of the domestic art market and to set Lisbon city and Portugal in the route of the international art fairs, having a strong impact on the social and cultural context, in which the goal is to bring more visitors and collectors to get to know the Portuguese art market and to introduce less well-known art galleries in the international market.
1.3 Secondary and tertiary art market
The secondary art market involves the resale of artworks, either through private sales or auction houses. “Once distinct the tertiary or auction market is now indistinguishable from the secondary one” (Robertson, 2005: 18). There are several studies in which the secondary art market is made by the antique shops and a third one by the auction houses, but in this study we will only take in consideration the antique and auction sectors as part of the secondary market.
The art market is global and operates internationally through the activities of the secondary market and substantially from the activities of the leading auction houses in the dominant cities of this market, those set the market ground rules and are the ones to benchmark the worldwide prices of artworks by their auction prices. The job of the auction houses allow us to obtain a reliable and continuous survey of the estimated values and auction prices of artworks (Codignola, 2003). However the market share held by the contemporary art galleries and antique shops is a different issue, as there is not a system for recording information on their business activities, and hence sales figures and turnover are not made public.
1.3.1. Antique Shops
Antique shops are geographically concentrated in Lisbon, and follow the international trend of moving towards specialization (Magalhães, 2012) to be able to compete with the extremely agreesive auction market. According to Castilho (2015) the antique dealers activity has suffered in recent decades a great turmoil whereupon it had to adapt to the digital world, to the internet age and to the benchmark international art and antique fairs that bring together the most powerful collectors. Even though the Portuguese antique dealers market is a small-scale market and having to keep up with the international reality, the Portuguese Antique Dealers Association (APA) has been working intensively to increase its intervention in the art market and gradually became the favoured partner of several institutions related to art and antiques market. The APA was founded in 1990 and aims to study and negotiate the diversed segments of this specific market, contributing for a safe and attractive investment. It will
commemorate this year (2015) its 25th anniversary as well as the 20th anniversary of the Lisbon Art and Antiques Fair, which it is now a highlight of the cultural calendar of the city.
The Antiques sector has been supported by important events over the last decades, but in 2012 given the huge success that the Antiques Biennal Fair acquired since 1985 and responding to the concerns of its members and its audience, the Portuguese Antique Dealers Association (APA) decided to reevaluate the initiative and turn into an annual event called Lisbon Arts and Antiques Fair taking place in the National Cordage in April. Further to changing the frequency of the event, APA changed its statues so that the event would include the contemporary art sector, following the example of the international antiques fair such as the Maastricht Arts and Antiques Fair. The Lisbon Arts and Antiques Fair is the most important art fair at national level, bringing together not only the main representatives of the Antiques sector in Portugal, but also relevant contemporary art galleries from the Portuguese art scene.
1.3.2. Auction Houses
The Portuguese auction market is concentrated in the city of Lisbon and has been growing in numbers of new auction houses each year, as there are more people wanting to sell their artworks and more collectors interested in investing in this market.
According to the study by Afonso and Fernandes (2012), there is a dominance of decorative arts in lots sold at auctions – 71,42%. This higlights the Portuguese traditional, conservative and nationalist taste that moves buyers to invest in decorative arts, rather than modern and contemporary painting, leaving this sector in the circuit of art galleries.
CHAPTER 2 – SIZE AND NUMBERS OF THE PORTUGUESE ART MARKET
The global art market saw significant growth between 2003 and 2007 (see Table 1). “2007 represented a peak year, with the market estimated to have reached a high of €48.1bn, its highest ever total” (McAndrew, 2010: 23). After four consecutive years of rapid price inflation the art market experienced a change in its aggregate trend in late 2008, when it succumbed to the pressures of the global financial crisis. The downturn strongly affected income and personal wealth, and consumer consumption especially in the United States and Europe (McAndrew, 2011). “After recovering strongly in 2010, the global art market has experienced mixed performance within different sectors and different nations” (McAndrew, 2013: 20). The fast recovery of the 2008-09 crisis is probably connected with the deep changes in the geography of the art market (Afonso, 2012). Since the beginning of the new century, western countries have progressively lost weight in this sector for the benefit of the Asian market, settling China has the holder of the largest share of the art market.
Table 1 - The Global Art Market: Value and Volume of Transactions (Arts Economics 2013)
Source: Tefaf 2014
2.1. Public Support
In Portugal the art market has not kept pace with the international recovey, much due to the reduction of public support and private acquisition of artworks by institutions. Portugal does not have a strong tradition of private cultural philantropy nor does it have many private foundations dedicated to supporting the arts. There are no results of public and private support of the domestic art market, but on a bigger picture, understanding the values in the Portuguese
Year 2003 2004 2005 2006 2007 2008 2009 2010 2011 2012 2013 Value (€m) 18.631 24.385 28.833 43.331 48.065 42.158 28.335 42.951 46.351 44.091 47.419 Volume (m) 25.4 26.6 28.2 32.1 49.8 43.7 31.0 35.1 36.8 35.5 36.5
cultural sector it is possible to perceive the growth (or stagnation) of the arts in general. By evaluating the government and its relationship with the culture, we may infer the reasons why the values are not so high compared with other European countries.
One important event was the abolishment of the Ministry of Culture, a department of the Portuguese government responsible for issues related to the Portuguese culture, established since 1995. In 2006 there was a reorganization in this Ministry and the resources for culture were reduced in number of departments through the merging and abolition of them. The gradual disinvestment in the field of culture in terms of both funding allocations and development and implementation of integrated strategies took the new governement of 2011 to downsize the administrative structure of the Ministry of Culture to a Secretary of State (Gomes and Martinho, 2011). In addition since 2011 the state budget for culture has been decreasing due to domestic spending cuts, reaching the lowest value in fourteen years of €167,7M (see Table 2) and in 2013 - €189,74M.
The tables and charts presented below represent the cultural sector budget, covering values from art galleries, museums, concerts, performances, cinema and cultural heritage.
Table 2 – Culture provision in the state budget in % and millions € 1998-2012
Percentage * Value (€M) 1998 1999 2000 2001 2002 2003 2004 2005 2006 2007 2008 2009 2010 2011 2012 0,6 0,6 0,6 0,6 0,7 0,5 0,5 0,6 0,5 0,4 0,4 0,3 0,4 0,4 0,4 198.1 210.2 249.1 293.8 293.5 255.2 273.4 285.1 260.5 242.6 246.5 212.7 236.3 201.3 167.7
Source: Ministry of Finance, State Budget Report. *State budget percentage for the Ministry of Culture until 2011; from 2012 the Ministry of Culture was replaced by the Secretary of State for Culture.
Figure 1 – Public expenditure on cultural activities by European countries (% of GDP)
Source: Eurostat, 2013
An insufficient development of cultural activities removes the Portuguese society from the international standards and therefore has repercussions on the economy and on the global development of the country. Figure 1 above shows the differences in public expenditure between Portugal and three other European countries.
Nevertheless there is still an active department that has been supporting the Portuguese arts in general – the Directorate-General for the Arts (DGArtes). This central department of the former Ministry of Culture, now Secretary of State for Culture, was created as a result of the reorganization of the Arts Institute, as part of the Civil Service reform, whose mission is to coordinate and execute artistic support policies. DGArtes assures the implementation an coordination of the structural measures for the performing arts, visual and digital arts (disciplinary crossings, dance, music, theatre and fine arts); it promotes equal access to the arts, ensuring the diversification and decentralization of artistic creation and production. The direct support through subsidies from DGArtes is imperative for the survival of some artistic and cultural agents, as it smooths the access to promotion and distribution channels and creates mechanisms and appropriate incentives to its implementation.
0.0% 1.0% 2.0% 3.0% 4.0% 5.0% 6.0% 7.0% 8.0% 1995 1996 1997 1998 1999 2000 2001 2002 2003 2004 2005 2006 2007 2008 2009 2010 2011 Portugal Spain UK Germany
Resorting to the last financial reports (see Figures 2 and 3) is possible to assert that the period 2009-12 witnessed several changes and undoubtebly the most important was the amount of funding as part of the measures for the crisis, installed in 2008, which has worsened in recent years. The number of entities supported by DGArtes in this period, has increased between 2009-11 and in the year 2012 a clear decrease reached 20%. In 2011 DGArtes funding for fine arts reached its peak but in 2012 saw a sharp decrease of 70%.
Figure 2 – Number of supported entities and % of subsidies to Fine Arts by DGArtes
Source: Estudos e Sondagens, ES-FE, 2013
Figure 3 – Direct funding evolution between 2009-12 by DGArtes
Source: Estudos e Sondagens, ES-FE, 2013. The fine arts funding values were calculated by the percentage given in the study of ES-FE.
10.8 10.2 17.4 11.7 0 2 4 6 8 10 12 14 16 18 20 0 50 100 150 200 250 300 2009 2010 2011 2012 unit: 1 unit: percentage 0€ 50€ 100€ 150€ 200€ 250€ 300€ 350€ 400€ 0€ 5€ 10€ 15€ 20€ 25€ 2009 2010 2011 2012 Th ou san d s M il li on s
Figure 4 – Supported entities (%) by DGArtes in 2012
Source: DGArtes report 2012
As figures shown in the chart above (Figure 4), it is clear that most of the entities supported by DGArtes are established in the Lisbon region, and secondly in the Northern region. This indicates that cultural and artistic entities are quite centralized lying in the two main Portuguese cities, Lisbon and Oporto. The high concentration of supported entities in Lisbon region is the result of the existence of older structures and longer history of given subsidies in the past, and also because the contests stipulate an accumulation of subsidies in this region justified by the number of entities, and thence contributing to regional disparities (Santos and Moreira, 2013: 94).
The importance of public support remains essential for the maintenance of these entities. The weight of the central support of DGArtes is crucial, as the financial analysis shows but the municipalities support have become truly necessary (see Figure 5), particularly with regard to indirect and infrastructural support, providing access to working space, streamining procedures, the implementation of a local and regional network and also the direct support of the entities in cases of delay or failure in the core direct support of private fundings (Santos and Moreira, 2013).
53% 19%
16% 3%
9%
Percentage of supported entities by DGArtes in
Portuguese regions 2012
Figure 5 – Municipal expenditures in Cultural and Creative Industries
Source: Statistic for the Portuguese Culture INE 2013
2.2. Numbers from the Primary and Secondary Market
After looking to Table 3 below we can see a growth in the number of galleries and other spaces with temporary exhibitions in Portugal. In 1990 there were 332 galleries and spaces with temporary exhibitions and in the last data analysis from the year 2013, the numbers grew to a substantial 1.050.
Table 3 – Cultural Statistics on the number of galleries, exhibitions, artworks and visitors
2000 2008 2009 2010 2011 2012 2013
Number of galleries and other spaces with
temporary exhibitions 479 840 885 881 887 803 1.050
Number of exhibitions 4.255 6.859 7.235 7.261 7.304 5.854 7.149
Number of artworks
exhibited 163.425 304.850 282.721 279.984 297.836 234.563 268.065
Total visitors (1.000) 3.787 8.049 8.625 9.078 8.835 - -
Source: INE – National Statistical Institute, 2013. Note: In the year 2012 and 2013 there are no results on total visitors as this category was suspended.
340 434 407 402 378 0€ 50€ 100€ 150€ 200€ 250€ 300€ 350€ 400€ 450€ 500€ 2000 2010 2011 2012 2013 M il li on s
Figure 6 – Number of galleries by region in 2013
Source: Statistics for the Portuguese Culture INE 2013
Today there are 41 contemporary art galleries which are part of the Portuguese Art Galleries Association (APGA) that form the core identity of the primary market. APGA was established in 1989 and it is a national and non-profit association whose activity is geared towards the promotion and dissemination of contemporary art. It also advocates the interest of galleries within the cultural entities and incites the exchange of ideas among its members, contributing to the development of high standards of professionalism of the galleries belonging to the association.
Concerning the auction houses and antique shops of the secondary market there are no numbers for the exact quantity of these companies in Portugal. Instead, there are values regarding the turnover of the auction houses market: according to Fernandes and Afonso’s study (2012) the Portuguese auction market activity (based on the data from the three main auction houses from Lisbon) between the years 2005 and 2011 shows there was a clear decrease in the turnover volume, where sales figures ranged from the minimum of €1,00 and a maximum of €400.000, with half of the lots being sold below €420,00. As shown below the years 2006 and 2008 reached the highest values but after the year 2008 there was a sharp decline which may be associated with the peak of the economic crisis and only returning to higher values in 2011, approaching values previous to 2008. For the years 2012 and 2013 we will analyze the values later on this study.
289 255 256 139 42 34 35 North Central Lisbon Alentejo Algarve Açores Madeira
Figure 7 – Annual turnover by auction houses
Source: “Os Leilões e o Mercado de Arte em Portugal – estrutura, história, tendências”, 2012
0€ 5€ 10€ 15€ 20€ 25€ 2005 2006 2007 2008 2009 2010 2011 M il li on s
Annual turnover
CHAPTER 3 – ECONOMIC AND FINANCIAL ANALYSIS OF THE PORTUGUESE ART MARKET FROM 2010 TO 2013
3.1. Introduction
First there was the choice of topic and the definition of the objectives we set to achieve. A literature review on the topic was made, using several types of economic and financial analysis on art markets in other countries, as an example. We then proceeded to a definition of the studied sector, followed by the analysis of the accounts from the companies that structure the market itself. In the end there is a reflection on the economic and financial situation of the Portuguese art market and on its measures to reach success.
In Portugal, as significantly data analysis with almost no financial details on art market, remains under research, there is a rise in academic studies of this matter, but mainly consisting on the cultural aspects of the market. Despite the Portuguese art market is considerably small compared to other European markets, it is very much compacted in the two cities of Lisbon and Oporto, as we have seen previously in this study. Figures related to total sales from contemporary art dealers, antique dealers and auction houses are difficult to obtain. The study made by Fernandes and Afonso (2012) is very important as it shows values and sales from the Portuguese auction houses during the last decade.
In this chapter we will proceed to an economic and financial analysis of the three sectors that create the Portuguese art market, with effect on the consolidated accounts and data of the years 2010, 2011, 2012 and 2013. We will study and analyse the viability, stability and profitability of them, comprising a set of indicators that will allow us to understand the financial position of the companies. Thus we will be able to assess the profitability of the three art market sectors and check if the revenues exceed the investments and operating profits.
The goal of this dissertation is to characterize the art market, using the elements presented in this study, in Portugal between 2010 and 2013, whereas the main focus is to define the following aspects:
- determine the turnover of the three players individually and estimate the global turnover in the art market in Portugal;
- define the fundamental structure of the primary and secondary market; - interpret the main trends between the beginning and end of this serie.
For the collection of information on financial data it was contacted the eInforma, a licensed brand by INFORMA D&B, a leader in the business information market. The database of INFORMA D&B contains all the companies in Portugal and is updated daily through public source and the companies themselves. INFORMA D&B kindly provided the financial data of 12 Portuguese companies linked to the art market: 6 contemporary art galleries, 4 antique shops and 2 auction houses, all of them based in the Lisbon region, except from one antique shop from Oporto. For reasons of confidentiality the names of the companies are kept anonymous, and to title them, we use the first letter of the sector and a number. A contemporary art gallery will be entitled by G1, in case of the first art gallery data analysis, and for all the others, the numbers follow respectively G2, G3, G4, G5 and G6 (temporarily inactive); for the 4 antique shops we will adress to them as A1, A2, A3 and A4; and finally for the auction houses, they will be named as H1 and H2.
3.2. Analysis of the collected data
The analysis of the collected data from the three players is divided in three segments for each player:
1. the main results from the balance sheet, the major financial statement that presents a company’s financial position: total assets, total liabilities and total equity;
2. the meaning of the operating profit and net income in the income statment of the company;
3. the use of 16 financial ratios that are key elements in the fundamental analysis process, as they evaluate the overall financial condition of a company and become relevant to investors.
Through the income statement we are also able to achieve results on the market share by sales from all three players.
In order to evaluate the values of the financial statements we will use financial ratios important for the understanding of the overall financial condition of the entities (financial ratios explanation can be found in the appendix). We will resort to 16 financial ratios divided by 4 segments:
- Liquidity measurement ratios: current ratio, quick ratio, working capital and working capital needs;
- Activity ratios: inventory turnover, average collection period (DSO), days in inventory outstanding (DIO), average payment period (DPO) and cash conversion cycle (CCC);
- Debt ratios: debt / equity and shareholder equity;
- Profitability indicator ratios: return on equity (ROE), return on assets (ROA) and profit margin.
It is necessary to take into consideration that some of these ratios are not as enlightening and effective as we would prefer, due to the fact that some of these companies have not recorded significant items, part of the balance sheets and income statements such as inventory, suppliers and sales values. The absense of these items preclude us to draw conclusions on the financial situation of some of these companies.
3.2.1. Contemporary art galleries
The six art galleries that are part of this study are based in Lisbon region, and were found in the beginning of the 21st century, except for two of them which were found in the 1980’s. This group could be included in the Beta level (Robertson, 2005), one of the four distinct levels that classify an art gallery (also auction houses are classified by this hierarchy, as we will see later on this study). The several levels of the art galleries hierarchy are determined by the quality of their works, their services and their capability to become internationally recognized.
The pyramid below (see Figure 8) is a representation of the levels described by Robertson (2005), where the first level pyramid includes the Alpha – high quality art, galleries that dictate the canons, there are only 20 to 30 Alpha galleries worldwide (Afonso, 2012); the second level, Beta – comprises galleries which are recognized on a national level and have become international recently, due to the high quality works and gross volume of sales; the third one is the Gamma level where artworks tend to devalue and prove worthless or ascend to the Beta level, smaller galleries in terms of size and services; and the fourth level is called Delta, and represents regional and local galleries with worthless unit value art.
Figure 8 – Contemporary art galleries level pyramid based on Robertson’s description (2005) Figure 8 –
In 2013, according with the National Statistics Intitute, Portugal had 1.050 galleries and other spaces with temporary exhibitions, and even though we cannot conclude with certanty how many of them are contemporary art galleries, we can foresee that probably 1% of this number represents the Beta contemporary art galleries, while the others are mainly incorporated in the third and fourth levels of the pyramid.
Through the six charts presented below, is possible to summarize the financial situation of the contemporary art galleries individually. Considering the results from the balance sheet – assets, liabilities and equity; and from the income statements – operating profits and net incomes; we present them in a chart in order to show how profitable these
galleries were over this period of time. G1, G2, G4 and G6 figures evidence a dominance of net loss, instead of net income. This occured because the fixed costs and variable costs exceeded the revenues that galleries generated in this period.
In G1 case there is a reverse of the financial situation from the year 2011 to 2012-13, in which liabilities increase significantly and assets do not follow the trend, turning equity negative. As we can see in the Figure 9, G1 had its worst values in 2012, after the assets had a sharp drop compared to the previous year, due to low revenues an high expenses and losses. It was able to recover in 2013, the approximate operating profits and net loss values of 2010.
Figure 9 – Assets, Liabilities, Equity, Operating Profit and Net Income from G1
For a better understanding of the financial ratios we will look into each companies’ financial ratios, and before analysing another sector, we will compare the ratios between the companies from the same sector, in order to achieve important results.
Table 4 – Financial ratios G1
2010 2011 2012 2013 Liquidity Ratios Current Ratio 1,0 6,7 1,3 0,3 Quick Ratio 0,8 6,7 - - -30€ -25€ -20€ -15€ -10€ -5€ 0€ -80€ -60€ -40€ -20€ 0€ 20€ 40€ 60€ 80€ 100€ 120€ 140€ 160€ 2010 2011 2012 2013 Th ou san d s Th ou san d s
Financial Balance G1
Assets Liabilities Equity Operating profit Net incomeWorking Capital 3.537,1 € 66.173,0 € 1.939,4 € -52.331,2 € Working Capital Needs 42.815,9 € 32.326,6 € - -
Activity Ratios
Inventory Turnover 4 87 - -
Average Collection Period (DSO) 35 280 18 23 Days in inventory outstanding (DIO) 99 4 - - Average Payment Period (DPO) 1 12 10 20 Cash Conversion Cycle (CCC) 133 272 - -
Debt Ratios
Debt / Equity ratio 18,41 -6,91 -1,26 -1,39 Shareholder Equity Ratio 5,15% -16,93% -391,52% -254,02%
Profitability Ratios
Return on equity (ROE) -147,09% 150,69% 66,84% 22,39% Return on Assets (ROA) -7,58% -25,52% -261,71% -56,87% Profit margin -6,07% -55,28% -80,65% -23,87%
Note: G1 inventory values for 2012 and 2013 are €0. These values influence the results of quick ratio, working capital needs, inventory turnover, days in inventory outstanding and cash conversion cycle for the respective years.
To make an efficient interpretation of the liquidity ratios, one must know that the higher the values, the better their results, meaning it increases the likelihood of the entities to pay off their short-term debts obbligations. From Table 4 above, we can say that G1 in 2011 presented a very safe margin to cover its debts, as it was the only year when it managed to have the highest values in all liquidity ratios. Working capital (WC) is an indicator that helps to understand if an entity will be able to meet its current obbligations. In G1 case the first three years, there is a positive WC, meaning that it was able to do its payments on time, especially in 2011, when it reached the highest amount. In contrast the year 2013 shows a negative WC, justified by the increase of current liabilities compared with 2011, while current assets maintain the same low values of 2011. Working capital needs (WCN) shows high positive values for all the years, which is not advisable, as WCN should be lower, so that the business could meet its short term liabilities without the need to rely on its WC or additional financing for its operational cycle.
Activity ratios measure a company’s ability to convert different accounts within its balance sheet into cash or sales, and it is important in determining wheter an entity’s management is doing a good effort on generating revenues and cash from its resources. In G1,
we only considered the activity ratios for 2010 and 2011, as the results on four of them were not enough to obtain conclusions. In 2010, the low inventory turnover implied that G1 failed to accurately project what the demand was for the product that it sells. A higher ratio is the goal, as it is better to sell inventory in the shortest amount of time possible. The following year it replenished its inventory 87 times per year. Cash conversion cycle (CCC) is a ratio commonly used by retailers to determine how quickly a company can convert its products into cash through sales, whereas the shorter the cycle, the less time capital is tied up in the business process. The ratios DSO and DPO from G1, show an improvement, as they are growing. These ratios, as well as the profitability ratios will be calculated for the same time periods for the company’s competitors, in order to compare which one is doing a better job.
The debt ratios give a general idea of the company’s overall debt load and the overall level of financial risk a company and its shareholders face. It can be seen from the Table 4 that G1 had negative debt/equity ratios from 2011 to 2013, which means that the company’s net worth is negative, and in this case, very few bankers will extend loans to a company like this one. Negative net worth indicates the company has been losing money for a long time and a corrective action may be required by companies (eg. inject more equity), investors (eg. disinvestment) or lenders (eg. discontinue further lending). Negative debt/equity ratio like the ones from G1, suit companies operating under volatile and unpredictable business environment, as they cannot afford financial commitments that they cannot meet in case of sudden downturns in economic activity. In 2011 the company had a 18,41 debt/equity ratio, which means that more assets are financed by debt that those financed by money of shareholders.
The shareholder equity ratio indicates the relative proportion of total assets that are financed by the shareholders and not creditors, and it determines how much a shareholders would receive in the event of a company-wide liquidation. In 2010 shareholders own 5,15% of the assets of G1, but in contrast the following years show a negative ratio. This could refer to negative return on equity that results from the higher interest on debt than the investment return.
Profitability ratios are use to assess a business ability to generate earnings as compared to its expenses and other relevant costs, incurred during a specific period of time. For most of these ratios having a higher value relative to a competitor’s ratio or the same ratio from a previous year is a good sign that the company is going well. The values for Return on equity (ROE) for the covered period, except for 2010 (-147,09%), show positive values. These values indicate how much the shareholders earned for their investment in the company. The results show an increase from 2010 to 2011, but then a gradually decrease takes place, thanks to the decrease of negative equity in 2011-12 and 2012-13, as shown in Figure 9.
The Return on assets ratio (ROA) indicates how profitable a company is relative to its total assets. In G1 the values are negative and fluctuate due to net loss values that also fluctuate, as we have already seen in the financial balance chart above. This negative values indicate that the company is not employing their assets to make profit. The higher the return the more efficient management is in utilizing its assets base. Another important profitability ratio is the Profit margin ratio (PM) that shows what percentage of sales are left over after all expenses are paid by the business and how effectively a company can convert sales into net income. The G1 results show a negative profit margin, due to a decrease in sales between 2011 and 2012 and a very high net loss. This situation prevents the company to be more profitable, and it shows no control over its costs compared to its competitors.
The same situation as G1, happens in G2 (Figure 10), when liabilities exceed assets but on a bigger scale (millions €) – liabilities increased in more than €80.000 from 2010-11, almost in €100.000 in 2011-12 and finally they increased in more than €250.000 in the last year, exceeding €1M in total liabilities. There is a dominant presence of net loss during the period studied, reaching the worst values in 2011 when losses exceeded -€90.000. Between 2011-12 there was an improvement when net loss reached almost €-20.000, but G1 finished the period with a net loss of more than €-40.000.
Figure 10 – Assets, Liabilities, Equity, Operating Profit and Net Income from G2
Table 5 – Financial ratios G2
2010 2011 2012 2013
Liquidity Ratios
Current Ratio 0,6 0,5 0,6 0,6
Quick Ratio 0,5 0,4 0,5 0,5
Working Capital -313.089 € -398.392 € -367.724 € -413.321 € Working Capital Needs 304.431 € -457.677 € -489.209 € -118.050 €
Activity Ratios
Inventory Turnover 31 7 12 2
Average Collection Period (DSO) 76 - 34 36 Days in inventory outstanding (DIO) 12 51 31 206 Average Payment Period (DPO) 18 160 150 218 Cash Conversion Cycle (CCC) 70 - -85 24
Debt Ratios
Debt / Equity ratio -2,42 -2,07 -2,23 -2,61 Shareholder Equity Ratio -70,41% -93,53% -81,34% -62,12%
Profitability Ratios
Return on equity (ROE) 18,87% 23,76% 4,20% 9,95% Return on Assets (ROA) -13,28% -22,22% -3,42% -6,18% Profit margin -6,21% -13,30% -2,22% -6,91%
Note: G2 customers value for 2011 are €0. This value influences the results of Average collection period (DSO) and cash conversion cycle for this year.
-100€ -90€ -80€ -70€ -60€ -50€ -40€ -30€ -20€ -10€ 0€ -.60 € -.40 € -.20 € .0 € .20 € .40 € .60 € .80 € 1.0 € 1.20 € 1.40 € 2010 2011 2012 2013 Th ou san d s M il li on s
Financial Balance G2
Assets Liabilities Equity Operating profit Net incomeCurrent ratio measures the ability that the company has to cope with current liabilities using its current assets. Quick ratio is a similar measure, but it deducts the value of inventory in current assets. G2 case presents very low current and quick ratios, fluctuating between 0,4 and 0,6, this is caused by the considerable difference between current assets and current liabilities. The negative values for WC indicator are also justified by the same situation. WCN ratio had a positive value in 2010 thanks to low trade and other payables which had a smaller impact on the final result.
The years 2010 to 2013 show positive results in activity ratios: inventory turnover is gradually decreasing, as the cost of goods sold decreases and inventory increases; DIO and DPO values range from 12 to 218 days; and finally CCC seems to have reached a very good result in 2012, when it achieved a negative result. Some companies need to have positive and high CCC ratio values, but in the case of art galleries, a lower or negative ratio is desirable. It means that the gallery did not pay its inventory until after it sold the final product associated with it, which in this situation the final product is the artwork.
Like the current and quick ratio, the two debt ratios have constant values, which maintained stable, showing a slight improvement in shareholders equity ratio from 2011 to 2013. The negative equity of G2, explains the negative debt ratios.
As already seen in the G2 financial balance chart above, net loss is present in the covered period. This net loss will influence the profitability ratios: ROE has been decreasing, but 2010 was clearly a good year, has it shows a 18% ROE, which means that in 2010, G2 had a more efficient management in utilizing its equity base and had a better return to its investors. ROA and the Profit margin have been seeing a moderate increase, although they present negative values, especially in 2011, due to a net loss of more than €90.000.
From Figure 11, we can see that G3 values are clearly higher than the others with assets around €8M and €10M and liabilities decreasing gradually in the last two years, showing a very attractive financial performance. The difference of assets to liabilities was around €8M more, in the first two years, and from 2012 to 2013, this difference decreased to slightly more than €7M. In 2010 operating profits accounted for over €20.000 more than net