CHEMICAL AND BIOCHEMICAL TOOLS TO
ASSESS POLLUTION EXPOSURE IN AQUATIC
ECOSYSTEMS
FACULDADE DE CIÊNCIAS DO MAR E DO AMBIENTE
(Dissertation presented at the University of Algarve to obtain the degree of
Doctor in Philosophy in Environmental Sciences and technologies, Area of
Aquatic Environment)
Orientador: Doutora Maria João Bebianno Co-orientador: Doutora Cinta Porte Visa Constituição do júri:
Presidente: Reitor da Universidade do Algarve
Vogais: Doutor Christophe Minier, Doutor William J. Langston, Doutora Maria Armanda Reis Henriques, Doutora Maria Helena F. R. da Costa, Doutora Maria João Bebianno, Doutora Alexandra Cravo, Doutora Cinta Porte Visa, Doutora Ângela Serafim
FACULDADE DE CIÊNCIAS DO MAR E DO AMBIENTE
CHEMICAL AND BIOCHEMICAL TOOLS TO ASSESS POLLUTION EXPOSURE IN AQUATIC ECOSYSTEMS
(Dissertation presented at the University of Algarve to obtain the degree of Doctor in Philosophy in Environmental Sciences and Technologies, Area of
Aquatic Environment)
Denise Robina Teixeira Fernandes
Orientador: Doutora Maria João Bebianno Co-Orientador: Doutora Cinta Porte Visa
Constituição do Júri:
Presidente: Reitor da Universidade do Algarve
Vogais: Doutor Cristophe Minier, Doutor William John Langston, Doutora Maria Armanda Reis Henriques, Doutora Maria Helena F. R. da Costa, Doutora Maria João Bebianno, Doutora Alexandra Cravo, Doutora Cinta Porte Visa, Doutora Maria Ângela Pereira Serafim
General Abstract
Aquatic environments offer and sustain important habitats for many fish species, but also attract an ever-increasing level of human activities. These environments are the ultimate sink for many of the chemical contaminants released from anthropogenic activities, which can represent a great threat to organisms living in these ecosystems, as to human health. In recent years, there has been a growing awareness of the need to detect and assess the adverse effects of contaminants in organisms exposed to different levels of pollutants. Among the available techniques, the integrated use of chemical analysis and biochemical responses to pollutants is a sound procedure for detecting impact of anthropogenic contaminants in aquatic systems. Besides wild fish consumption, the aquaculture industry is an expanding activity, due to the world population demand of fish however, the intensive production and the extensive use of chemicals in current practises, has raised concerns over the quality of cultured fish in comparison to wild fish. Although, both wild and cultured fish are important components of the Atlantic and Mediterranean diet, there is little information regarding pollutant levels in farmed fish and the risks associated to consumption. In the present thesis the impact of pollutants were investigated in both wild and cultured fish from different aquatic ecosystems, by the combined analysis of chemical residues in fish tissues together with biochemical responses. Specific biological responses (MT, phase I and II enzymes, CAT, AChE, Vtg) to a range of environmental stressors (metals, OCs, PAHs, APEs) were assessed in wild sea bass (Dicentrarchus labrax L.) from the Arade Estuary (S Portugal) and in cultured sea bass from different aquaculture facilities located in Southern Europe. Furthermore, the impact of pollution along the Northern
Iberian coast was assessed using two commercial fish species, the four-spotted-megrim (Lepidorhombus boscii) and the pouting (Trisopterus luscus) as sentinel organisms. Finally, since the interference of xenobiotics with steroid synthesis and steroid metabolism in fish may alter the bioavailable amounts of active hormones within the organism, the metabolism of 17α-hydroxyprogesterone (17P4) in male sea bass gonads
was investigated, as a potential tool for the detection of endocrine alterations in male fish, by evaluating the in vitro effect of model endocrine disrupters (NP, BaA, TBT,
p,p’-DDE, KCZ)
Keywords: aquatic ecosystems, fish, biomarkers, pollution, aquaculture, endocrine
Resumo Geral
Como consequência da actividade humana, o ambiente aquático recebe múltiplos aportes de contaminantes, que representam não só uma grande ameaça aos organismos que nele habitam mas também á saúde humana. Nos últimos anos, tem havido uma crescente consciencialização na necessidade de detectar e avaliar os efeitos adversos desses contaminantes em organismos expostos a diferentes níveis de poluentes. Entre as técnicas disponíveis, o uso integrado de análises químicas e de respostas bioquímicas a poluentes é considerado um procedimento adequado para detectar o impacto de contaminantes antropogénicos em sistemas aquáticos. Para além do consumo de peixe selvagem, a indústria da aquacultura é uma actividade em grande expansão, devido á necessidade da população mundial em pescado, contudo a produção intensiva e o uso de compostos químicos nesta actividade, tem levantado grandes preocupações quanto á qualidade dos peixes de cultivo comparativamente com os selvagens. Apesar, de tanto o peixe selvagem como o de cultivo serem componentes importantes da dieta Mediterrânea e Atlântica, existe pouca informação sobre os níveis de contaminantes em peixes de cultivo, e os riscos associados ao seu consumo. Nesta tese, o impacto de contaminantes tanto em peixes selvagens como de cultivo, provenientes de diferentes ecossistemas aquáticos foi investigado, através da análise integrada de resíduos químicos em tecidos com respostas bioquímicas. Respostas bioquímicas específicas (MT, enzimas da fase I e II, CAT, AChE, Vtg) a uma série de contaminantes ambientais (metais, OCs, PAHs, APEs) foram avaliadas em robalo (Dicentrarchus labrax) selvagem proveniente de diferentes zonas do Estuário do Arade (S Portugal) e de cultivo proveniente de diferentes aquaculturas localizadas no Sul da Europa.
Adicionalmente, foi avaliado o impacto da poluição ao longo da costa Norte da Península Ibérica utilizando duas espécies de peixe comercial, o areeiro-de-quatro-manchas (Lepidorhombus boscii) e a faneca (Trisopterus luscus), como organismos sentinela. Finalmente, devido ao facto de certos compostos xenobioticos poderem interferir na síntese e/ou o metabolismo de hormonas sexuais em peixes e alterar a quantidade biodisponível de hormonas activas no organismo, foi investigado, nas gónadas masculinas de robalo, o metabolismo de 17α-hidroxiprogesterona (17P4), como
uma potencial sonda para detectar alterações endócrinas em machos, tendo-se avaliado o efeito in vitro de compostos químicos considerados modelo de disrupção endócrina (NP, BaA, TBT, p,p’-DDE, KCZ).
Palavras-chave: ecossistemas aquáticos, peixes, biomarcadores, poluição, aquacultura,
This thesis has been accomplished in the Ecotoxicology and Environmental Chemistry group from the Faculty of Marine and Environmental Sciences (F.C.M.A.) of the Algarve University, and in the Environmental Chemistry Department from the Superior Counsel of Scientific Investigations (CSIC) of Barcelona, thanks to a PhD fellowship (SFRH/BD/6123/2001) from the Portuguese Fundação para a Ciência e Tecnologia (FCT) of the Ministry of Science and Technology of Portugal
amostragem, aprender várias técnicas laboratoriais e participar em diferentes congressos científicos, que contribuíram tanto na minha formação a nível científico como a nível pessoal. No entanto, tudo isto há sido possível devido ás pessoas que estiveram ao meu lado durante a tese e ás quais na continuação quero expressar o meu máximo agradecimento.
First off all, I would like to express my gratitude to Professor Dr. Maria João Bebianno and Dr. Cinta Porte Visa for offering me the opportunity to fulfil this thesis and for introducing me to the world of Ecotoxicology. For their trust placed in me and for all the support during this time.
Aos meus colegas de laboratório da F.C.M.A. (Rui, Helena, Cristina, Bli, Angela, Xana, Luísa) e ao Miguel Madureira, João Sendão, Dr. Jorge Palma, Dr. Filomena Rita e Dr. Alexandra Cravo. Obrigada pelo apoio, ajuda e amizade. E um especial obrigado a todos os que participaram nas amostragens, pelo esforço (matinadas e longos percursos) e camaradagem demonstrados. Foi um prazer enorme e uma alegria trabalhar com vocês.
Um especial obrigado ao Pedro Veiga, Daniel Machado, André Dias, Mestre Manuel Dias pela disponibilidade, organização e empenho na pescaria (Estuário do Arade), assim como ao Administrador Delegado David Assoreira da I.P.T.M. (licença de pesca) e aos gerentes e funcionários das aquaculturas amostradas, sem a qual não teria sido possível realizar este trabalho.
To my laboratory mates (Sabine, Gemma, Rémi, Angeliki, Rebeca, Ramón) from CSIC, and to those who past by (Serena, Oscar, David, Alicia…). Thanks for all the help, friendship and many laughs that we have shared.
Ao Dr. Paulo Pedro pelos serviços do laboratório ITUCA da Universidade do Algarve e pela assistência nas análises de metais.
A Roser, Dori, Rosa y Patrícia del CSIC por su ayuda con la espectrometría de masas y lo detector de captura de electrones, y a los demás compañeros del departamento por echarme una mano con la química.
Special thanks to Dr. Mercedes Blasquez and Dr. Ariadana Sitjà-Bobadilla for their valuable help and comments in the field of histology and parasitology.
To all my dearest friends, thank you for all your support, faith and unconditional friendship. To Butterfly, thank you so much for your patience, support and always encouraging words.
A todos os que, de alguma forma, contribuíram para a realização deste trabalho.
Finalmente, um especial obrigado a minha família pelo apoio na realização desta tese. Muito obrigado por estarem sempre ao meu lado e por darem-me confiança e força para continuar.
INDEX
General Abstract ... I Resumo Geral ...II Acronym List ...XX
Chapter 1. General Introduction
1. Contamination of the aquatic environment...2
1.1. Aquaculture industry...7
1.2. Environmental biomonitoring...10
1.3. Biomarkers ...12
1.4. Xenobiotic metabolism: Enzymes involved in biotransformation...14
1.4.1. Phase I enzymes ...16 1.4.2. Phase II enzymes...20 1.5. Antioxidant enzymes...23 1.6. Acetylcholinesterase (AChE)...25 1.7. Metallothionein (MT) ...25 1.8. Biotransformation products...27 1.9. Endocrine disruption...28 1.9.1. Vitellogenin (Vtg) ...30
1.9.2. Potential pathways of endocrine disruption ...31
1.9.3. Steroidogenic enzymes in fish ...33
1.10. Selected species...38
1.11. Objectives and structure of the thesis ...41
1.12. References...44
Chapter 2. Chemical and Biochemical Tools to Assess Pollution Exposure in Wild and Cultured Sea Bass (Dicentrarchus labrax) 2.1. Chemical residues and biochemical responses in wild and cultured European sea bass (Dicentrarchus labrax L.)...70
2.2. Chemical and biochemical tools to assess pollution exposure in cultured
fish .... ...82
Chapter 3. The Use of Wild Fish for the Assessment of Pollution along the Northern Iberian Shelf 3.1. Hepatic levels of metal and metallothionein in two commercial fish species of the Northern Iberian shelf ...94
3.2. Assessment of pollution along the Northern Iberian shelf by the combined use of chemical and biochemical markers in two representative fish species ...119
Chapter 4. Mitochondrial Metabolism of 17α-Hydroxyprogesterone in Male Fish 4. Mitochondrial metabolism of 17α-hydroxyprogesterone in male sea bass (Dicentrarchus labrax): a potential target for endocrine disruptors...150
Chapter 5. General Discussion 5.1. Assessment of pollution in cultured and wild sea bass...177
5.1.1. Metal exposure and MT ...177
5.1.2. Estrogenic compounds and Vtg ...181
5.1.3. Organochlorinated compounds (OCs) and EROD activity...182
5.1.4. Other biological responses ...184
5.2. Assessment of pollution along the Northern Iberian shelf ...185
5.2.1. Metals...185
5.2.2. Organochlorinated compounds ...189
5.2.3. Hydroxylated-PAHs and the Prestige fingerprint...190
5.2.4. Alkylphenolic compounds in bile ...192
5.2.5. Biochemical markers...192
5.3.1. In vitro effects of endocrine disruptors on steroidogenic
enzymes ...199
5.4. References...201
Chapter 6. Final Conclusions
6. Conclusions of the thesis ...213 6.1. Future perspectives ...216
FIGURE INDEX
Chapter 1. General Introduction
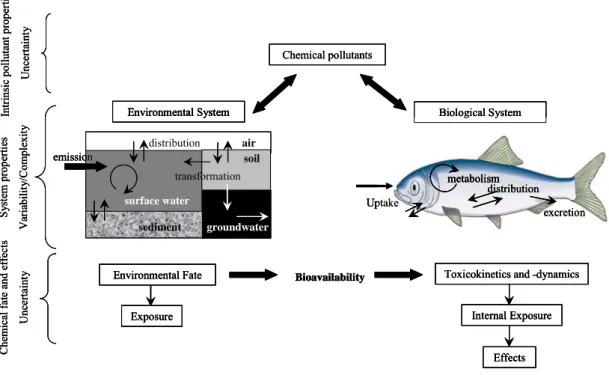
Figure 1. Pollutant input, distribution and fate in an environmental and biological
system. Illustration of the key features and commonalities between exposure and effect assessment (adapted from Schwarzenbach et al., 2006)...7
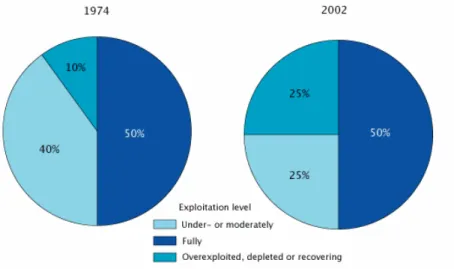
Figure 2a. State of the world marine fish stocks (FAO, 2003)...8
Figure 2b. Trends in world aquaculture production: major species groups
(FAO, 2003)...8
Figure 3. Schematic representation of the sequential order of responses to pollutants
stress within a biological system (adapted from Van der Oost et al., 2003) ...13
Figure 4. Scheme illustrating the common metabolic pathways for xenobiotic and
endogenous steroid metabolism...15
Figure 5. Schematic diagram presenting the fate of certain xenobiotic compounds in the
liver cell. Route I: detoxification or toxication pathways; Route II: Enzyme induction through binding to the AhR: aryl hydrocarbon receptor; HSP90: 90 KDa heat shock protein; ARNT: Ah receptor nuclear translocator; XREs: xenobiotic response elements; Cyt P450s: cytochrome P450 isozymes; GSTs: glutathione S-transferases; UGTs: UDP-glucuronosyltransferases (adapted from Van der Oost et al., 2003) ...18
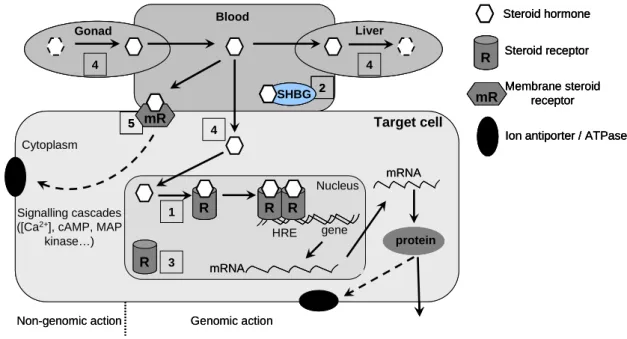
Figure 6. Schematic diagram depicting several key steps in steroid hormone action that
may be sensitive to disruption by environmental chemicals. 1) Binding to steroid receptor; 2) Binding to steroid hormone binding globulin (SHBG) or altering levels of SHBG; 3) Alteration of steroid receptor levels; 4) Alterations of biosynthesis and metabolism pathways, either in the target cell, liver or gonad; 5) Interaction with the non-genomic action of steroid hormones. Adapted from WHO (2002) and Falkenstein et al. (2000) ...32
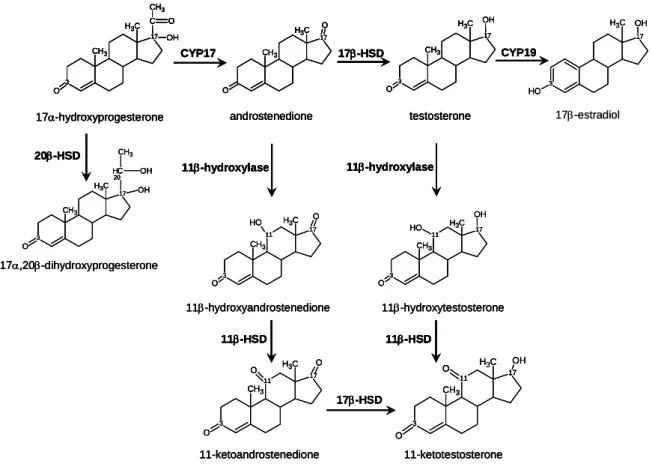
Figure 7. Sex steroid biosynthesis pathway in teleost fish. CYP17: C17,20-lyase
(cleavage P450c17); HSD: hydroxysteroid dehydrogenases; CYP19: P450 aromatase; 11β-hydroxylase (CYP11B) ...34
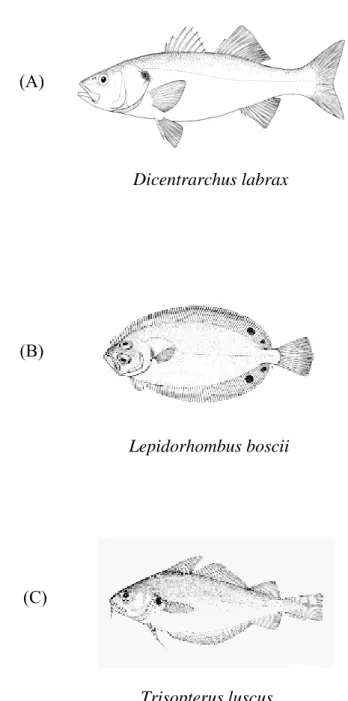
Figure 8. Selected species (pictures obtained from FishBase) ...40 Chapter 2. Chemical and Biochemical Tools to Assess Pollution Exposure in Wild and Cultured Sea Bass (Dicentrarchus labrax)
2.1.
Figure 1. Schematic diagram of the Arade estuary (S Portugal), indicating the sampling
sites where sea bass (Dicentrarchus labrax) were collected: A1: area influenced by the marina; A2: area influenced by the STP; A3: upperstream site ...73
Figure 2. Metallothionein (MT) levels in liver and kidney of sea bass (Dicentrarchus
labrax), sampled in summer and winter. Values are expressed as mean ± SEM (n = 4).
Distinct letters indicate significant differences (P < 0.05) between sites, according to Tukey’s test...76
Figure 3. 7-Ethoxyresorufin O-deethylase (EROD); catalase (CAT);
UDP-glucuronosyltransferase (UGT) and glutathione S-transferase (GST) activities in liver of sea bass (Dicentrarchus labrax), sampled in summer and winter. Values are expressed as mean ± SEM (n = 4-6). Distinct letters indicate significant differences (P < 0.05) between sites, according to Tukey’s test ...77
Figure 4. Acetylcholinesterase (AChE) activity in brain and muscle tissue of sea bass
(Dicentrarchus labrax), sampled in summer and winter. Values are expressed as mean ± SEM (n = 4-6). Distinct letters indicate significant differences (P < 0.05) between sites, according to Tukey’s test ...78
Figure 5. Testicular tissue of sea bass (Dicentrarchus labrax) infected with
Sphaerospora testicularis. Arrows indicate big necrotic granulomatous areas around
infected seminiferous tubules with intensive fibrotic reaction produced after the infection (magnification 100x) ...78
2.2.
Figure 1. Metal concentrations in the liver and muscle of male sea bass (Dicentrarchus labrax) from different aquaculture facilities: AP, SN, VM, CM (S Portugal);
RC (NE Spain). BC: laboratory kept specimens. (A) Cu; (B) Cd; and (C) Zn. Values are expressed as mean ± SEM (n = 5-6). Distinct letters indicate significant differences between sites according to Tukey’s test (P < 0.05). n.d.: below detection limit ...87
Figure 2. (A) MT concentrations; and (B) EROD activity in the liver of male sea bass
(Dicentrarchus labrax) from different aquaculture facilities: AP, SN, VM, CM (S Portugal); RC (NE Spain). BC: laboratory kept specimens. Values are expressed as mean ± SEM (n = 5-6). Distinct letters indicate significant differences between sites according to Tukey’s test (P < 0.05)...89
Figure 3. Plasma vitellogenin levels in male sea bass (Dicentrarchus labrax) from
different aquaculture facilities: AP, SN, VM, CM (S Portugal); RC (NE Spain). BC: laboratory kept specimens. Values are expressed as mean ± SEM (n = 5-6). Distinct letters indicate significant differences between sites according to Tukey’s test (P < 0.05) ...90
Figure 4. Testicular tissue of cultured sea bass (Dicentrarchus labrax) from site RC,
showing an infection of the seminiferous tubules caused by a parasitic infestation. (A) granulomata areas around the infected seminiferous tubules; and (B) aggregate of macrophages (magnification 100x) ...90
Chapter 3. The Use of Wild Fish for the Assessment of Pollution along the Northern Iberian Shelf
3.1.
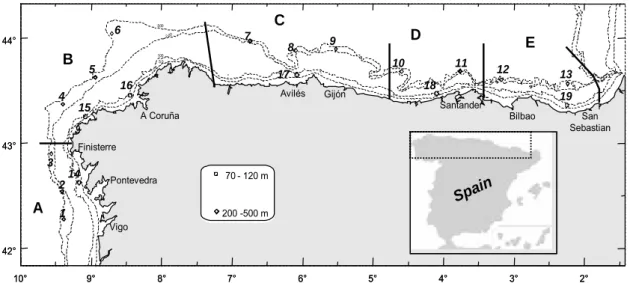
Figure 1. Map of the sampling sites. (A) S Galicia; (B) N Galicia; (C) Asturias;
(D) Cantabria; (E) Basque Country. Depth ranges of sampled fish: 70-120 m (Trisopterus luscus); 200-500 m (Lepidorhombus boscii) ...99
Figure 2. Metal concentrations (µg.g-1 d.w.) in the liver of Lepidorhombus boscii and
Trisopterus luscus collected along the Northern Iberian shelf. Values are expressed as
mean ± SEM (n=3-6). Distinct letters indicate significant differences between sites according to Tukey’s test (P < 0.05) ... 106-107
Figure 3. Hepatic MT concentrations (µg.g-1 d.w.) in Lepidorhombus boscii and
Trisopterus luscus collected along the Northern Iberian shelf. Values are expressed as
mean ± SEM (n=3-6). Distinct letters indicate significant differences between sites according to Tukey’s test (P < 0.05)...108
3.2.
Figure 1. Map of sampling sites. (A) S Galicia; (B) N Galicia; (C) Asturias;
(D) Cantabria; (E) Basque Country. Depth ranges of sampled fish: 70-120 m (Trisopterus luscus); 200-500 m (Lepidorhombus boscii) ...125
Figure 2. A) Sum of PCBs and B) sum of DDTs in the muscle tissue of Lepidorhombus boscii and Trisopterus luscus collected along the Northern Iberian coast. n.d.: below
detection limit. Data correspond to pools of 4-5 organisms ...133
Figure 3. Percentage (%) of hydroxylated-PAH metabolites detected in bile of Lepidorhombus boscii and Trisopterus luscus collected along the Northern Iberian
coast. (A) S Galicia; (B) N Galicia; (C) Asturias; (D) Cantabria; (E) Basque Country....136
Figure 4. A) 7-Ethoxyresorufin O-deethylase; B) UDP-glucuronosyltransferase and
C) catalase activities, in liver of Lepidorhombus boscii and Trisopterus luscus collected along the Northern Iberian coast. Values are expressed as mean ± SEM (n = 4-6). Distinct letters indicate significant differences (P < 0.05) between sites, according to Tukey’s test...137
Chapter 4. Mitochondrial Metabolism of 17α-Hydroxyprogesterone in Male Fish
Figure 1. Schematic representation of the synthesis of 11-oxygenated androgens
CYP17: C17,20-lyase; 11β-hydroxylase: CYP11B; HSD: hydroxysteroid dehydrogenases...154
Figure 2. HPLC radiochromatograms of 17α-hydroxyprogesterone (17P4) metabolism
by different subcellular fractions isolated from sea bass testis. A) mitochondria; B) microsomes and C) S12 fraction. AD+T: identified as AD; UNK1: identified as βAD...162
Figure 3. Representative HPLC radiochromatograms of the mitochondrial metabolism
of 17P4 in gonads of sea bass sampled at different sexual maturation stages (SMS).
A) undeveloped, SMS-0; B) early-spermatogenic, SMS-1; C) mid-spermatogenic, SMS-2; D) late-spermatogenic, SMS-3; E) post-spawning, SMS-4 (magnification 100 x). Tissue sections (6μM) were stained with hematoxylin-eosin ...164
Figure 4. Effect of KCZ, NP, BaA, TBT and p,p’-DDE (100 μM) on
the mitochondrial metabolism of 17P4 in male gonads of sea bass. Values are
mean ± SEM (n = 8). n.d.: not detected. *Significant differences relative to the control (P < 0.05) ...167
Chapter 5. General Discussion
Figure 1. Range levels of metals (Cd, Cu and Zn) and metallothionein (MT) detected in
liver of cultured and wild sea bass. Cultured sea bass were sampled from several aquacultures located in Southern Europe ad wild sea bass were collected from the Arade Estuary. (A) Copper; (B) Zinc; (C) Cadmium and (D) Metallothionein, (Chapter 2) ...179
Figure 2. Range levels of nonylphenol (NP) detected in bile of cultured and wild
sea bass. Cultured sea bass were sampled from several aquacultures located in Southern Europe and wild sea bass were collected from the Arade Estuary, (Chapter 2) ...181
Figure 3. Range levels of hepatic EROD activity detected in cultured and wild
sea bass. Cultured sea bass were sampled from several aquacultures located in Southern Europe and wild sea bass were collected from the Arade Estuary, (Chapter 2) ...184
Figure 4. Map depicting significant levels (P<0.05) of metals and MT in liver of ( ) Trisopterus luscus and ( ) Lepidorhombus boscii collected along the Northern Iberian
shelf. A – S Galicia; B – N Galicia; C – Asturias; D – Cantabria; E – Basque Country, (Chapter 3) ...186
Figure 5. Map depicting high levels of organochlorinated compounds in muscle tissue
together with significant levels of EROD activity (P<0.05) in liver of ( ) Trisopterus
luscus and ( ) Lepidorhombus boscii collected along the Northern Iberian shelf.
A – S Galicia; B – N Galicia; C – Asturias; D – Cantabria; E – Basque Country, (Chapter 3) ...190
Figure 6. Map depicting significant levels (P<0.05) of hydroxylated-PAHs and
alkylphenolic compounds in bile, together with UGT activity in liver of ( ) Trisopterus
luscus and ( ) Lepidorhombus boscii collected along the Northern Iberian shelf.
A – S Galicia; B – N Galicia; C – Asturias; D – Cantabria; E – Basque Country, (Chapter 3) ...191
Figure 7. Relationship between Zn-MT and Cd-MT in the liver of L. boscii (n = 64) and
Cr-MT in the liver of T. luscus (n = 25), collected along the Northern Iberian shelf, (Chapter 3) ...194
Figure 8. Relationship between the Sum of PCBs in muscle and mean EROD activity in
liver of (A) L. boscii (N = 14) and (B) T. luscus (N = 6), collected along the Northern Iberian shelf (Chapter 3) ...195
Figure 9. Mitochondrial metabolism of 17α-hydroxyprogesterone (17P4) in male
gonads of sea bass (Dicentrarchus labrax). CYP17: C17,20-lyase; CYP11B: 11β-hydroxylase, (Chapter 4)...197
Figure 10. Mass spectrum of mitochondrial metabolites from male gonads of sea bass,
identified as: A) 11β-hydroxy-dione (βAD); B) 4-androstene-3,17-dione (AD), (Chapter 4)...198
Figure 11. Formation rate of 11β-hydroxy-4-androstene-3,17-dione (βAD) in male
gonad of sea bass at different sexual maturation stages: undeveloped (SMS-0), early-spermatogenic (SMS-1), mid-spermatogenic (SMS-2), late-spermatogenic (SMS-3), post-spawning (SMS-4). * Significant differences between SMS (P < 0.05); (Chapter 4) ...198
Figure 12. Percentage of total mitochondrial metabolism of 17P4 in male gonad of sea
bass at different sexual maturation stages: undeveloped (SMS-0), early-spermatogenic (SMS-1), mid-spermatogenic (SMS-2), late-spermatogenic (SMS-3), post-spawning (SMS-4). (Chapter 4); (Chapter 4)...199
TABLE INDEX
Chapter 1. General Introduction
Table 1. Nomenclature of cytochrome P450 isoenzymes based on species-specificity or
function (Lewis, 2001)...17
Table 2. Function of metallothioneins (Nordberg, 1998) ...26 Table 3. Source, category (type) and examples of substances that have been reported as
potential endocrine disrupters (Labelle, 2000) ...29
Chapter 2. Chemical and Biochemical Tools to Assess Pollution Exposure in Wild and Cultured Sea Bass (Dicentrarchus labrax)
2.1.
Table 1. Analysis of the reference material cod muscle CRM (Community Bureau of
Reference). Mean values (μg/g dry weight) ± SEM ...74
Table 2. Biological data of sea bass (Dicentrarchus labrax) collected from the Arade
estuary (A1, A2, A3) and in a fish farm (FF) (S Portugal). Fish were sampled in summer and winter. HSI: hepatosomatic index, calculated as (liver weight/body weight) x 100. CF: condition factor, calculated as [body weight/(length)3] x 100. Values are mean ± SEM. Distinct letters indicate significant differences between sites, according to Tukey’s test (P < 0.05). n: number of organisms analysed ...75
Table 3. Metal concentrations (μg/g dry weight) in sea bass (Dicentrarchus labrax)
collected from the Arade estuary (A1, A2, A3) and in a fish farm (FF). Fish were sampled in summer and winter. Values are expressed as mean ± SEM (n = 4). Distinct letters indicate significant differences between sites, according to Tukey’s test (P < 0.05) ...75
Table 4. Biliary levels of hydroxylated-PAHs (μg/g of bile) in sea bass (Dicentrarchus labrax) collected from the Arade estuary (A1, A2, A3) and in a fish farm (FF). Fish
equivalents. Values are mean ± SEM (n = 4). Distinct letters indicate significant differences between sites, according to Tukey’s test (P < 0.05) ...75
2.2.
Table 1. Biological data of male sea bass (Dicentrarchus labrax) collected from
different aquaculture facilities: AP, SN, VM, CM (S Portugal); RC (NE Spain). BC: laboratory kept specimens. HSI: hepatosomatic index, calculated as (liver weight/body weight) x 100. CF: condition factor, calculated as [body weight/(length)3] x 100. Values are mean ± SEM. Distinct letters indicate significant differences between sites according to Tukey’s test (P < 0.05). n: number of organisms analysed ...86
Table 2. Organochlorine residues (ng/g dry weight) in muscle tissue of sea bass
(Dicentrarchus labrax) from different aquaculture facilities: AP, SN, VM, CM (S Portugal); RC (NE Spain). BC: laboratory kept specimens. Data correspond to pools of 5–6 organisms analyzed in duplicate. n.d.: below detection limit...87
Table 3. Organochlorine residues (ng/g dry weight) in commercial food pellets.
Bran 1, 2 (IM3, A2) and 3 provided by Southern Portugal aquacultures. Brand 2 (M3, M5, M7, O2) used to feed the laboratory kept specimens and RC (NE Spain). n.d.: below detection limit ...88
Table 4. Biliary levels of hydroxylated PAHs and alkylphenols (ng/g of bile) detected
in sea bass (Dicentrarchus labrax) from different aquaculture facilities: AP, SN, VM, CM (S Portugal); RC (NE Spain). BC: laboratory kept specimens. NP: nonylphenol; OP: octylphenol. Values are mean ± SEM (n = 5–6). Distinct letters indicate significant differences between sites according to Tukey’s test (P < 0.05) ...89
Chapter 3. The Use of Wild Fish for the Assessment of Pollution along the Northern Iberian Shelf
3.1.
Table 1. Morphometric data of Lepidorhombus boscii and Trisopterus luscus from the
collection sites. Values are mean ± SEM. HSI: hepatosomatic index, calculated as (liver weight / body weight) x 100. CF: condition factor, calculated as
[body weight / (length)3] x 100. n: number of individuals analyzed. Distinct letters indicate significant differences between sites according to Tukey’s test (p < 0.05) ...103
Table 2. Hepatic metal concentrations (µg.g-1 dry weight) in wild commercial fish
species from different coastal areas. Values are based on means or ranges of concentrations ...113
3.2.
Table 1. Morphometric data of Lepidorhombus boscii and Trisopterus luscus collected
along the Northern Iberian coast. Values are mean ± SEM. HSI: hepatosomatic index, calculated as (liver weight / body weight) x 100; CF: condition factor, calculated as [body weight / (length)3] x 100; n: number of individuals analyzed. Distinct letters indicate significant differences between sites according to Tukey’s test (P < 0.05) ...132
Table 2. Biliarly levels of hydoxylated PAHs and alkylphenols (ng/g of bile) detected
in Lepidorhombus boscii and Trisopterus luscus collected along the Northern Iberian coast. Values are expressed as mean ± SEM. NP: 4-nonylphenol; OP: 4-tert-octylphenol. Data correspond to pools of 3-4 organisms analyzed. Distinct letters indicate significant differences between sites according to Tukey’s test (P < 0.05) ...135
Chapter 4. Mitochondrial Metabolism of 17α-Hydroxyprogesterone in Male Fish
Table 1. Metabolism of 17P4 by the mitochondrial fraction isolated from sea bass testis
at different sexual maturation stages: undeveloped (SMS-0), early-spermatogenic (SMS-1), mid-spermatogenic (SMS-2), late-spermatogenic (SMS-3), post-spawning (SMS-4); formation rate of the different metabolites in pmol/h/mg protein. Values are mean ± SEM (n= 4). *Significant differences between SMS (P < 0.05) ...166
ACRONYM LIST
11-KT:11-Ketotestosterone
17P4: 17α-Hydroxyprogesterone
AChE: Acetylcholinesterase AD: Androstenedione
AhR: Arylhydrocarbon Receptor APE: Alkylphenol ethoxylate
βA: 11β-Hydroxyandrostenedione BaA: Benzo[a]anthracene BSTFA: Bis(trimethylsilyl) trifluoroacetamide CAT: Catalase Cd: Cadmium CF: Condition factor Cr: Cromium Cu: Copper
CuSO4: Copper sulphate
CYP: Cytochrome P450 CYP17: Cythochrome P450
17α-hydroxylase and C17,20-lyase
CYP19: P450 aromatase CYP11B: 11β-Hydroxylase
DDD: Dichlorodiphenyldichloroethane DDE: Dichlorodiphenyldichloroethylene DDT: Dichlorodiphenyltrichloroethane EDs: Endocrine Disruptors
EPA: Environmental Protection Agency EROD: 7-Ethoxyresorufin O-Deethylase ERs: Estrogen Receptors
FAO: Food and Agriculture Organization
(United Nations)
Fe: Iron
FF: Fixed Wavelength Fluorescence
GC-MS: Gas Chromatography-Mass
Spectrometry
GC-ECD: Gas Chromatography-Electron
Capture Detector
GST: Glutathione S-Transferase HCB: Hexaclorobenzene
γ-HCH: Hexaclorocyclohexane (lindane) Hg: Mercury
HPLC: High Performance Liquid
Chromatography
HSD: Hydroxysteroid Dehydrogenase
HSI: Hepatosomatic Index KCZ: Ketoconazole MT: Metallothionein
NADPH: β-Nicotinamide Adenine Dinucleotide
Phosphate
NP: Nonylphenol
OCs: Organochlorinated Compounds OP: Octylphenol
P450scc: Cytochrome P450 side chain cleavage PAH: Polycyclic Aromatic Hydrocarbon Pb: Lead
PCB: Polychlorinated Biphenyls POPs: Persistent Organic Pollutants SULT: Sulfotransferase
T: Testosterone TBT: Tributyltin
UGT: UDP-glucuronosyltransferase UNEP: United Nations Environmental
Programme
Vtg: Vitellogenin
WHO: World Health Organization Zn: Zinc
1. Contamination of the aquatic environment
The massive increase of human population has lead to an exponential enhancement in technological and industrial advancements all around the world. The outburst of these advancements has greatly increased the consideration and concern for the quality of the environment in the last decades, mainly due to the awareness that pollution can be found everywhere. Pollution can be defined as any human-caused change in the physical, chemical, or biological properties of the environment, be that air, water or soil (Bardach, 1997). The production and emission of pollutants is usually derived from human settlements, resource uses and interventions such as infrastructural development and construction, agricultural activities, industrial development, urbanization, tourism, etc.
Aquatic environments offer and sustain important habitats for many fish species, but also attract an ever-increasing level of human activity, of both commercial and recreational nature. These environments are the ultimate sink for many of the chemicals released from anthropogenic activities, either due to direct (e.g. municipal, industrial and domestic effluents) or diffuse discharges (e.g. agriculture and urban runoff) or to atmospheric processes (Stegeman and Hahn, 1994). Many thousands of persistent organic pollutants (POPs) have been produced and in part released into the environment. POPs are usually divided into three categories: pesticides, industrial chemicals and unintentionally produced by-products, and they persist in the environment for long periods of time, since they resist photolytic, chemical and biological degradation. Due to their low water solubility they bond strongly to particulate matter in water column, and as a result, sediments can serve as a reservoir or
“sink” (Edlund, 2001). Moreover, POPs can travel through the atmosphere and oceans, thousands of miles from their source of origin, existing evidence of these compounds in remote regions where they have never been used nor produced (Muir et al., 1988; Simonich and Hites, 1995; Vilanova et al., 2001).
In the last decades of the 20th century, mankind became aware of the potential long-term adverse effects of synthesized chemicals and by-products, and their risk for aquatic and terrestrial ecosystems, since these compounds are rapidly bioaccumulated in the tissues of resident organisms and biomagnify through the food chain. To address this global concern, the United States joined forces with 90 other countries and the European Community to sign the treaty known as the Stockholm Convention (Sweden, May 2001), where countries initiated measures to protect human health and the environment by reducing and/or eliminating emissions and discharges of an initial list of twelve key POPs. The chemical substances in this list were aldrin, chlordane, dichlorodiphenyl trichloroethane (DDT), dieldrin, endrin, heptachlor, hexachlorobenzene (HCB), mirex, toxaphene, polychlorinated biphenyls (PCBs), polychlorinated dibenzodioxins (PCDDs) and polychlorinated dibenzofurans (PCDFs). Organochlorines, such as PCBs and DDTs, are among the most widespread and persistent contaminants in coastal environments (Varanasi et al., 1992). Even though a number of POPs are no longer produced (i.e. PCBs, banned in the 70s), they have remained in the environment for many decades, due to their persistency, and may continue to be unintentionally produced during some industrial processes. Nowadays, there is a rising interest on other organic compounds such as: polycyclic aromatic hydrocarbons (PAHs), nonylphenols (NPs), octylphenols (OPs), phthalates,
pentachlorophenol, hexabromobiphenyl, organomercury, organotin and organolead compounds, among others (UNEP, 2003).
PAHs are not commonly considered as persistent pollutants because of their extensive metabolism and excretion by fish and mammals. Nonetheless, depending on the chemical structure and the level of exposure, PAHs and their metabolites have the potential to produce toxic, mutagenic and/or carcinogenic effects in fish and other vertebrates, including humans (Albers, 2003), and for this reason, the increased levels of PAH in the last decades is a cause of concern. Increasing urbanization of coastal areas leads to high concentrations of PAHs in coastal environments. Nonetheless, most of the PAHs associated with coastal sediments originate from combustion (e.g. combustion of fossil fuel), with industrial and municipal waste-water, surface water runoff from urban areas and atmospheric deposition being an important source of PAHs to coastal waters (Varanasi et al., 1992; Albers, 2003). As a consequence of their hydrophobic characteristics, PAHs tend to accumulate in sediments (Liu et al., 2000) where they can reach concentrations 3 to 4 orders of magnitude higher than in the water column (Notar et al., 2001).
Alkylphenols (APs) are mainly used in the synthesis of alkylphenol polyethoxylates (APEs) surfactants (detergents) which are used in a variety of industrial activities, though alkylphenols themselves can be used as plasticizers, and its derivates (alkylphenol phosphates) can be used as UV stabilizers in plastics. It is estimated that 60% of the APEs find their way into the aquatic environment as nonylphenol (NP) and octylphenol (OP), the major degradation products (Groshart et al., 2001). The major routes of entrance are through waste water discharges into rivers and the sea and from sewage sludge. Several studies have identified NP as the most critical metabolite of
APEs because of its enhanced resistance towards biodegradation, toxicity, and ability to bioaccumulate in aquatic organisms (Ahel et al., 1994; White et al., 1994; Tyler et al., 1998). Moreover, the estrogenic properties of NP have been documented in a number of
in vivo and in vitro studies (Jobling and Sumpter 1993; Arukwe et al., 1998; Celius and
Walther, 1998). Additionally, the potential for human exposure to alkylphenols is quite high since these compounds have wide environmental distribution as a result of their manufacture, use and disposal. Hence, APE degradation products have been detected in drinking water (Clark et al., 1992); NP leaches from PVC tubing during milk processing (Junk et al., 1974) and from plastics used in food packaging (Gilbert et al., 1982).
Another important source of aquatic pollution are agricultural activities which are reported to contribute about 50% of the total pollution of surface water, by means of the higher nutrient enrichment (Islam and Tanaka, 2004). Moreover, pesticides from agricultural and forest sprays have been highlighted as potential estuarine contaminants (Thomas et al., 1999; Solé et al., 2000), since they enter the system through water runoff. In most European countries, the restriction on the use of organochlorine pesticides has led to a great increase in the use of organophosphate (OP) and carbamate (C) compounds. Although less persistent than organochlorine compounds, OP and C are generally more toxic and have been responsible for major ecological accidents and various fish killings (Capel et al., 1988; Horsberg et al., 1989).
Metals, on the other hand, differ from organic pollutants in that they are neither synthesized nor destroyed by humans, therefore they cannot be banned in the same way as synthetic organic chemicals (Hill, 2004). Metals occur naturally in marine environments and are classified as pollutants only when added by human activities in sufficient amounts to produce deleterious effects on the ecological system. They are
among the major contaminants reaching aquatic environments, and their levels have been increasing over the last decades as a result of technological development (Cajaraville et al., 2000). Their utilization by humans influences the environmental transport, by anthropogenic contributions into air, water, soil and food, and alters the speciation or biochemical form of the element, which might lead to potential health threats (Goyer and Clarkson, 2001). Metals (e.g. methylmercury) have been shown to bioaccumulate – viz. accumulation of a chemical from the surrounding medium into an organism by virtue of its lipophilicity – and biomagnify through the food chain – viz. increasing concentration of a chemical as food energy is transformed within the food chain – (Neff, 2002).
The need for effective antifoulants, which prevent the settlement and growth of marine organisms on submerged structures, such as ship’s hulls and fish cages, among others, is recognised universally. For many years, tributyltin (TBT) was the most widely used active ingredient in paint formulations. However, since 1990, the use of TBT in some antifouling paints has been banned internationally due to its severe impact on the aquatic ecosystem (Fent, 1996). This ban has lead to an increase in copper-based antifouling paints (Katranitsas et al., 2003; Konstantinou and Albanis, 2004). As a result, important coastal concentrations of copper have been found in water and sediments in areas of high traffic activities, particularly in harbors and marinas (Schiff
et al., 2004; Warnken et al., 2004).
Persistent hydrophobic chemicals may accumulate in aquatic organisms through different mechanisms: (a) direct uptake from water by gills or skin (bioconcentration), (b) ingestion of suspended particles, and (c) consumption of contaminated food (biomagnification) (Van der Oost et al., 2003). Pollutants interact with environmental
and biological systems according to their intrinsic physicochemical properties and reactivity, yielding a characteristic pattern of environmental and internal exposure concentrations for each pollutant. Final exposure and effect assessment according to this concept will always be subject to uncertainty due to inherent variability and complexity of both environmental and biological systems (Fig. 1).
ti es ti es ti es
Figure 1. Pollutant input, distribution and fate in an environmental and biological system.
Illustration of the key features and commonalities between exposure and effect assessment (adapted from Schwarzenbach et al., 2006).
1.1. Aquaculture industry
Aquaculture has been developed in the past decades as a consequence of the increase of fish consumption by the world population, since fisheries have possibly reached their maximum yield due to overexploitation (FAO, 2003) (Fig. 2a). Half of all monitored stocks are now fully exploited; another quarter are overexploited, depleted, or slowly recovering; the remaining quarter are under- or moderately exploited.
Uptake metabolism distribution excretion Biological System Chemical pollutants Environmental Fate Exposure
Bioavailability Toxicokinetics and -dynamics
Internal Exposure Effects Environmental System distribution air surface water groundwater soil sediment transformation emission S yst em prop es V ar ia bi li ty /Co m ple xi ty er ti Int ri ns lut a op er Un ce rt ai nt y Ch f ate d ef fe Un ce rt ai nt y ic pol nt p r emic al an ct s Uptake metabolism distribution excretion Biological System Chemical pollutants Environmental Fate Exposure
Bioavailability Toxicokinetics and -dynamics
Internal Exposure Effects Environmental System distribution air surface water groundwater soil sediment transformation emission Uptake metabolism distribution excretion Biological System Uptake metabolism distribution excretion Uptake metabolism distribution excretion Uptake metabolism distribution excretion metabolism metabolism distribution excretion Biological System Chemical pollutants Environmental Fate Exposure
Bioavailability Toxicokinetics and -dynamics
Internal Exposure
Effects Environmental Fate
Exposure
Bioavailability Toxicokinetics and -dynamics
Internal Exposure Effects Environmental System distribution air surface water groundwater soil sediment transformation emission Environmental System distribution air surface water groundwater soil sediment transformation Environmental System distribution air surface water groundwater soil sediment transformation emission S prop es V ar ia bi li ty /Co m ple xi ty yst em er ti Int ri ns lut a op er Un ce rt ai nt y Ch f ate d ef fe Un ce rt ai nt y S prop es V ar ia bi li ty /Co m ple xi ty ic pol nt p r emic al an ct s yst em er ti Int ri ns lut a op er Un ce rt ai nt y Ch f ate d ef fe Un ce rt ai nt y nt p r ic pol ct s an emic al
Figure 2a. State of the world marine fish stocks (FAO, 2003).
This industry is growing more than 10% per year (FAO 2003, Fig. 2b), and a production of 47 million tons of aquaculture products, mainly fish, is estimated for the year 2010 (Dar, 1999). Fish may be cultured in raceways, ponds or net cages in open and coastal waters. However, current aquaculture practises raise environmental concerns, such as (a) organic enrichment of surrounding waters by nutrients and solid wastes, (b) extensive use of chemicals (e.g. therapeutants, antibiotics, antifoulings) with their subsequent release into the aquatic environment, (c) introduction of pathogens, and
(d) introduction of new genetic strains of cultured fish (Seymour and Bergheim, 1991; Wu, 1995; Katranitsas et al., 2003; Matos et al., 2006). Furthermore, the intensive production has raised concerns over the quality of cultured fish in comparison to wild fish (Alasalvar et al., 2002). But, although, aquaculture practises have been criticized for their ecological effects, the potential human health risks of cultured fish consumption have not been rigorously examined. The use of therapeutants as well as the contaminants present in the surrounding waters, can to some extent affect the well being and quality of cultured fish as well as those of non-target organisms. Moreover, as the aquaculture industry develops further, greater effects both on the environment and even in its own operations, may occur. Even though, clean water is one of the prerequisites of aquaculture, polluted conditions often arise gradually; e.g. when new industries are established in the coastal zone. Thus, evaluating pollutant loads and biological responses in cultured fish is an urgent need from the environmental, nutritional and toxicological point of view.
Marine fish culture is an increasing activity in the Atlantic and Mediterranean regions. It is mainly focused on two species: the sea bass (Dicentrarchus labrax) and the gilthead sea bream (Sparus aurata), working in parallel with traditional fisheries. Both cultured and wild fish are important components of the Atlantic and Mediterranean diet.
Eating fish provides nutritional benefits to humans; apart from being a good source of protein, fish is known to contain long chain n-3 polyunsaturated fatty acids (LC n-3 PUFA), also known as omega-3 fatty acids, that help to reduce the risk of cardiovascular disease (Ulbricht and Southgate, 1991; La Vecchia et al., 2001) and of certain types of cancer (Terrry et al., 2001, 2002). Moreover, omega-3 fatty acids
cannot be synthesized by humans and therefore must be obtained from the diet (Alasalvar et al., 2002). However, fish consumption is considered a major route of chemical exposure for humans (Dougherty, 2000) and most importantly, children are more at risk because of their great intestinal absorption (Chance and Harmsen, 1998). Several pollutants are often detected in fish and seafood; e.g. metals such as mercury, cadmium, arsenic and lead, persistent organic compounds such as dioxins and PCBs, or residues of antibiotics and hormones used in aquaculture.
Organochlorine compounds (OCs) have been detected in tissues of wild fish (Lewis et al., 2002; Porte et al., 2002), smoked fish (Zabik et al., 1996), fish oils (Jacobs et al., 2002), fish feed and cultured fish (Easton et al., 2002; Antunes and Gil, 2004; Hites et al., 2004; Carlson and Hites, 2005). Elevated levels of PCBs in humans via fish consumption, as well as development deficits, neurodevelopmental problems, increased cancer risks and endocrine-disrupting effects have also been identified (Johnson et al., 1999; Carpenter et al., 2002; Borja et al., 2005). Furthermore, fish often contain significant amounts of methylmercury and lead, which have significant neurobehavioral effects and lead to development deficits in humans at high levels of exposure (Johnson et al., 1999; Carpenter et al., 2002). These findings suggest that the benefits of eating fish, primarily the possible prevention of sudden cardiac diseases, may be outweighed by the risks of consuming contaminated fish.
1.2. Environmental biomonitoring
As recognised in the last decades by international organisations and environmental agencies, risk assessment cannot be solely based on chemical analysis of
environmental samples (e.g. water and sediments), as no indication of the deleterious effects of contaminants on the biota is provided. In recent years, there has been a growing awareness of the need to detect and assess the adverse effects of contaminants in organisms exposed to different levels of pollutants. Among the available techniques, the integrated use of chemical analyses and biochemical and cellular responses to pollutants is a sound procedure for detecting impact of anthropogenic contaminants in aquatic systems.
The systematic use of living organisms to evaluate changes in water quality is defined as biomonitoring. Fish are often used to monitor urban and industrial effluents and to assess contaminant levels of coastal, brackish and freshwater environments. Fish species play an increasingly important role in the worldwide assessment of the quality of the aquatic ecosystems because they respond with great sensitivity to changes in the aquatic environment (Pastor et al., 1996). They can be found virtually everywhere in the aquatic environment and they play a major ecological role in the aquatic food webs because of their function as a carrier of energy from lower to higher trophic levels (Beyer, 1996). Their diversity of habitats makes them also useful for ecotoxicology studies, since it allows the examination of a wide range of chemical compounds and its potential effects. Despite their limitations, such as relatively high mobility, fish are generally considered one of the most feasible organisms for pollution monitoring in the aquatic systems.
1.3. Biomarkers
The need for early detection and assessment of the impacts of contamination in the aquatic environment has led to the development of biomarkers (biological indicators) (Peakall, 1994). A biomarker is generally used in a broad sense to include almost any measurement reflecting an interaction between a biological system and a potential hazard, which may be chemical, physical or biological (WHO, 1993). A biomarker is defined as a “change in a biological response, ranging from molecular through cellular and physiological responses to behavioural changes, which can be related to exposure to or toxic effects of environmental chemicals (Peakall, 1994). Generally, when deleterious effects on populations or ecosystems became clear, there is already considerable environmental degradation (Hylland, 2006). Therefore, the sequential order of responses to pollutants stress within a biological system, from the molecular to the ecosystem level, have triggered the research to establish “early-warning signals” or biomarkers reflecting adverse biological responses towards anthropogenic environmental pollutants (Bucheli and Fent, 1995) (Fig. 3). Thus, these “early biomarker signals” can be used in a predictive way, allowing the initiation of bioremediation strategies before irreversible environmental damage occurs.
In order to assess the bioavailability and toxicity of pollutants in fish, biomarkers on all levels of biological organization have become valuable ecotoxicological tools. The great advantage of a biomarker is providing evidence of the state of pollution in a comprehensive way based on the synergistic and antagonistic effects of all contaminants involved (Collier et al., 1995). Nonetheless, the physiological value of many parameters
may vary greatly in relation to the fish species age, sex, reproductive stage, as well as seasonality (Hylland, 2006). “early biomarker signals” “later effects” Pollutant exposure Molecular Subcellular (organelle) Cellular Tissue Systemic (organ) Organism Population Community Ecosystem “early biomarker signals” “later effects” Pollutant exposure Pollutant exposure Molecular Subcellular (organelle) Cellular Tissue Systemic (organ) Organism Population Community Ecosystem
Figure 3. Schematic representation of the sequential order of responses to pollutants stress
within a biological system (adapted from Van der Oost et al., 2003).
The biomarker approach has been incorporated into several pollution monitoring programmes in Europe and the USA (e.g. the North Sea Task Force Monitoring Master Plan and the NOAA’s National Status and Trends Program). Likewise, different methods for biological effect measurement have been evaluated in a series of practical workshops organised by the International Council for the Exploration of the Sea (ICES) and the Intergovernmental Oceanographic Commission (IOC). The United Nations Environment Programme has funded a biomonitoring programme in the Mediterranean Sea including a variety of biomarkers (UNEP, 1997). Recently, biomarkers have also been included in the Joint Monitoring Programme of the OSPAR convention where Portugal and Spain are members (Cajaraville et al., 2000).
Nonetheless, the use of biomarkers in marine biomonitoring programmes is still a developing research field. In general, it would appear that no individual biomarker can
provide a complete diagnosis of pollution effects in coastal environments. Rather, a set of biomarkers should be used, in conjunction with other chemical and biological measurements. Selected biomarkers should indicate that the organism has been exposed to pollutants (exposure biomakers) and/or the magnitude of the organism’s response to the pollutant (effect biomakers or biomarkers of stress) (Cajaraville et al., 2000). Furthermore, the criteria for candidate biomarkers are that they should be sensitive, reliable and easy to measure and that they should be related with the “health” and “fitness” of the organisms (Stegeman et al., 1992).
1.4. Xenobiotic metabolism: Enzymes involved in biotransformation
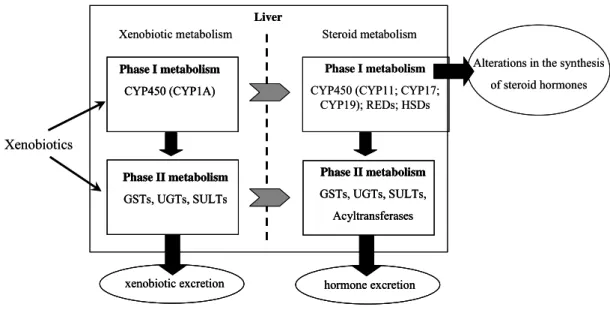
Most toxicants that are absorbed and penetrate into the body are lipophilic substances. This characteristic enables them to cross cellular membranes more easily and to be distributed throughout the body. Biotransformation of lipophilic compounds into more hidro-soluble metabolites is generally required before excretion from living organisms. Some exogenous chemicals may be excreted largely unchanged (original form), but most persistent environmental contaminants are highly lipophilic and require metabolic conversion before elimination from the organism (Ahokas et al., 1994). Without biotransformation, lipophilic xenobiotics would be excreted from the body so slowly that they would eventually overwhelm and kill the organism (Parkinson, 2001). Nonetheless, this change in chemical properties may also result in changes in their biological activity; in some cases, biotransformation not only leads to inactivation of toxic compounds, but also can result in more toxic carcinogenic products (Stegeman and Lech, 1991). Moreover, since some xenobiotics share common metabolic pathways
with endogenous substrates such as hormones (Fig. 4), it is likely that they may potentially interfere with normal endogenous metabolism and trigger endocrine alterations (Waxman, 1988).
Alterations in the synthesis of steroid hormones
Xenobiotics
Xenobiotic metabolism Steroid metabolism
Phase I metabolism
CYP450 (CYP1A)
Phase I metabolism
CYP450 (CYP11; CYP17; CYP19); REDs; HSDs Liver Phase II metabolism GSTs, UGTs, SULTs Phase II metabolism GSTs, UGTs, SULTs, Acyltransferases
xenobiotic excretion hormone excretion
Alterations in the synthesis of steroid hormones
Xenobiotics
Xenobiotic metabolism Steroid metabolism
Phase I metabolism
CYP450 (CYP1A)
Phase I metabolism
CYP450 (CYP1A)
Phase I metabolism
CYP450 (CYP11; CYP17; CYP19); REDs; HSDs Liver Phase II metabolism GSTs, UGTs, SULTs Phase II metabolism GSTs, UGTs, SULTs Phase II metabolism GSTs, UGTs, SULTs, Acyltransferases Phase II metabolism GSTs, UGTs, SULTs, Acyltransferases xenobiotic excretion
xenobiotic excretion hormone excretionhormone excretion
Figure 4. Scheme illustrating the common metabolic pathways for xenobiotic and endogenous
steroid metabolism.
Biotransformation usually involves two types of enzymatic reactions: phase I and phase II reactions. Phase I is a non-synthetic alteration of the original foreign molecule (oxidation, reduction or hydrolysis), which can then be conjugated in phase II. The majority of the phase II type enzymes (e.g. GSTs, UGTs) catalyze synthetic conjugation reactions, which facilitate the excretion of the phase I reaction products by the addition of an endogenous polar group to the molecule (Commandeur et al., 1995).
1.4.1. Phase I enzymes
The first step in the metabolism of most lipophilic chemicals is oxidation by the cytochrome P450-dependent monooxygenase system localized in the endoplasmatic reticulum of the liver and other tissues. Its terminal component, cytochrome P450 (CYP) exists as a superfamily of heme-thiolate isoenzymes, all of which possess an iron protoporphyrin IX (Fe3+) as the prosthetic group (Stegeman and Hahn, 1994). The
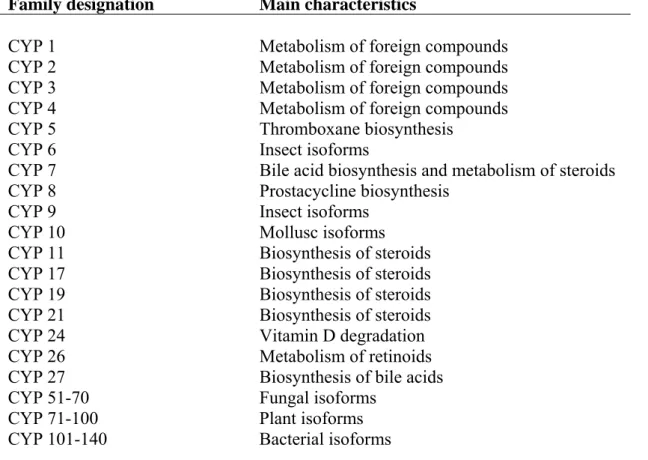
monomer of the enzyme has a molecular weight of 45-55 KDa. It is present in a wide variety of species, from bacterial to mammals (Lewis et al., 2006). Another component of the monooxygenase system is the flavoprotein NADPH cytochrome P450 reductase that transfers electrons to the P450 cytochrome (CYP) (Stegeman and Hahn, 1994). Fish, along with many other vertebrates, have a well-developed xenobiotic metabolizing system (Ahokas and Pelkonen, 1984). In general, cytochromes are present at high levels in the liver, accounting for 1 to 2% mass of hepatocytes (Lester et al., 1993). However, they are also expressed in extrahepatic tissues, including intestine, kidney, lungs, brain, skin, etc (Husøy et al., 1994; Stegeman and Hahn, 1994; Ortiz-Delgado et al., 2002). Cytochrome P450 present a great functional versatility which is reflected both in the variety of processes which they catalyse and in the increased number of substrates that they can metabolize (Table 1). CYP1, CYP2 and CYP3 families are primarily associated with the metabolism of xenobiotics, but are also involved in endogenous metabolic processes. CYP11, CYP17, CYP19 and CYP21 families are mainly responsible for the biosynthesis of steroid hormones (Lewis et al., 2006).
Table 1. Nomenclature of cytochrome P450 isoenzymes based on species-specificity or
function (Lewis, 2001)
Family designation Main characteristics
CYP 1 Metabolism of foreign compounds
CYP 2 Metabolism of foreign compounds
CYP 3 Metabolism of foreign compounds
CYP 4 Metabolism of foreign compounds
CYP 5 Thromboxane biosynthesis
CYP 6 Insect isoforms
CYP 7 Bile acid biosynthesis and metabolism of steroids
CYP 8 Prostacycline biosynthesis
CYP 9 Insect isoforms
CYP 10 Mollusc isoforms
CYP 11 Biosynthesis of steroids
CYP 17 Biosynthesis of steroids
CYP 19 Biosynthesis of steroids
CYP 21 Biosynthesis of steroids
CYP 24 Vitamin D degradation
CYP 26 Metabolism of retinoids
CYP 27 Biosynthesis of bile acids
CYP 51-70 Fungal isoforms
CYP 71-100 Plant isoforms
CYP 101-140 Bacterial isoforms
Cytochrome P4501A (CYP1A). Among the different forms of cyt P450s, the
CYP1A family has gained particular attention because of its role in biotransformation of many xenobiotic compounds including PAHs, PCBs, dioxins, furans, pesticides, petroleum products and an array of drugs (Stegeman and Lech, 1991; Van der Oost
et al., 2003). Induction of CYP1A is mediated through the binding of xenobiotics to a
cytosolic aryl hydrocarbon receptor protein (AhR) (Fig. 5, Route II). The xenobiotic binds as ligand to the AhR, releasing the heat shock protein (HSP90). The Ah receptor complex then binds to the Ah receptor nuclear translocator protein (ARNT) and migrates to the cell nucleus, where it interacts with the DNA with specific xenobiotic response elements (XREs) near the promoter region of the CYP1A gene transcription,
followed by increased levels of CYP1A messenger RNA, new synthesis of CYP1A protein and, finally enhanced CYP1A catalytic activity (Sarasquete and Segner, 2000). Thus, pollutants with a high binding affinity to AhR also have a high capacity to induce CYP1A (Billiard et al., 2002). The prototype ligand for the Ah receptor is 2,3,7,8-tetra-chloro-dibenzo-p-dioxin (TCDD) which is one of the most potent CYP1A inducers. All steps of the CYP1A induction cascade i.e. mRNA, protein and catalytic activity can be used to measure CYP1A in fish (Goksøyr and Husøy, 1992; Stegeman and Hahn, 1994; Bucheli and Fent, 1995).
Complex Protein mRNA LIVER CELL II I Phase II AhR HSP90 AhR HSP90 + Xenobiotic compound UPTAKE BLOOD AhR ARNT DNA AhR ARNT XREs NUCLEUS RNA enhanced transcription Phase I Cyt P450s GSTs, UGTs EXCRETION metabolite conjugate Complex Protein mRNA Protein mRNA mRNA LIVER CELL II I II I Phase II AhR HSP90 AhR HSP90 + AhR HSP90 AhR HSP90 AhR AhR HSP90 AhR HSP90 + AhR AhR HSP90 + Xenobiotic compound UPTAKE BLOOD Xenobiotic compound UPTAKE BLOOD AhR ARNT AhR ARNT AhR AhR ARNT DNA DNA AhR ARNT AhR AhR ARNT XREs NUCLEUS RNA RNA enhanced transcription
Phase I Cyt P450sCyt P450s
GSTs, UGTs
EXCRETION
metabolite conjugate
Figure 5. Schematic diagram presenting the fate of certain xenobiotic compounds in the liver
cell. Route I: detoxification or toxication pathways; Route II: Enzyme induction through binding to the AhR: aryl hydrocarbon receptor; HSP90: 90 KDa heat shock protein; ARNT: Ah receptor nuclear translocator; XREs: xenobiotic response elements; Cyt P450s: cytochrome P450 isozymes; GSTs: glutathione S-transferases; UGTs: UDP-glucuronosyltransferases (adapted from Van der Oost et al., 2003).
7-Ethoxyresorufin O-deethylase (EROD) activity appears to be the most sensitive catalytic probe for determining the inductive response of the CYP1A in fish
by following the increase in fluorescence of the reaction product 7-hydroxyresorufin (Burke and Mayer, 1974). CYP1A induction in fish is considered as a sensitive “early warning” signal of pollution exposure, and EROD activity has been widely used as a biomarker of contamination in the aquatic environment (Van der Oost et al., 1996; Fernandes et al., 2002). Increased EROD activity has been related to, or positively correlated with, exposure to organic pollutants such as PAHs, PCBs and petroleum hydrocarbons in numerous field studies (Bucheli and Fent, 1995; Goksøyr, 1995; Kirby
et al., 1999; Whyte et al., 2000; Porte et al., 2002). However, a direct straightforward
relation between the concentration of an inducing chemical and CYP1A response is not always to be expected in the natural environment. Thus, certain types of chemicals or complex mixtures of xenobiotics normally present in the environment can repress EROD induction or inhibit the catalytic activity in fish, these include organotin (e.g. TBT) and metallic compounds (e.g. Cd , Hg and Cu), among others (Viarengo
et al., 1997; Fent et al., 1998; Rice and Roszell, 1998; Bozcaarmutlu and Arinc, 2004).
Likewise, EROD activity can additionally be influenced by abiotic and biotic factors such as water temperature, seasonality, nutrition, age, sex and reproductive status (Andersson and Förlin, 1992; Lemaire et al., 1992; Arukwe and Goksøyr, 1997). Nevertheless, EROD activity in fish liver can be considered as a sensitive biomarker of great value in assessing exposure of potentially harmful effects of many organic trace pollutants. Research on mechanisms of CYP1A-induced toxicity suggests that EROD activity may not only indicate chemical exposure, but may also precede effects at various levels of biological organization (Whyte et al., 2000). The confounding variables, which may affect the enzyme activity, however, have to be considered when interpreting the responses of this parameter.
1.4.2. Phase II enzymes
Phase II type enzymes catalyze conjugation reactions, facilitating the excretion of chemicals by the covalent addition of more polar groups (e.g. glutathione (GSH) and glucuronic acid (GA)) to the molecule (Commandeur et al., 1995; Van der Oost
et al., 2003), thereby transforming a xenobiotic or endogenous compound into a more
hydro-soluble product which can be excreted from the organism through bile, urine or through the gills (Clarke et al., 1991; Goksøyr and Förlin, 1992) (Fig. 5, Route I). Phase II enzymes play an important role in homeostasis as well as in the detoxification and clearance of xenobiotics and products of oxidative stress (Hayes and Pulford, 1995). The major pathway for electrophilic compounds and metabolites is conjugation with GSH, while for nucleophilic compounds conjugation with GA is the major route. Other pathways, i.e. conjugation with sulphate, play a minor role in fish and are the preferred route for only a few compounds (George, 1994). While some xenobiotics posses functional groups (e.g. –COOH, -OH or –NH2) for direct metabolism by
conjugative phase II enzyme systems, others have to be metabolized by phase I enzymes (George, 1994). In addition to CYP1A genes, the Ah gene battery also comprises phase II genes like NADPH menadione oxidoreductase, aldehyde dehydrogenase, UGTs and GSTs (Nebert et al., 1990; Celander, 1993). The mechanism of induction for most forms of phase II enzymes is, therefore, probably regulated via the Ah-receptor as well (Sutter and Greenlee, 1992).
UDP-glucuronosyltransferase (UGTs). The transfer of glucuronic acid (GA) in
an activated form as uridine diphosphate glucuronic acid (UDPGA) to a wide variety of endogenous (e.g. bilirubin, steroid hormones and bile acids) and exogenous aglycone
compounds (e.g. phenolic xenobiotics) is performed by UDP-glucuronosyltransferases and constitutes a major pathway for their metabolic inactivation and subsequent excretion (George, 1994). UGTs are a family of enzymes present in the endoplasmatic reticulum differing from other phase II enzymes which are located in the cytosol. Mutiple UGT isoforms with differing substrate specificities are present in fish, and are generally named after their acceptor substrates, e.g. phenol, steroid, bilirubin (Van der Oost et al., 2003). In addition to its capacity to metabolize contaminants, UGTs also play an important role in the balance of endogenous compounds. Glucuronidation of endogenous compounds is important in fish species for biliary elimination of bilirubin (Clarke et al., 1992), cessation of hormone action via excretion (Förlin and Haux, 1985), and chemical signalling i.e. dihydroprogesterone glucuronides are the sex pheromones (Van der Kraak et al., 1989). The liver is quantitatively the most important site for glucuronidation of xenobiotics in fish, nevertheless significant activities have also been detected in extrahepatic tissues, including kidney, gills and intestine (George, 1994).
In fish, the UGT isoform, which preferentially conjugates planar phenols, is induced by PAHs, inferring the involvement of the Ah receptor (Nebert et al., 1990; George, 1994). Several studies have reported increases in hepatic UGT activities in both marine and freshwater fish from polluted sites (Van der Oost et al., 1996; Vigano et al., 1998; Porte et al., 2002; Gaworecki et al., 2004). Although not as sensitive as phase I enzymes, UGT appears to be the phase II parameter which is most responsive to pollutant exposure (Van der Oost et al., 2003), and has been used as a valid biomarker.
Glutathione S-transferases (GSTs). Glutathione is one of the most important