Department of Management
Customer Satisfaction and Repurchase Intention: an application to the
telecommunications industry
A Dissertation presented in partial fulfillment of the Requirements for the Degree of Master in International Management
By
Cândida Carraça Cigarra
Supervisor:
PhD Paulo Rita, ISCTE Business School, Department of Marketing
- Spine -
C
u
st
o
m
er
S
at
is
fa
ct
io
n
a
n
d
R
ep
u
rc
h
as
e
In
te
n
ti
o
n
:
an
a
p
p
li
ca
ti
o
n
t
o
t
h
e
te
le
co
m
m
u
n
ic
at
io
n
s
in
d
u
st
ry
C
ân
d
id
a
C
ar
ra
ça
C
ig
ar
ra
i
Abstract
In an ever changing world, enterprises need to focus in their customers in order to guarantee their future survival and success. However, what constructs are truly important in determining Customer Repurchase Intention? For a long time, Overall Customer Satisfaction was considered to be the fundamental construct when determining Repurchase Intention. In this study, it is proofed that although Overall Customer Satisfactions is important, it is not the fundamental construct determining Repurchase Intention. Constructs like Quality Perception or Trust play a fundamental role in maintaining a customer, in the complex world of International Telecommunication in a Business to Business perspective.
Abstract
Num mundo em constante mudança, as empresas devem apostar nos seus clientes para garantir a sua sobrevivência e futuro sucesso. No entanto, quais são as variáveis que realmente infuenciam a intenção de manter e desenvolver um relacionamento comercial? Durante vários anos, a Satisfação de Cliente foi considerada a variável que mais infuenciava a Intenção de Recompra e, consequentemente, a manutenção um relacionamento comercial. Neste estudo é provado que a Satisfação de Cliente, apesar de importante no contexto comercial, não é de todo a variável mais importante quando se fala de Intenção de Recompra. Variáveis como a Confiança ou a Percepção de Qualidade também desempenham um papel fundamental no complexo mundo das Telecomunicações Internacionais numa perspectiva
Business-to-Business.
Keywords: Customer Satisfaction, Quality, Trust, Repurchase Intention and Telecommunications
ii
Acknowledgment
First of all, I would like to thank Professor Paulo Rita for his support and encouragement during the making of this thesis.
Secondly, I can not forget my MIM colleagues that made this Master degree such a wonderful experience that will stay forever in my heart.
Finally, I dedicated this research to my family that, one way or another, made this thesis possible.
iii
Tables of Contents
1 INTRODUCTION ...1 1.2 Problem Statement...2 1.3 Research Objectives...3 1.4 Thesis division...3 2 LITERATURE REVIEW...42.1 Global Telecommunications Industry...4
2.2 Customer Retention & Repurchase Intention...8
2.2.1 Definition ... 8
2.2.2 Repurchase Intention as a complex concept ...10
2.3 Customer Satisfaction ...11
2.3.1 Definition ...11
2.3.2 Customer Satisfaction in Business-to-Business relationships ...12
2.5.2 Trust in a Business-to-Business Context...17
2.6 Literature and Research Questions ...20
2.7 Frame of Reference...21
3 RESEARCH METHODOLOGY ...23
3.1 Research Purpose...23
3.2 Research approach ...24
iv
3.4 Population and Sample Selection ...25
3.5 Data Collection ...26
3.5.1 Survey ...26
3.6 Data Analysis Procedure ...27
3.7 Validity and Reliability ...28
4 RESULTS...31
4.1 Descriptive Statistics...31
4.2 Normality tests...32
4.3 Correlation...32
4.4 Linear Regression Analysis...37
4.4.1 Overall Customer Satisfaction ...37
4.5 Testing Research hypothesis ...48
5 CONCLUSIONS AND RECOMMENDATIONS ...50
5.1 Major Conclusions...50
5.2 Research Contribution...50
5.3 Managerial Implications...51
5.4 Limitations...51
5.5 Future research suggestions...52
REFERENCES ...53
v ANNEX 2 - NORMALITY TESTS...62
vi
List of Tables
Table 1-1 - Financial data of main International Telecommunications Groups
(http://finance.yahoo.com) ...2
Table 2-1 Relationship between research questions, research hypothesis and constructs ...22
Table 3-1 - Relevant situations for different research strategies (Cosmos Corporation) ...25
Table 3-2 - List of question versus variables names used in the research...27
Table 3-3 - Different types of the statistics used in the study...28
Table 3-4 - Cronbach's Alpha tests results ...30
Table 4-1 - Main Descriptive Statistics details ...32
Table 4-2 - Anova test results ...32
Table 4-3 - Overall Customer Satisfaction constructs correlation with other variables ...33
Table 4-4 - Quality Perception constructs correlation with other variables ...34
Table 4-5 - Recommend the Company constructs correlation with other variables ...35
Table 4-6 - Trust constructs correlation with other variables ...36
Table 4-7 - Repurchase Intention constructs correlation with other variables ...37
Table 4-8 - Statistical data of Overall Customer Satisfaction model ...38
Table 4-9 - Linear Regression with co-linearity tests of Overall Customer Satisfaction model ...39
Table 4-10 - Cronbach reliability test for Overall Customer Satisfaction model ...39
vii
Table 4-12 - Linear Regression with co-linearity tests of Quality Perception model...41
Table 4-13 – Cronbach reliability test of Quality Perception model ...41
Table 4-14 - Statistical data of Recommend the Company model...42
Table 4-15 - Linear Regression with co-linearity tests of Recommend the Company model..43
Table 4-16 - Cronbach reliability test of Recommend the Company model...43
Table 4-17 - Statistical data of Trust in the Company model ...44
Table 4-18 - Linear Regression with co-linearity tests of Trust in the Company model ...45
Table 4-19 - Cronbach reliability test of Trust in the Company model ...45
Table 4-20 - Statistical data of Repurchase Intention model...46
Table 4-21 - Linear Regression with co-linearity tests of Repurchase Intention model ...47
viii
List of Figures
Figure 2-1- Paradigm shift in the Telecommunications business (Olsson, 2003) ...5
Figure 2-2 - Example of established relationships in a convergence environment (Berg, M. et al, 2003) ...6
Figure 2-3 - The main elements of the interaction model (Håkansson, 1982) ...8
Figure 2-4 - Relationship between loyalty and satisfaction (McNealy 1996) ...9
Figure 2-5 - Relationships between the many-headed supplier and many-headed customer...12
Figure 2-6 - Diagram of Homburg and Rudolph Customer Satisfaction construct ...13
Figure 2-7 - Examples of quality dimensions (Kumar 2006) ...14
Figure 2-8 - Diagram of proposed Word of Mouth construct of Oh (Oh, 1999) ...15
Figure 2-9 - Diagram of relationship between Quality and Customer Retention ...16
Figure 2-10 - Managing customer relationships: a strategic framework (Peppers and Rogers, 2004 ...19
Figure 2-11 - Frame of Reference ...21
Figure 3-1 - Illustration of possible reliability and validity situations in measurement...29
ix
Executive Summary
Num mundo em constante mudança, as empresas devem apostar nos seus clientes para garantir a sua sobrevivência e futuro sucesso. No entanto, quais são as variaveis que realmente infuenciam a intenção de manter e desenvolver um relacionamento comercial?
Durante vários anos, a Satisfação de Cliente foi considerada a variável que mais infuenciava a intenção de recompra e, consequentemente, a intenção de manter um relacionamento comercial. Neste estudo é provado que a Satisfação de Cliente, apesar de importante no contexto comercial, não é de todo a variável mais importante quando se fala de Intenção de Recompra.
Pelo estudo efectudado, demonstra-se que num contexto Business-to-Business, tendo como foco especial o sector das telecomunicações internacionais, a Satisfação do Cliente não tem um impacto directo na intenção de Recompra, sendo que a sua importância é mais relevante no promoção feita pelos clientes à empresa.
Por fim, comprava-se a complexidade da variável de Intenção de Recompra, que acaba por ser determinada por vários aspectos da empresa que fornece o serviço, desde os produtos e/ou serviços que fornece até ao valor acrescentado por estes, passando pela confiança que se estabelece entre duas empresas.
1
1
Introduction
1.1
Background
When Bell invented the telephone or Marconi established the first intercontinental broadcast using radio electric waves, they could not predict the impact their discoveries would have in the world nor could they anticipate the billions of dollars the Telecommunications industry would represent in the future.
People have always wanted to communicate with each other and Telecommunications give them the opportunity to easily do it. Telecommunications innovations, like telephone or satellite, united families and countries, developed several different types of businesses and provided a wealthy source of income for several Governments.
Until the 90s, the majority of telecommunications companies were owned by the governments and they were considered strategic. In fact, they were monopolies, with huge profitability and mainly focused on their own countries.
When finally the Telecommunications services were liberalized throughout the industrialized world and the Telecommunications giants were privatized, this business became one of the most attractive in the world, with several new companies trying to enter the market. As a result, in the last decade, this sector has gone through a consolidation process, which included several acquisitions and even, the bankruptcy of MCI Worldcom.
On the other hand, in this period, the companies were also severely affected by the continuous reduction of the bandwidth price due to the new discoveries in transmission mediums. Innovations like the Internet, ADSL connections or VoIP completely changed the Telecommunications business structure, and the old profit formula: “selling bandwidth and calls with phenomenal margins” simply collapsed.
Nowadays, the Business to Business (B-2-B) Telecommunications sector plays a fundamental role in the world economy. Without it, companies could not reach their clients, nor could they expand their businesses to new countries. In addition, in table 1-1, the financial indicators of
2 the biggest players of the Business-to-Business Telecommunications are shown, to demonstrate the strength of this market.
Group (2010 results)
Market capitalization
Revenue EBITDA Customers
ATT $185.65B $125.00 B $38.59B Not disclosed
Vodafone $148.46B $74.18B $23.77B 340 K
Telefónica $111.64B $89.30B $32.44B 265 K
Verizon $102.7 B $106.64B $34.78B 87 K
France Telecom $58.22B $65.04B $21.80B 193 K
BT $23.64B $33.36B $8.54B Not disclosed
Table 1-1 - Financial data of main International Telecommunications Groups (http://finance.yahoo.com)
1.2
Problem Statement
Nowadays, the global telecommunication business is quite complex as there are several competitors, including regional and local companies that are able to reach the global market through alliances. All companies have access to the same technology and customers are increasingly better informed and more demanding. Moreover, the market is unstable with many acquisitions and fusions happening. On the other hand, the traditional business in Telecommunications, as previously highlighted, is no longer profitable and only Value-Added Services seem to be able to guarantee the companies survival.
In an environment where competitiveness is no longer determined by the technological factors and, when retaining customers is becoming increasingly difficult, in order to be successful, a company needs to know its customers and, above all, needs to know how each aspect of itself influences the customers in a positive way, in a way that leads to Repurchase Intention. As a result, the following questions should be posed:
• Which constructs or aspects of a company truly influence Repurchase Intention?
• What makes a customer Recommend a Company?
• Does Overall Customer Satisfaction directly influence Repurchase Intention?
• Is Trust relevant?
• Moreover, Quality: how does it relate with Customer Satisfaction and Repurchase Intention?
3
1.3
Research Objectives
The main goal of this thesis is to determine, through statistical analysis, what are the main constructs that influence and impact customer Repurchase Intention in the International Telecommunications industry.
By developing this analysis, the main goal is to help the service companies, mainly the Telecommunication Companies, to better know where to put their efforts, in order to maximize each one of the studied constructs and, in turn, maximize repurchase intention.
1.4
Thesis division
In order to achieve the Research objectives, this thesis is divided into five main chapters. Firstly, it will start with an introduction where a background of the telecommunications business will be presented and the research problem developed.
In the second chapter, the literature review will be done, with the main focus in repurchase intention, trust, customer satisfaction and quality, and the research questions and frame of reference will be developed.
In section three, the research methodology will detailed and in section four, the study of the empirical data will be done and the results of the statistical analysis will be presented.
4
2
Literature Review
2.1
Global Telecommunications Industry
2.1.1
Dynamic Evolution
As highlighted in the first part of this thesis, the Telecommunications Industry has had several changes in the last years, namely acquisitions, consortiums and fusions.
In the end of the last century, all TMT companies were considered good investments, all projects in this area were seen as good opportunities and companies were encouraged to get bigger and more adventurous in their pursuits.
As Curwen and Whalley (2004) highlighted, Telecoms were taking over each other not only impelled by an expanding market, but also by the eagerness of the national governments to have success abroad. For example, Worldcom became a huge company through fast pace acquisitions and European Telecommunications companies made several foreign investments.
However, in 2001 the markets plough, with the crisis in the TMT quickly spreading into other industries. The absurd values of the acquisitions practiced in the past were punishing the companies and, regardless of their financial stability or even sound investments, all were severely affected (Curwen and Whalley, 2004).
Along with this crisis, the technological factors also changed with the convergence of technologies, which created new opportunities for the Telecom companies to expand vertically. Moreover, Telecom Customers, and specifically, the customers of the International Telecoms started to demand different products and services.
In fact, part of the development and expansion of the telecommunications companies were due to the customer requirements and requests (Goleniewski, 2002).
5
Figure 2-1- Paradigm shift in the Telecommunications business (Olsson, 2003)
In this context, Outsourcing became a famous word, with companies wanting to focus on their core objectives and delegating the telecommunications to the specialists. This fact represented huge opportunities for the sector, with some outsourcing agreements reaching several millions of dollars.
On the other hand, the companies started to face a new competitor: Internet, which allowed good connectivity at a low price. Internet shattered what was until then the domain of private networks. In addition, IPSEC software made Secure Connections over the Internet possible and several companies have taken this route to establish their internal networks in a cheap way (Minoli, 2003).
Another development that affected Telecoms was VoIP protocol: the possibility of making Voice calls over Internet. In fact, VOIP was a huge development for the consumer that had now the possibility of making calls at a very low cost through the Internet. However, for telecommunications companies, it was a nightmare as it reduced the phone bills considerably, mainly for the international calls.
Products like DSL or Ethernet Links are starting to make normal Leased Lines obsolete and even in certain European countries Leased Lines are no longer available (ITU-T 50 years of Excellence, 2006). The combination of these technologies contributes for the reduction of the Telecommunications Companies’ profits.
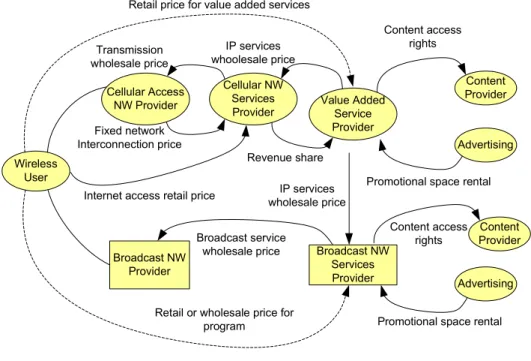
6 All these changes and developments are signs of the convergence that took place in the sector and still is a major trend in this business. Two type of convergence may be defined: a technological convergence between voice and data, and a sector convergence between Telecommunications, IT and Media (Katz, 1996).
Wireless User Content Provider Broadcast NW Provider Content Provider Advertising Broadcast NW Services Provider Advertising Retail price for value added services
Content access rights IP services whoolesale price Transmission wholesale price Fixed network Interconnection price Revenue share Cellular Access NW Provider Cellular NW Services Provider Value Added Service Provider
Promotional space rental IP services
wholesale price Internet access retail price
Broadcast service wholesale price
Content access rights
Promotional space rental Retail or wholesale price for
program
Figure 2-2 - Example of established relationships in a convergence environment (Berg, M. et al, 2003)
As a result of all these developments, nowadays, the biggest International Telecommunications companies are transforming themselves into integrators: integrating fixed, mobile and wireless communications, with the convergence of the different types of Telecommunications. Moreover, several agreements between Microsoft, Accenture or IBM and the Major Telecommunications companies show the necessity of expanding into different areas of business, outside of their comfort zone. These new areas include services, often quite complex, which rely greatly on relationships and customer bonding (ITU Telecom World 2009).
7
2.1.2
The “unpredictable” consumer and the “needing” customer
All the changes discussed in the previous chapter had a direct impact on the relationship between customers/ consumers and companies. The increasing number of competitors, the development of new services and the reduction in prices empowered consumers (Olsson, 2003).
Nowadays, end users are no longer tied to monopolies, as they have a varied offer to choose from. In addition, they are more aware of their rights and the value of companies’ products and services. Telecommunications Companies aggressive Marketing and regulators bodies have contributed greatly for this emancipation. In fact, the liberalization of the Telecommunications Business, with services like phone numbers portability, gave customers the freedom of choice and the power to change (Olsson, 2003) and, at the same time, forced companies to improve and be innovative.
However, focusing in a business-to-business environment, although the customers have also been empowered, customer needs do not support unpredictability nor uncertainty, as business needs are long term ones and stability is fundamental (Baker, 2003). In addition, Fill (2006) advocates that positive relationships between buying and selling organizations are pivotal for success.
In a business-to-business environment, according to Håkansson (1982), the existence of multiple and complex interactions between buyer and seller organizations are the main differentiators from the traditional consumer behavior.
Moreover, several studies have shown that long-terms relationships with customers may be very profitable for a company, with the total profit attained from the customer increasing throughout the duration of the contract. In fact, it may start with the basic profit attained from the contracted services but throughout the contract, it may include more sold services and word-of-mouth and referrals effect, if the customer is delighted with the company (Bruhn, 2003).
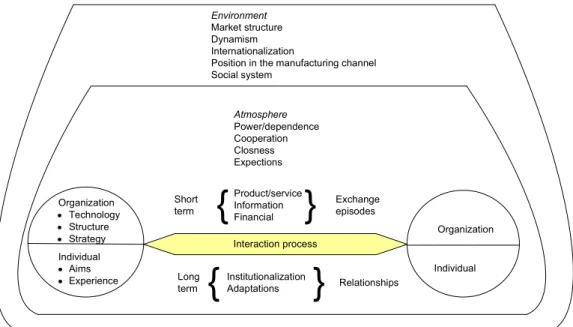
8 Environment
Market structure Dynamism Internationalization
Position in the manufacturing channel Social system Atmosphere Power/dependence Cooperation Closness Expections Short term Exchange episodes Product/service Information Financial
{
}
Long term Relationships Institutionalization Adaptations{
}
Interaction process Organization Individual Organization Technology Structure Strategy Individual Aims ExperienceFigure 2-3 - The main elements of the interaction model (Håkansson, 1982)
The need for stability and predictability has a huge influence in the way Global Telecommunications Companies manage their interactions with their customer, which are also companies. Therefore, long term relationships seem to be the solution for future growth and sustainability of the Business to Business telecommunications sector.
2.2
Customer Retention & Repurchase Intention
2.2.1 Definition
Customer retention has been a quite discussed topic among scholars, mainly relating with relationship marketing (Pfeifer and Farris, 2004). However, why is Customer Retention so important? According to Ang and Buttle (2006), several studies showed that a 5 per cent increase in Customer Retention represent an increase of 25 to 95 per cent in the customer net present value, depending on the type of business. Moreover, existing customers are usually less sensitive to price, bring along new customers and do not have star up costs (Komorowski and Zytkow, 1997; Pfeifer and Farris, 2004).
Nevertheless, Customer Retention seems to be difficult to define. According to Blattberg and Getz (2001), Customer Retention may be defined as: the customer continues to purchase a
9 service or a product during a certain amount of time. However, the issue with this definition is the fact that, in a Business-to-Business environment, the amount of time between repurchases may be years. As a result Balttberg and Getz (2001) proposed that not only the action but also the Repurchase Intention should count as retention in businesses with long purchases cycles.
Following this, which constructs should influence Repurchase Intention? For several years, most literature about customer satisfaction was based on the idea that a satisfied customer would buy more products or services and would prolong their relationship with the suppliers just because they were satisfied. As a result of this assumption, Customer Satisfaction would immediately lead to more purchases and business growth (Gerson, 2004; McNealy, 1996).
For example, according to Mcnealy (1996), Customer Satisfactions had an impact on Customer Loyalty that in turn had also an effect on Customer Retention, as detailed in Figure 2-4.
Figure 2-4 - Relationship between loyalty and satisfaction (McNealy 1996)
Indeed, as seen in this model, Customer Satisfaction was considered the most important construct of Customer Retention and, consequently, Repurchase Intention. Following this, several companies invested in strategies to maximize customer satisfaction, expecting that this action would by itself guarantee the retaining of existing customers and business success (Piercy, 2002; Hennig-Thurau and Klee, 1997).
10 However, practice would prove that Customer Satisfaction alone would not guarantee repurchase (Piercy, 2002). In fact, it was detected that customers that stated they were satisfied with the services of a company would easily switch to a competitor (Griffin, 2002). Moreover, in certain areas of business, it seemed to exist more switching among satisfied customers than dissatisfied ones (Hennig-Thurau and Klee, 1997).
Following this, the obvious relationship between Customer Satisfaction and Repurchase Intention started to be better analyzed and Repurchase Intention Construct proved to be far more complex than once thought. For example, recent meta-analysis of customer satisfaction revealed that it only accounted for 25% of the variance in repeat purchase in certain businesses (Szymanski and Henard, 2001), while, in other areas of business, there is no direct link between customer satisfaction and repurchase intention (Hennig-Thurau and Klee, 1997).
2.2.2 Repurchase Intention as a complex concept
Having this mind, Repurchase Intention is a more complex concept that one could suppose: not only it may be associated with customer satisfaction, but it may also be related with several other factors. According to Bendapudi and Berry (1997), Repurchase Intention is related with Customer Loyalty and Switching Constrains.
Switching constrains are related with the barriers that the provider creates in order to keep the customer. In the telecommunications area, these constrains may vary from price reductions to outsourcing agreements, varying through different value-added services (Lee and Murphy, 2005). In fact, a bigger service component corresponds to bigger switching constrains, due to the interactions effect and a higher uncertainty associated with patronage switching and higher switching costs (Lee and Murphy, 2005).
Having this in mind, what companies truly want are Loyal Customers. Customer Loyalty goes beyond the simple Repurchase Intention, it means a delighted customer that praises the company and promotes it, it means an affective relationship between the customer and the provider, something that customer retention alone does not have (McNealy, 1996). As Gremler and Brown (1999) put it: it is one of the best ways to have an extended sales force.
11 In fact, when customers are delighted with a company, they promote it; they talk about how happy they are with the services, how exciting the news products are or how friendly the people in the company are. All these nice conversations contribute to promote the company in the society and, a positive word-of-mouth may do wonders to the sales of a company (Gremler and Brown, 1999).
Unfortunately, achieving this degree of psychological bonding is not easy; it implies satisfaction but, above all, trust and a very good relationship. As Chandrashekaran, Tax, Rotte and Grewal (2007) highlighted, Customer Loyalty is only achieved through good and sound relationships between customers and providers.
Finally, as the surveys used in this study do not have information to analyze Switching Constrains, the model proposed will focus mainly on the constructs related with Customer Loyalty: for example Trust.
2.3
Customer Satisfaction
2.3.1 Definition
Customer Satisfaction has had the keen interest of researchers in the last decades, with hundreds of articles published about this subject in several different publications. However, how can one define Customer Satisfaction? According to Johnson and Fornell (1991), it may be defined as the customer overall evaluation of the performance of an offering, product or service, up to date.
In addition, Gerson (2004) defines Customer Satisfaction as the customer perception that his or her expectations have been met or surpassed and Thurau and Hansen (1999) define it, based on the disconfirmation paradigm, as the customer‘s emotional or empathic reaction to a perceived difference between performance appraisal and expectations.
As a result, Customer Satisfaction may be defined as the degree to which customer expectations of a product or service are met or exceeded. Following this, customer satisfaction is greatly related with expectations, perceived value and quality of a service or product. In fact, McDougall and Levesque (2000) proved that core service quality and perceived value have a strong influence on Customer Satisfaction.
12
2.3.2 Customer Satisfaction in Business-to-Business relationships
In Business-to-Business relationships, like the ones that are under analysis in this study, the duration and the customer involvement in the relationship are completely different from the normal consumer behavior, which is usually restricted to a single transaction and as Gummesson (2002) put it, transitions do not have memory or history and sentiment is not usually involved in them.
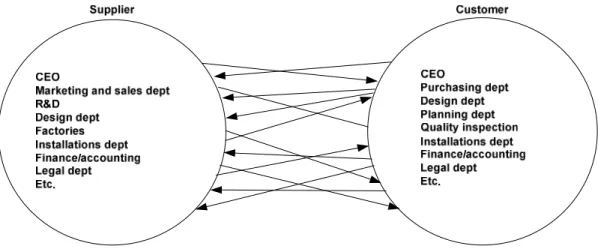
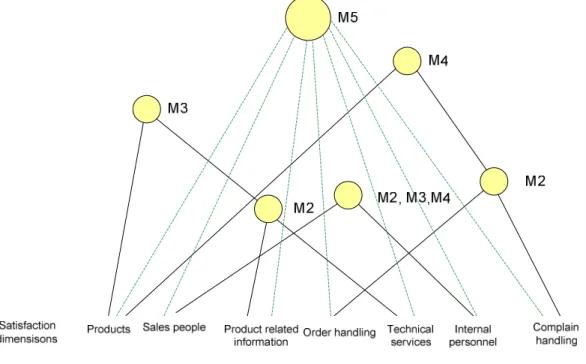
On the other hand, Business-to-Business relationships have a history, as they could last for several years, and also have sentiment, as there is a greater involvement of the customer in the service that is provided (Homburg and Rudolph, 2001), with collaboration being a common practice between sellers and buyers. As a result, these relationships are complex and the interactions occur between all levels of the buyer and seller companies. The customer may interact with sales people, but also with technical people, management or the financial department. So, multiple interactions are established (figure 2-5) and all of them contribute to Customer Satisfaction (Gummesson, 2002).
Figure 2-5 - Relationships between the many-headed supplier and many-headed customer
In addition, these interactions may not all have the same impact on Customer Satisfaction. Frequency of encounter and the attitude towards the customer influence considerably Customer Satisfaction. In fact, what matters is the quality of the relationship (Thurau and Klee, 1997).
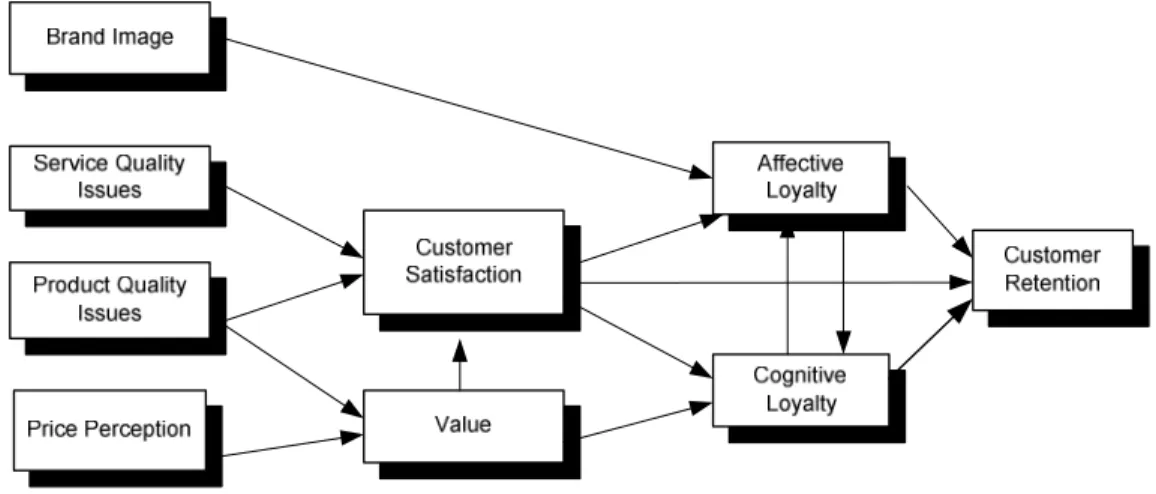
13 Having this in mind, Homburg and Rudolph (2001) developed a multi-dimensional conceptualization of the industrial customer satisfaction, detailed in figure 2-6, that focus on the different interactions customers have with the seller company in a Business-to-Business environment.
This multi-dimensional analysis has great consequences for Customer Satisfaction. The first conclusion is that everyone and everything that is in contact with the customer may impact customer satisfaction. This leads to the conclusion that personal relationships are fundamental in a Business-to-Business environment in order to maintain customers satisfied (Homburg and Rudolph, 2001).
Figure 2-6 - Diagram of Homburg and Rudolph Customer Satisfaction construct
The other conclusion is that companies must know their customer well, know their needs, their desires and what delights them. In this way, each interaction can increase Customer Satisfaction and lead to Repurchase Intention (Gerson, 2004).
14
2.4
Quality Perception
2.4.1
Definition
Quality is regularly used to define an object, product or a service that fulfils one’s needs and exceeds one’s perception of what that object, service or product should be. In fact, according to Jain (2001), Quality may be defined as the degree to which a product or service meets the requirements of a customer.
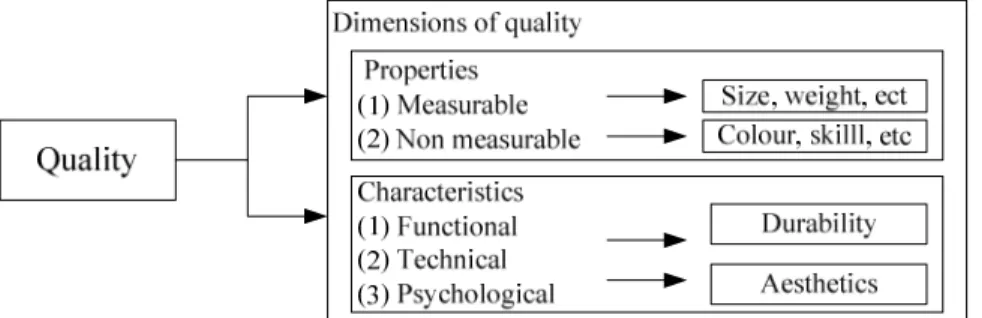
On the other hand, Kumar (2006) defends that is impossible to have a single definition of Quality because it is not a unique phenomenon; it involves several parameters and different dimensions (figure 2-7). Following this, Quality has already been defined in the literature, as “fitness for use” or “conformance to requirements and specifications”, all depending on the dimension of Quality that is under analysis.
Figure 2-7 - Examples of quality dimensions (Kumar 2006)
ISO 9000:2000 defines quality as the degree to which a set of inherent characteristics fulfils a need or expectation that is stated: general, implied or obligatory (Hoyle, 2005).
Following these definitions, it is clear the importance of quality, as it is related with the customer expectation. In fact, customers demand Quality and that is why a company can be certified through the ISO certification system.
As Hoyle (2005) highlights, customers may choose their suppliers through recommendation or testing of the suppliers capabilities. However, when this is not possible or feasible, a third party (ISO certifications) authentication of the company’s quality is fundamental.
15 ISO certifications imply that Quality is perceived as a strategic goal and, not only, a goal of the operational department. In fact, Quality is of the utmost importance for the companies, if they want to be successful.
2.4.2
Quality perception versus Customer Satisfaction
The relationship between Quality and Customer Satisfaction is not yet perfectly defined and, furthermore, may even be considered a controversial one. In fact, some authors state that Quality Perception is an antecedent of Customer Satisfaction (Oh, 1999), while others define Customer Satisfaction as an antecedent of Quality Perception (Hennig-Thurau and Klee, 1997).
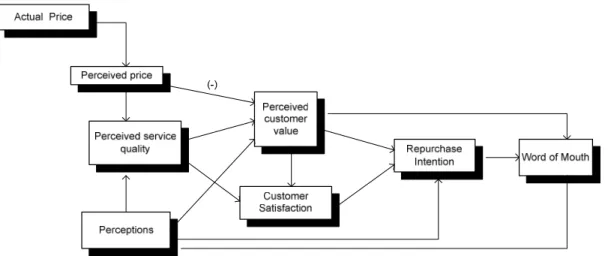
According to Oh (1999), Quality Perception is an antecedent of customer satisfaction, as quality perception is related with a conformation or disconfirmation of an expectation (figure 2-8). As a consequence of the disconfirmation theory, if customers perceive bad quality, they are dissatisfied and if they perceive good quality, they are satisfied. In addition, it is Customer Satisfaction that has a direct impact on Repurchase Intention.
Figure 2-8 - Diagram of proposed Word of Mouth construct of Oh (Oh, 1999)
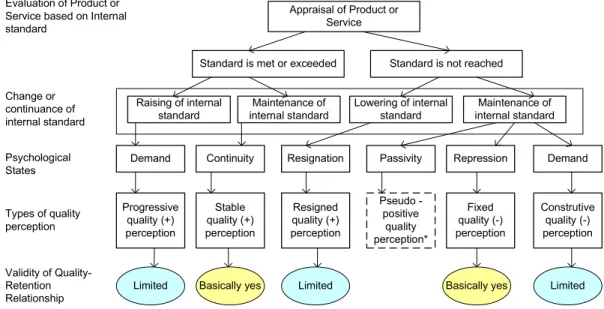
On the other hand, Hennig-Thurau and Klee (1997) have a completely different understanding of the relationship between Perceived Quality and Customer Satisfaction. According to them, before engaging in a commercial transaction, the customer already has a perception and a
16 concept of quality, which was formed by previous experiences of satisfaction or dissatisfaction (figure2-9). So, Customer Satisfaction is an antecedent of the Quality construct and it is Quality that has a direct impact on Customer Retention / Repurchase Intention.
Appraisal of Product or Service
Standard is not reached Standard is met or exceeded
Raising of internal standard Maintenance of internal standard Lowering of internal standard Maintenance of internal standard
Demand Continuity Resignation Passivity Repression Demand
Progressive quality (+) perception Stable quality (+) perception Resigned quality (+) perception Pseudo -positive quality perception* Fixed quality (-) perception Construtive quality (-) perception
Limited Basically yes Limited Basically yes Limited
Evaluation of Product or Service based on Internal standard Change or continuance of internal standard Psychological States Types of quality perception Validity of Quality-Retention Relationship
* Pseudo-positive perception is seen by Bruggemann et all as the result of distorting the perception of a situation that is regarded as unchageable. Because of the grave measurement difficulties inherent in this construct, this quality type will be ignored here.
Figure 2-9 - Diagram of relationship between Quality and Customer Retention
These two different interpretations illustrate the difficulty scholars have in reaching an agreement on the relationship between Customer Satisfaction and Quality and which of these constructs has an influence in Repurchase Intention.
2.5
Trust
2.5.1
Definition
Trust is one of the most studied themes in the last years in all fields of Social science, from Management to Sociology. While it was a small niche of study in the early 80s, it has developed to be one of the most important constructs in management (Bachmann and Zaheer, 2006). Being a very complex theme, Trust has several possible definitions with scholars separating the meanings for people or organizations and intra-organizations or inter-organizations. Nevertheless, almost all definitions are based on a relationship between a
17 thruster, the person that trusts, and a trustee which may be a person or a system (Bachmann and Zaheer, 2006; Herrmann et all, 2005).
For example, Giddens (1994) defines Trust as the confidence in the reliability of a person or a system regarding a given set of outcomes. On the other hand, Trust may also be defined as the extent to which a given party is willing to depend on something or somebody in a given situation with a feeling of relative security, even though negative consequences are possible (Herrmann et all, 2005).
These definitions show that Trust implies confidence regardless of a possible assumption of risk. As a result, in certain areas, legal aspects are fundamental to incentive a trustful relationship, as they provide protection and a guarantee against the risk of trusting (Herrmann et all, 2005).
All these different aspects contribute for the complexity of the Trust construct.
2.5.2 Trust in a Business-to-Business Context
Several authors (Hardin, 2006) defend that Trust is a feeling that is declining in our societies with negative impacts on social interactions and cooperation. Aligned with this declining, the neoclassical theories are based on the self-interested rational behavior; in other words, they postulate the egoism of the economic agents, leaving no space for Trust or cooperation (Hermann et all, 2005). However in real life, economic agents are less selfish than the neoclassical theories predict and Trust is proofed to be fundamental for the maintenance of the interdependent world we live in and for its economic development (Sztompka, 1999).
In a Business-to-Business environment, like the one that is being study in this thesis, Trust is of the utmost importance for the maintenance of lasting relationships (Morgan and Hunt, 1994; Egan, 2008). Trust impact is felt on the reductions of transaction costs between the parties, as it decreases the need for more complex contracts and lessens the necessity of control and monitoring. Moreover, in a relationship based on Trust, partners also believe that no opportunistic behavior will take place and cooperation between the parties will be the basic rule (Nacif, 2002). In fact, Trust is so important, that even an all new approach to marketing was developed around it: Relationship Marketing.
18 Although Relationship Marketing has only 20 years as a concept (Morgan and Hunt, 1994), it has been in practice since the Middle Age: whenever it was detected that a customer had more potential than the normal customer, a relationship was developed based on commitment and Trust (Buttle, 1996). Now-a-days, in a Business-to-Business environment where the development of products and their acquisition are very expensive, and after sale support is fundamental, trust and commitment between sellers and buyers are vital for the business development and the survival of both parts (Morgan and Hunt, 1994; Buttle, 1996; Hennig-Thurau and Hansen, 2000).
Following this reasoning, Trust must ultimately lead to Repurchase Intention, and according to Davis and Manrodt (1996), this connection is obvious: customers simply tend to patronize with the companies they trust. However, how does a company promotes trust with their customers in a business-to-business environment?
According to Von Krogh and Roos (1996), Trust construct for cooperative agreements depends mainly on predictability, but also on dependability and faith. Beamish and Killing (1997) also defend that in a cooperative relationship, in an international environment, Trust is mainly dependent on the expectations about the continuity of the agreement, exchange of information and flexibility. Considering this, a company should be predictable in its action and have no opportunistic behaviors. Moreover, good communication between the parties is a key element to preserve the flow of information (Morgan and Hunt, 1994).
19 S Y M M E T R Y F A IR N E S S D E P E N D E N C E / U N C E R T A IN T Y S A T IS F A C T IO N C O M M IT M E N T T R U S T
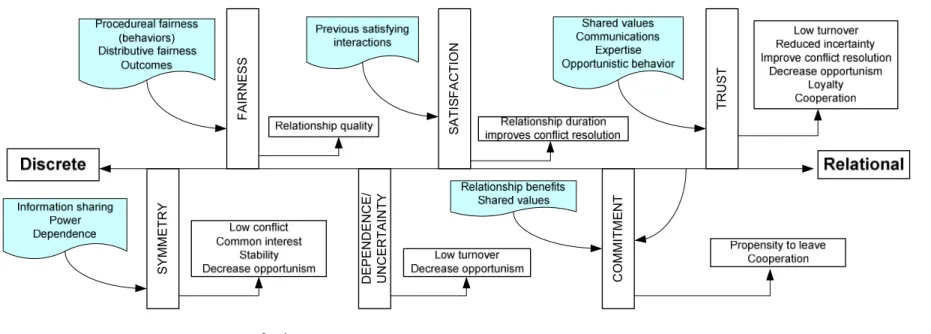
Figure 2-10 - Managing customer relationships: a strategic framework (Peppers and Rogers, 2004
As this strategic framework (figure 2-10) shows, part of the constructs analyzed in the thesis, Customer Satisfaction or Trust, is directly involved in a Business-to-Business relationship and Repurchase Intention.
20
2.6
Literature and Research Questions
As highlighted in the literature analysis for Customer Satisfaction, when customers are delighted, they will talk about the company, creating an extension of the company sales force (Gremler and Brown, 1999). As a result, it is expected that Customer Satisfaction will have a direct influence on Recommending the Company:
H1: Customer Satisfaction will largely influence Word of Mouth (Recommending the Company).
Considering the literature review of Quality Perception versus Customer Satisfaction and the controversial aspects of the relationship between these two constructs, it is expected that they are different constructs. In fact, while Henig-Thurau and Klee (1997) defended that customer satisfaction is an antecedent of quality perception, Oh (1999) has a completely different opinion.
H2: Overall Customer Satisfaction and Quality Perception are different constructs.
Considering how difficult it is to define a model for Repurchase Intention: Bendapudi and Berry (1997) purpose that Repurchase Intention is related with customer loyalty and switching constrains, while other authors defend that Customer Satisfaction plays an important role (McNealy, 1996). It is considered, as hypothesis, that all main constructs, will influence Repurchase Intention construct.
H3: Overall Customer Satisfaction influences Repurchase Intention
H4: Trust influences Repurchase Intention
21
2.7
Frame of Reference
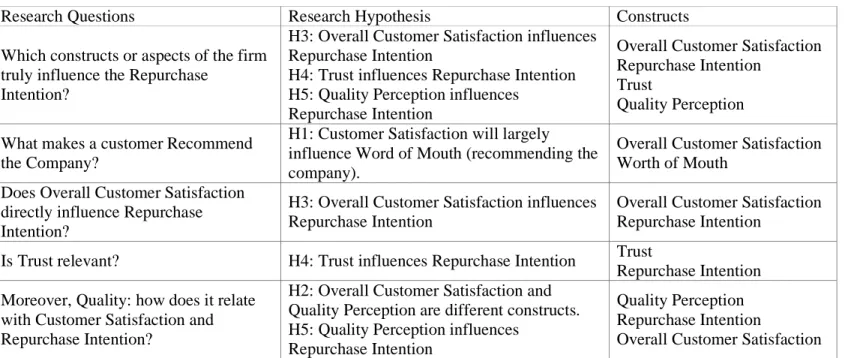
Taking into consideration the hypotheses that were raised in the previous section, the following Frame of Reference (Figure 2-11) can be deducted:
Figure 2-11 - Frame of Reference
In detail, Overall Customer Satisfaction is a different construct from Quality Perception and is one of the most important constructs of Word of Mouth. In addition, Overall Customer Satisfaction, Quality Perception and Trust influence Repurchase Intention.
22
Research Questions Research Hypothesis Constructs
Which constructs or aspects of the firm truly influence the Repurchase
Intention?
H3: Overall Customer Satisfaction influences Repurchase Intention
H4: Trust influences Repurchase Intention H5: Quality Perception influences
Repurchase Intention
Overall Customer Satisfaction Repurchase Intention
Trust
Quality Perception What makes a customer Recommend
the Company?
H1: Customer Satisfaction will largely influence Word of Mouth (recommending the company).
Overall Customer Satisfaction Worth of Mouth
Does Overall Customer Satisfaction directly influence Repurchase Intention?
H3: Overall Customer Satisfaction influences Repurchase Intention
Overall Customer Satisfaction Repurchase Intention
Is Trust relevant? H4: Trust influences Repurchase Intention Trust
Repurchase Intention Moreover, Quality: how does it relate
with Customer Satisfaction and Repurchase Intention?
H2: Overall Customer Satisfaction and Quality Perception are different constructs. H5: Quality Perception influences
Repurchase Intention
Quality Perception Repurchase Intention
Overall Customer Satisfaction
Table 2-1 Relationship between research questions, research hypothesis and constructs
The proposed relationships are deducted from the Literature Review and are based on it is expected to happen on a Business to Business environment.
23
3
Research Methodology
3.1
Research Purpose
In Social Science, the research purpose may be classified into three groups: Exploratory, Descriptive and Explanatory.
Exploratory research, according to Stebbins (2003), is an undertaking with the goal to discover generalizations that lead to the description and understanding of an area of social or psychological life. It is the type of research that provides the first insight about a problem and it is not aimed at reaching conclusions.
Descriptive research, on the other hand, is not related with explanation, it is related with the description or classification. According to Carter (2001), the aim of descriptive research is to discover new facts about a situation or people, through the collection of information about the phenomenon, which will be the basis for further research and namely, explanatory research. A good descriptive research is the one that will provide the “why” questions (Vaus, 2001).
Explanatory research has it basis on “why” questions (Vaus, 2001) and on the discovery of cause-effect relationships. This type of research will go further into the findings of the descriptive research and it will try to prove them with experiments and statistics.
Taking into account the definitions presented above, this thesis may be characterized as a Descriptive research. First of all, in the lecture review, it has been proven that there is a relationship between Trust, Quality, Customer Satisfaction and Repurchase Intention, making an exploratory research not necessary. On the other hand, in the thesis, the statistical analysis is done in order to determine which constructs influence Repurchase Intention, but the origin of these relationships is not analyzed, nor explained. Therefore, the questions posed are “how” and “how much” questions and not “why” questions, which proves that this is a Descriptive research.
24
3.2
Research approach
The research approach may be qualitative if it does not pursue the quantification of a phenomenon. It is a broader approach to a study of a social event that seeks to answer the “why” and “how” questions (Baker, 2003). Due to this, the researcher plays a fundamental role in the data acquisition and analysis and, consequently, the quality of the research relies greatly on their skills and knowledge (Patton, 2002).
On the other hand, the research approach may be quantitative if it quantifies a relationship between two or more variables (Schmidt and Hollensen, 2006). This type of research is also characterized by a certain degree of distance between the researcher and the people that are subjected to the analysis.
In fact, according to Schmidt and Hollensen (2006), the objective of qualitative research is to give a holistic view of the research problems. On the other hand, the quantitative research narrows its analysis to less variables of the problem but focus on a large amount of respondents, to effectively extract a mathematical relation.
Based on this analysis, this thesis is based on a quantitative approach, as the data of an international telecommunications firm is statistically analyzed to quantify the relationships of the variables under study.
3.3
Research Strategy
According to Yin (2009) there are five forms of research strategies that could be used: Survey, Experiment, Archival analysis, History and Case Study.
Each research type differs and to make a correct choice, according to Yin (2009), the following conditions have to be studied:
• The type of research questions posed
• The extent of control an investigator has over actual behavioral events
• The degree of focus on contemporary as opposed to historical events
25 Strategy Form of Research Question
Requires Control of Behavioral Events Focuses on Contemporary Events
Experiment How, why? Yes Yes
Survey Who, what, where, how many, how much? No Yes Archival
analysis Who, what, where, how many, how much? No Yes/No
History How, why? No No
Case Study How, why? No Yes
Table 3-1 - Relevant situations for different research strategies (Cosmos Corporation)
As previously highlighted, this research is primarily based on the Customer Surveys of an International Telecommunications Company. Following this, the research strategy will be Surveys, which will enable the identification and quantification of a relationship between Customer Satisfaction, Quality Perception, Trust, Word of Mouth and Repurchase Intention.
3.4
Population and Sample Selection
As previously highlighted, the population of the analysis corresponds to the customers of an International Telecommunications company. These customers are other companies, mainly Global and multinational ones. Therefore, this study analyses a Business to Business environment.
In detail, from these companies, the sample is selected as follows:
• Top 100 Companies (with the highest revenue)
• Major Companies Worldwide
• Major Regional Companies
• Major National Companies
From these companies, only the key players were surveyed: IT Managers and teams, Financial Managers and Commercial Managers.
26
3.5
Data Collection
3.5.1 Survey
The survey is made of 27 general questions (Annex 3), which are divided into 3 categories, depending on the type of reply: Satisfaction, Agreement and Likelihood. This division is based on a 5 points Likert scale. In detail:
Satisfaction’s reply type:
1 – Very dissatisfied 2 – Dissatisfied 3 – Neutral 4 – Satisfied 5 – Very satisfied
Likelihood’s reply type:
1 – Very unlikely 2 – Unlikely 3 – Neutral 4 – Likely 5 – Very likely
Agreement’s reply type:
1 – Strongly disagree 2 – Disagree
3 – Neutral 4 – Agree
5 – Strongly agree
27
Question Type of reply Variable
Name Overall Satisfaction with The Company Satisfaction Customer Sat
Recommend The Company Likelihood Recommend
Purchase Intention for The Company Likelihood Repurchase
Choose The Company 1st time Likelihood 1st time
Agree: Trust in The Company Agreement Agree trust
Agree: The Company is high quality organization Agreement Agree Quality Agree: The Company solutions answer business
challenges Agreement
Agree Challenges Agree: The Company provides good value for money Agreement Agree Money Agree: The Company creates business value Agreement Agree Value Agree: The Company is partner not supplier Agreement Agree Partner Agree: The Company is easy to do business with Agreement Agree Easy Agree: The Company co-ordinates well internally Agreement Agree
Co-ordination Agree: The Company informs using high quality
deliverables Agreement
Agree Deliverables Overall Sat Product & Solutions Portfolio Satisfaction Prod Sat Prod Sat: Meeting product needs Satisfaction Prod Needs Prod Sat: Ability to adapt products Satisfaction Prod Adapt Prod Sat: Innovation on product development Satisfaction Prod Innov Prod Sat: Communication of portfolio and benefits Satisfaction Prod Comm
Sat: Overall Account Management Satisfaction Sat AM
Sat: Overall Pricing Satisfaction Sat Price
Sat: Overall Consulting Services Satisfaction Sat CS Sat: Overall Project Management Service Satisfaction Sat PM Sat: Overall Technical Service Delivery Satisfaction Sat TSD Sat: Overall Service & Solution Performance Satisfaction Sat SSP Sat: Overall Customer Support & Incident Management Satisfaction Sat CSIM
Sat: Overall Service Management Satisfaction Sat SM
Sat: Overall Billing/Invoicing Satisfaction Sat Bill
Table 3-2 - List of question versus variables names used in the research
3.6
Data Analysis Procedure
Firstly, the data will be analyzed through descriptive statistics.
Secondly, it will be tested for Normality, as all posterior analyses are based on this assumption. The normality tests used were Kolmogorov-Smirnov and Shapiro-Wilk tests.
28 In addition, the correlation between all the variables will be under analyses. The correlation used is Pearson correlation with α=0.05. The Pearson correlation is appropriate as all variables follow a Normal curve, as detailed in Annex 2.
Finally, Linear Regression will be used to create statistical models for all main variables. Specifically:
• Customer satisfaction
• Quality perception
• Trust
• Recommend the company (word of mouth)
• Repurchase intention
The following table resumes the statistics used in this study.
Type of Statistics Purpose
Descriptive ( Mean, Standard Deviation, Anova) Describe the data Kolmogorov-Smirnov and Shapiro-Wilk Test for Normality
Pearson Correlation Correlation between variables.
Linear Regression with co-linearity Determine valid statistical models
Cronbach tests Confirm reliability of the models
Table 3-3 - Different types of the statistics used in the study
Following this analysis, the hypothesis of the thesis will be tested against the models created for the different constructs.
3.7
Validity and Reliability
In order to guarantee the quality of the research and the usefulness of its conclusions, the assessment of the measurement is vital. On the other hand, it is also fundamental that the measurement procedure is done correctly. In fact, for the measurement method to be acceptable, it must be reliable and valid. A valid measurement is always reliable; however, a reliable measurement may not be valid, as demonstrated in the picture below.
29
Figure 3-1 - Illustration of possible reliability and validity situations in measurement
Validity, as Cargan (2007) highlights, has three main types:
• Construct validity that refers to the establishment of correct operational procedures for the concepts being studied.
• Internal validity that refers to the relationship between the dependent and independent variables.
• External validity that is related with the generalization of the results to other populations.
Regarding Internal Validity, although the data used is secondary, the methods to retrieve and manipulate it were not used in order to cause errors or omissions. Therefore, the internal validity is confirmed.
Regarding External Validity, the usage of the conclusions of this study in other population is not under analysis and therefore, External Validity is not relevant in the context of this thesis.
On the other hand, Reliability is concerned with obtaining the same results for repeated measurements. It is all about consistency (Cargan, 2007). Reliability may be statistically tested using the Cronbach Alpha tests, which test specifically the internal consistency of the population.
30 Construct Cronbach's Alpha N of Items N of cases Customer Satisfaction final model 0,880204 7 1980
Quality Perception 0,883499 8 1996
Trust 0,85571 7 2070
Recommend the Company 0,879692 7 2794
Repurchase intention 0,858561 7 2787
Table 3-4 - Cronbach's Alpha tests results
Considering that a Cronbach test proves reliability if the result is above 0.5, the results for the different constructs are very good and definitively prove the internal reliability of the measurement. Finally, each analysis has a different number of cases due to the errors in the original data and their consequent removal from the analysis.
31
4
Results
4.1
Descriptive Statistics
The descriptive statistics are one way of analyze the data and verify if it matches the necessary parameters.
From the tables below, (the complete descriptive statistics are in Annex 1) it is possible to retrieve the following information:
• All variables scales vary from 1 to 5, as expected.
• The number of valid cases varies between variables. This is due to errors in the survey.
Therefore, only 1610 surveys are fully acceptable for all variables.
N Mean
Std. Deviation
Sat: Overall Account Management 2147 3,95 0,893
Agree: the Company solutions answer business challenges 2820 3,85 0,723
Recommend the Company 3047 3,82 0,922
Purchase Intention for the Company 3047 3,82 0,914
Sat: Overall Service Management 2279 3,79 0,838
Prod Sat: Meeting product needs 3013 3,78 0,756
Overall Satisfaction with the Company 3047 3,77 0,823 Agree: the Company is high quality organization 2825 3,77 0,801 Overall Sat Product & Solutions Portfolio 2997 3,77 0,732 Sat: Overall Technical Service Delivery 2102 3,76 0,852 Sat: Overall Service & Solution Performance 2078 3,75 0,781 Agree: the Company creates business value 2821 3,73 0,722 Agree: the Company is partner not supplier 2820 3,69 0,931
Sat: Overall Consulting Services 1970 3,64 0,768
Sat: Overall Project Management Service 2061 3,62 0,879 Sat: Overall Customer Support & Incident Management 2098 3,61 0,972
Choose the Company 1st time 3047 3,58 0,896
Prod Sat: Communication of portfolio and benefits 2999 3,56 0,812 Prod Sat: Innovation on product development 2990 3,52 0,793 Agree: the Company is easy to do business with 2812 3,44 1,012 Agree: the Company informs using high quality deliverables 2816 3,43 0,925
Agree: Trust in the Company 2828 3,41 0,847
32 Agree: the Company provides good value for money 2809 3,34 0,84
Sat: Overall Billing/Invoicing 1934 3,34 0,932
Sat: Overall Pricing 2105 3,26 0,859
Agree: the Company co-ordinates well internally 2815 3,05 1,089
Table 4-1 - Main Descriptive Statistics details
The One Way Anova results are the following:
Source of Variation SS df MS F P-value F crit Between Groups 3215,473189 26 123,6720457 165,3615816 0 1,495738 Within Groups 53329,69411 71307 0,747888624 Total 56545,1673 71333
Table 4-2 - Anova test results
4.2
Normality tests
As discussed in the last chapter, in order to guarantee the results of the inferential statistics, all variables have to be tested for Normality despite of the number of cases. The Normality tests used were Kolmogorov-Smirnov (Lilliefors Significance Correction) and Shapiro-Wilk tests.
The results are in Annex 2 and, as the significance of all tests is less than 0.05, the normality of the distributions is proved.
4.3
Correlation
As in the previous section normality of all variables was demonstrated; Pearson correlation may be used with no limitations. Following this, the correlation results were obtained using:
• Pearson correlation type
• Significance at 0.001
• Two tails test
Moreover, as expected, all variables are correlated, as the surveys are centric about Customer Satisfaction and Repurchase Intention.
33
4.3.1
Overall Customer Satisfaction
Overall Customer Satisfaction correlation with the other variables is presented in table 4-3. The most important fact is the correlation value between Overall Satisfaction and Recommend the Company being so high.
Variables Correlation
Values
Recommend the Company 0,71
Overall Sat Product & Solutions Portfolio 0,69 Agree: the Company is high quality organisation 0,65 Sat: Overall Service & Solution Performance 0,59
Prod Sat: Meeting product needs 0,58
Agree: the Company is easy to do business with 0,57 Agree: the Company co-ordinates well internally 0,57 Sat: Overall Technical Service Delivery 0,56 Sat: Overall Customer Support & Incident Management 0,55
Sat: Overall Service Management 0,55
Prod Sat: Ability to adapt products 0,54
Sat: Overall Account Management 0,52
Choose the Company 1st time 0,52
Agree: Trust in the Company 0,52
Agree: the Company informs using high quality deliverables 0,51 Agree: the Company is partner not supplier 0,49 Sat: Overall Project Management Service 0,48 Agree: the Company creates business value 0,47 Agree: the Company solutions answer business challenges 0,47
Sat: Overall Consulting Services 0,46
Prod Sat: Innovation on product development 0,46
Purchase Intention for the Company 0,45
Agree: the Company provides good value for money 0,44 Prod Sat: Communication of portfolio and benefits 0,42
Sat: Overall Pricing 0,34
Sat: Overall Billing/Invoicing 0,32
Table 4-3 - Overall Customer Satisfaction constructs correlation with other variables
4.3.2
Quality Perception
Quality Perception correlation with other variables is presented in table 4-4. Once again, the special highlight goes to the correlation with “Overall Customer Satisfaction”. This result was already expected, considering the analyses done on the literature review.
34
Variables Correlation
Values
Overall Satisfaction with the Company 0,65
Recommend the Company 0,65
Overall Sat Product & Solutions Portfolio 0,61 Sat: Overall Service & Solution Performance 0,59 Sat: Overall Customer Support & Incident Management 0,56 Agree: the Company co-ordinates well internally 0,56 Sat: Overall Technical Service Delivery 0,56
Agree: Trust in the Company 0,53
Sat: Overall Service Management 0,52
Agree: the Company informs using high quality
deliverables 0,52
Agree: the Company is easy to do business with 0,51 Agree: the Company creates business value 0,50
Choose the Company 1st time 0,50
Prod Sat: Meeting product needs 0,50
Agree: the Company solutions answer business challenges 0,49 Prod Sat: Innovation on product development 0,47 Agree: the Company is partner not supplier 0,47
Prod Sat: Ability to adapt products 0,47
Sat: Overall Account Management 0,44
Purchase Intention for the Company 0,42
Sat: Overall Project Management Service 0,42 Agree: the Company provides good value for money 0,42 Prod Sat: Communication of portfolio and benefits 0,41
Sat: Overall Consulting Services 0,40
Sat: Overall Billing/Invoicing 0,32
Sat: Overall Pricing 0,28
Table 4-4 - Quality Perception constructs correlation with other variables
4.3.3
Recommend the Company
Recommend the Company correlation with other variables is presented in table 4-5. Once again, the most important fact is the correlation value with Overall Satisfaction.
Variables Correlation
Values
Overall Satisfaction with the Company 0,71
Agree: the Company is high quality organization 0,65 Overall Sat Product & Solutions Portfolio 0,63
Choose the Company 1st time 0,62
35 Sat: Overall Service & Solution Performance 0,56
Purchase Intention for the Company 0,55
Prod Sat: Meeting product needs 0,54
Prod Sat: Ability to adapt products 0,53
Agree: Trust in the Company 0,52
Sat: Overall Service Management 0,52
Agree: the Company co-ordinates well internally 0,52 Agree: the Company is partner not supplier 0,52 Sat: Overall Customer Support & Incident Management 0,52
Sat: Overall Technical Service Delivery 0,52
Sat: Overall Account Management 0,51
Agree: the Company creates business value 0,50 Agree: the Company solutions answer business challenges 0,49 Agree: the Company informs using high quality deliverables 0,49 Agree: the Company provides good value for money 0,47 Prod Sat: Innovation on product development 0,47 Prod Sat: Communication of portfolio and benefits 0,44
Sat: Overall Project Management Service 0,42
Sat: Overall Consulting Services 0,41
Sat: Overall Pricing 0,37
Sat: Overall Billing/Invoicing 0,31
Table 4-5 - Recommend the Company constructs correlation with other variables
On the other hand, Recommend the Company is also related with the Quality Perception, which seems to be an obvious relationship: if customers consider that a company has quality, they will recommend it.
4.3.4
Trust
Trust correlation with other variables is presented in table 4-6. Regarding this variable, the most important fact is the lack of very high correlation values with other variables.
Variables Correlation
values
Recommend the Company 0,52
Overall Satisfaction with the Company 0,52
Agree: the Company is partner not supplier 0,50 Overall Sat Product & Solutions Portfolio 0,49 Sat: Overall Service & Solution Performance 0,45 Agree: the Company is easy to do business with 0,44
Choose the Company 1st time 0,44
Sat: Overall Customer Support & Incident Management 0,43 Agree: the Company creates business value 0,43 Agree: the Company provides good value for money 0,43