Application in the Insurance Industry
Building a Business Process to Generate and
Maintain an Automatic Estimation Agent
Miguel Pio Leal Henriques
Research Project submited
Instituto Superior de Estatística e Gestão de Informação
Universidade Nova de Lisboa
Customer Lifetime Value: A Framework for Application in the Insurance
Industry
Building a Business Process to Generate and Maintain an Automatic
Estimation Agent
Miguel Pio Leal Henriques
Research Project submited
as partial fulfilment for the Master Degree
in Statistics and Information Management
Supervisor: Fernando Bação, Phd
ACKNOWLEDMENTS
To the school, Universidade Nova de Lisboa - Instituto Superior de Estatística e Gestão de Informação and its faculty, for the excellence in teaching and contributing to the Nation’s progress.
I would like to express gratitude to my Supervisor, Professor Fernando Bação, for supporting this project. His immense knowledge and sense of practicability were very helpful in the development of this work. Thanks for the fascinating and interactive classes, they were a real joy.
To my Colleagues and Senior Managers for revealing and discussing many arts and trades of this business: Dra. Ana Luísa Simões, Dra. Ana Ferreira, Dr. Francisco
Ávila, Dr. João Nunes, Dr. João Maranga, Eng. Fernando Nunes, Dra. Teresa Barreira, Dr. António Marinho, Dr. Tiago Corrêa, Dr. Marcos Lopes, Dr. David Ribeiro and many others.
My sincere appreciation to my Company’s Board, Dr. Antonio Varela Afonso, Dr. Eduardo Palhares and Eng. Lino Afonso, for supporting and financing this learning adventure. Working on one of the best Companies in the market is challenging,
nevertheless the organizations is being a real school for me. A nod also goes to Mónica Silva for easing the logistics and red-tape between all parties.
My gratitude also goes to Dr. João Pedro Borges for its enthusiasm and challenging mind that re-energized my interest for many disciplines and for the
interesting and demanding projects I’ve been challenged for, one of them is in the roots of this research work.
ABSTRACT
In recent years the topic of Customer Lifetime Value (CLV) or in its expanded
version, Customer Equity (CE) has become popular as a strategic tool across several
industries, in particular in retail and services. Although the core concepts of CLV modelling have been studied for several years and the mathematics that underpins the concept is well understood, the application to specific industries is not trivial. The complexities associated with the development of a CLV programme as a business process are not insignificant causing a myriad of obstacles to its implementation. This research project builds a framework to develop and implement the CLV concept as maintainable business process with the focus on the Insurance Industry, in particular for the nonlife line of business. Key concepts, as churn modelling, portfolio stationary premiums, fiscal policies and balance sheet information must be integrated into the CLV framework. In addition, an automatic estimation machine (AEM) is developed to
standardize CLV calculations. The concept of AEM is important, given that CLV information “must be fit for purpose”, when used in other business processes. The field work is carried out in a Portuguese Bancassurance Company which is part of an
important Portuguese financial Group. Firstly this is done by investigating how to translate and apply the known CLV concepts into the insurance industry context. Secondly, a sensitivity study is done to establish the optimum parameters strategy. This is done by incorporating and comparing several Datamining concepts applied to churn
prediction and customer base segmentation. Scenarios for balance sheet information usage and others actuarial concepts are analyzed to calibrate the Cash Flow component of the CLV framework. Thirdly, an Automatic Estimation Agent is defined for
RESUMO
O tema do valor embebido do Cliente (Customer Lifetime Value ou CLV), ou na sua versão expandida, valoração patrimonial do Cliente (Customer Equity), adquiriu alguma relevância como ferramenta estratégica em várias indústrias, em particular na Distribuição e Serviços. Embora os principais conceitos subjacentes ao CLV tenham sido já desenvolvidos e a matemática financeira possa ser considerada trivial, a sua aplicação prática não o é. As complexidades associadas ao
desenvolvimento de um programa de CLV, especialmente na forma de Processo de Negócio não são insignificantes, existindo uma miríade de obstáculos à sua
implementação.
Este projecto de pesquisa desenvolve o enquadramento de adaptação,
actividades e processos necessários para a aplicação do conceito à Industria de Seguros, especificamente para uma empresa que actue no Sector Não Vida. Conceitos-chave, como a modelação da erosão das carteiras, a estacionaridade dos prémios, as políticas fiscais e informação de balanço terão de ser integrados no âmbito do programa de modelação do valor embebido do Cliente. Um dos entregáveis será uma “máquina automática de estimação” do valor embebido, essa ferramenta servirá para padronizar os cálculos do CLV, para além disso é importante, dado que a informação do CLV será utilizada noutros processos de negócio, como por exemplo a distribuição ou vendas.
INDEX
ACKNOWLEDMENTS ... I ABSTRACT ... III RESUMO ... V INDEX ... VII TABLE INDEX ... XI FIGURE INDEX ... XII ABREVIATION LIST ... XIV ACRONYMS LIST ... XV TERMS DEFINITION ... XVI
1. INTRODUCTION ...1
1.1. Research Work Rationale ...2
1.2. Research Questions ...2
1.3. Research Objectives ...3
1.4. Hypothesis ...3
1.5. Research Paradigms ...4
1.6. Overview of used Research Methods ...4
1.7. Incorporation of Knowledge...5
1.8. Field Work Location ...6
1.9. The role of the researcher ...6
1.10. Assumptions ...6
1.11. Limitations and Delimitations ...7
1.11.1. Delimitations ...7
1.11.2. Limitations ...7
1.12. Conclusions about the basis of this work ...8
2. METHODOLOGY ...9
2.1. Overview of Research Work Flow and Project Phases...9
2.2. Phase 1 – Understanding CLV Concept...9
2.3. Phase 2 - Expansion into the Insurance Context ... 10
2.4. Phase 3 –Estimator Determination ... 10
2.6. Conclusions on Methodology ... 11
3. UNDERSTANDING CUSTOMER LIFETIME VALUE ... 12
3.1. Introduction to Literature Review... 12
3.2. Bootstrap concept ... 12
3.3. Keywords... 13
3.4. Search Equations... 13
3.5. Phase 1 – Understanding CLV ... 14
3.5.1. Brief definition of CLV ... 15
3.5.2. Customer Equity ... 17
3.5.3. The importance of CLV and Customer Equity CE ... 18
3.5.4. Relation between CLV/CE and Customer Lifecycle ... 19
3.5.5. Different Approaches to CLV/CE Modelling... 21
3.5.5.1. The RFM model ... 21
3.5.5.2. Past Customer Value ... 22
3.5.5.3. Advantages of CLV methods ... 23
3.5.5.4. Aggregate CLV Approaches ... 24
3.5.5.5. Individual CLV Approaches ... 25
3.5.5.6. Mixed Strategies for CLV calculation ... 26
3.5.6. CLV Parameters ... 30
3.5.6.1. Discount Rate ... 30
3.5.6.1.1 Weighted Average Cost of Capital ... 31
3.5.6.1.2 Capital Asset Pricing Model ... 32
3.5.6.1.3 Discount Rate Analysis ... 33
3.5.6.2. Churn Ratio ... 34
3.5.6.3. Cash Flow Variations ... 35
3.5.7. The role of Datamining ... 35
3.5.8. Hurdles in CLV/CE application ... 38
3.5.9. Complexity versus performance ... 39
3.5.10. Business Process Integration and Systems ... 39
3.6. Literature Review Conclusions ... 42
4. EXPANSION INTO INSURANCE INDUSTRY... 43
4.1. Focus Groups – The CLV Project Birth ... 43
4.2. The Importance of the Workgroup ... 44
4.3. Workgroup Structure... 44
4.4. Framework Development Strategy Summary ... 46
4.5. Data Used in the Project ... 47
4.5.1. Sample Size ... 47
4.5.2. Data Structures ... 47
4.5.3. Information subjects ... 48
4.6. Discount Rate for the Insurance Company ... 49
4.7. Retention Rate ... 50
4.7.1. Aggregate Churn Rate ... 51
4.7.2. Individual Churn Rate ... 52
4.7.3. Retention Rate and the Average life of a Policy ... 53
4.8. Present Value Function ... 55
4.9. A note on experimentation ... 57
4.10. The Cash Flow Parameter ... 59
4.10.1. Structural Cash Flow Variations ... 59
4.10.1.1.Indexation and devaluation ... 60
4.10.1.2.Bonus-Malus System in Auto Insurance ... 60
4.10.1.3.The Stationarity Function ... 62
4.10.2. External Cash Flow Variations ... 64
4.10.2.1.Soft markets ... 64
4.10.2.2.Transparent Market ... 65
4.10.3. Study of the Cash-In Aggregate Variations ... 65
4.10.4. Study of the Cash-Out Aggregate parameters ... 66
4.10.4.1.Claims ... 66
4.10.4.2.Other aggregate Cash-Out parameters... 67
4.11. Balance Sheet Information Integration ... 67
4.12. Product CLV Integration Strategy and CF Parameters ... 68
4.13. The Project CLV Formula ... 69
4.14. Data Mining Modelling ... 71
4.14.1. General methodology ... 72
4.14.2. Model Design ... 72
4.14.3. Response Variables Definition ... 73
4.14.4. Datamining Algorithms ... 74
4.14.5. Datamining Model Workflow ... 74
4.14.6. Datamining Tool ... 76
4.14.7. Datamining Model Results ... 76
4.15. Conclusions on expansion into insurance industry ... 79
5. MODEL APPLICATION AND RESULTS ... 80
5.1.1. Impact on valuation ... 81
5.1.2. Impact on Segmentation ... 83
5.1.3. Impact on the Distribution Process ... 84
5.2. Integration into Business Operations ... 85
5.2.1. Strategic Level ... 85
5.2.2. Tactical Level ... 85
5.2.3. Operational Level - Usage ... 85
5.2.5. Master Data vs. Datamart ... 88
5.2.6. Communication and Change Management Issues ... 89
5.2.1. Naïve Model ... 89
5.2.2. Quantile Ranking ... 90
5.2.3. Service and Process matching... 91
5.3. Conclusions on Model Results and Business Impact ... 91
6. RESEARCH CONCLUSIONS ... 93
7. FURTHER INVESTIGATION ... 96
7.1. Data Setting and CLV Model ... 96
7.2. Datamining Models ... 96
7.3. Business Processes ... 97
REFERENCES... 98
ANNEXES ... 102
A1 - EXAMPLE OF A STRATEGY MAP ... 104
A2 - DISCOUNT RATE SENSITIVITY ON CASH FLOW ... 105
A3 - PRESENT VALUE FUNCTION REFERENCE TABLE ... 106
A4 - BMS TRANSITION MATRIX ... 107
A5 - PRODUCT MAXIMAL TABLE ... 108
A6 - CUSTOMER DESCRIPTIVE STATISTICS ... 109
A7 - EXAMPLE OF DECISION TREE ... 112
A8 - COMPANY’S AGGREGATE CHURN RATE ... 113
A9 - EXAMPLE OF PRODUCT BALANCE SHEET ... 114
A10 - MODEL ACURACY STATISTICS... 115
A11 - MODEL LIFT CHARTS ... 117
A12 - THE CRISP-DM PROCESS ... 119
A13 - THE PLV FUNCTION IMPLEMENTATION ... 120
TABLE INDEX
Table 1.1.Research paradigms ...4
Table 1.2.Research Methods used in the project ...4
Table 3.1.Search equations ... 13
Table 3.2.Mixed Approaches ... 28
Table 3.3. Some Datamining algorithms ... 36
Table 4.1.Project Workgroup ... 44
Table 4.2. Framework Development strategy summary ... 46
Table 4.3. Sample Structure ... 47
Table 4.4. Cash Flow Estimation Strategy ... 59
Table 4.5. Average Premium Variation (“Closed” Portfolio) ... 66
Table 4.6. Product CLV Integration Strategy Matrix ... 68
Table 4.7. Product Cash-Flows Parameters ... 69
Table 4.8. Datamining Model Results for Churn ... 77
Table 5.1. Two Visions on Value ... 81
Table 5.2. Impact on portfolio value rank when using CLV ... 84
Table 5.3. Surrogate Multipliers for CLV ... 89
Table 4.12. Quantile Ranking of CLV ... 90
FIGURE INDEX
Figure 1.1. Knowledge Network ...5
Figure 2.1. Research Work Flow ...9
Figure 2.2. Automatic Estimation Machine Architecture - AEM ... 11
Figure 3.1. The Past and Future Customer Value ... 16
Figure 3.2. Customer Lifecycle ... 19
Figure 3.3. CLV Value Chain ... 20
Figure 3.4. The Customer as an Investment. ... 23
Figure 3.5. Mixed Strategies – Different concurrent approaches ... 27
Figure 3.6. Mixed strategies for CLV/CE estimation – Proposed Hybrid Solution... 29
Figure 3.7. Discount Rate Long term Effect on Cash Flows ... 33
Figure 3.8. Long term Effect of Discount Rate on Present Value - Accrued ... 34
Figure 3.9. Role of Datamining in CLV frameworks ... 37
Figure 3.10. CPM - Framework ... 40
Figure 3.11. CRM Systems - Framework ... 41
Figure 4.1. Sample Product Structure ... 48
Figure 4.2. Individual Retention Rate Estimation Example. ... 53
Figure 4.3. Average Policy Life vs. Erosion Rate ... 54
Figure 4.4. Present Value Function ... 56
Figure 4.5. CF Table generated in Excel for testing purposes. ... 58
Figure 4.6. The BMS premium vector, Level vs. Premium multiplier ... 61
Figure 4.7. Evolution of the Average Premium in the BMS ... 61
Figure 4.9. Global Claim Frequency ... 67
Figure 5.1. CRIP-DM Methodology ... 72
Figure 5.2. Model Design Construct ... 73
Figure 5.3. Standard DataMining Work Flow for the Project ... 75
Figure 4.12. Distribution of Churn probability classes for each product ... 78
Figure 5.1. Scatter Plot – Premium vs. CLV ... 80
Figure 5.2. Leverage between premiums and PLV ... 82
Figure 5.3. Distribution between Customers and Value ... 83
Figure 4.16. Distribution on portfolio value rank when using CLV ... 84
Figure 5.5. Automatic Estimation Agent Architecture ... 86
ABREVIATION LIST
Citation - Citation Databases
GS - Google Scholar DMine – Datamining
DM - datamart
DW - Data Warehouse ML – Machine Learning
FC – Financial Calculus
CE – Customer Equity
WoS - Web of Science LoB – Line of Business
CoC – Cost of Capital
ACRONYMS LIST
AEM – Automatic Estimation Machine
BMS – Bonus-Malus System
BPM – Business Process Management
BPE – Business Process Engineering
BSC - Balanced Score Card
CLV/CLTV – Customer Lifetime Value
PLV – Policy Lifetime Value
PCLV – Past Customer Lifetime Value
FCLV – Future Customer Lifetime Value
SOA – Service Oriented Architecture
CRM – Customer Relationship Management
RFM – Recency, Frequency, Monetary
CLM – Customer LifeCycle Management
SEMMA – Sample, Explore, Model, Modify, Assess
TERMS DEFINITION
Bancassurance – This term refers to the business model where a bank and an insurance company coordinate a partnership where typically the insurance company uses the bank sales channel in order to push insurance products. It is very popular in Europe especially in France where the term was coined.
Process – This term, in a business context, identifies the set of activities or actions carried out by one or several entities to achieve the completion of some product or service.
Master Process – A Master Process aggregates related processes that operate and concur to the same purpose.
Strategy Map - A strategy map is a diagram used to express the main goals of an organization or team. Usually it is a document associated with the balanced scorecard methodology and its objective is to facilitate the discussion and design of the
organization’s strategy. Usually they show: a) Just the key Strategic objectives in the form of geometric shapes; b) Causal relationships between the objectives using arrows that can be differentiated by the strength of effect.
Uniform Policy – A uniform policy is the draft policy Framework approved by the national regulator, (e.g. ISP – Instituto de Seguros de Portugal) that dictate the
1.
INTRODUCTION
"The whole is different from the sum of its parts" Aristotle in his work Metaphysics
Can a top manager have this holistic view when he looks to his Company balance sheet? How can he explain the results whenever they’re good or bad? Modern commercial organizations obviously have interest in maximizing their returns but are also a complex set of interconnected processes and activities that form the
1.1. Research Work Rationale
The motivation to develop this research work appeared, to the author, as real a business case in the corporation he is working in. The problem was presented in this fashion: “We recognise the importance of the CLV concept, as an insurance company operating in a complex and competitive market, it should be implemented since it may provide better financial results”. The subject matter is considered strategic, not only by the board but also by several managing directors. It is recognised that the concept behind CLV would have impact in a number of business processes and offer in the medium to long term a real edge over the competition. One of the main focus ideas is the potential future profitability may have a real impact in today’s decisions. Of course maximizing profitability should be the objective function, but the process of identifying and modulating value with an eye in each customer is accepted to be a stronger and resilient foundation for business expansion. During the preliminary investigations to set up an internal project it was noticeable that, although there was some literature about the CLV methodology and its principles, there wasn’t evidence of a clear approach or solution for its usage, especially in the insurance context, in a sustainable and practical way. This situation reveals some degree of knowledge gap between what is wanted (using CLV) and what is the common understanding and practice in the industry. That knowledge gapmay be closed a little further trough this work and expand the knowledge using a specific business case plus a engineering perspective and define a project with a more robust methodological and academic support.
1.2. Research Questions
The implementation of this project will address the following two research questions and related sub-questions:
1.2. What are the main critical factors that influence CLV?
1.3. How can the CLV be applied with insurance parameters and data? 1.4. What is the best CLV estimator for insurance?
1.5. How to measure CLV impact in the insurance business?
2. How can we integrate CLV into the Insurance Business Operations? 2.1. How to build an Automatic Estimation Machine?
2.2. How to expand the AEM effectiveness with SOA?
2.3. How to engineer a Business Process to support the CLV and AEM?
1.3. Research Objectives
There are two research objectives that can be satisfied from the research questions:
a) The first one is to understand the concept of Customer Lifetime Value (CLV) and how can it be, in the reasonable way, applied in the Insurance Industry grounded in quantitative studies that will be further detailed in the research design section.
b) The second is a practical and pragmatic one which is the definition of framework for a business process for the CLV application in a corporate environment in the context stated in the previous point. This framework must inform quantitatively the process owners about its continuous effectiveness.
1.4. Hypothesis
1.5. Research Paradigms
The research paradigms used to achieve the research objectives and answer the research question are listed in the following table.
Table 1.1.Research paradigms
Source: Based on the research Onion hierarchy (Saunders, Lewies, Thornhill, 2007)
1.6. Overview of used Research Methods
The following table summarizes the research methods used in this research work. Further development will be given in the Methodology Chapter.
Table 1.2.Research Methods used in the project
Paradigm Choice
Philosophy Pragmatism
Approach Deductive
Strategy Experiment
Choices Multi Method
Time Horizon Cross Sectional
Techniques and Procedures Applied Research via Project Development => Research Methods + Formal Project Management => Literature Review, Hypothesis Formulation, Data Collection, Testing and Prototype Deployment
Topic Research Method Used
Relevance of the Topic Qualitative questionnaires with key people Literature Review
Understanding the CLV concept, how can it be calculated and what
Actuarial Sciences
Data Visualizat
ion
Statistics
Machine Learning Computer Sciences Financial
Calculus
Customer Lifetime
Value
Source: The Author
1.7. Incorporation of Knowledge
From the knowledge management perspective during the development of the project there is incorporation of knowledge from several areas of science and
technology. The relation between the several knowledge areas is shown in Figure 1.1.
Figure 1.1. Knowledge Network Source: The author
Expansion of CLV Concept into
the Insurance Context Quantitative Data Collection Literature Review Experimentation
Focus Groups
Finding the Optimum Estimator Quantitative Data Collection Experimentation
Focus Groups
Business Integration Experimentation + Prototyping
Focus Groups
New Business
Analytics & Processes
practices in a Specific
Context Expected Knowledge
1.8. Field Work Location
The research work will be developed in a specific Portuguese Bancassurance Company integrated in a Portuguese financial Group.
1.9. The role of the researcher
The researcher is responsible for an Information Management Department on the Researched Company. Its role is supporting and developing BI and Analytical activities in the Company, crossing the gap between IT and the rest of the business. In this project, leaded by the CFO, the researcher:
Investigated the concept of CLV;
Investigated and applied datamining algorithms; Did some model sensitivity analysis;
Did the programming and data management;
Participated in the project meetings and discussions.
Other assumptions were discussed between the workgroup members and other business areas.
1.10. Assumptions
There is an important assumption that this research work does, which is the possibility of replication and applicability of a framework into a whole industry from the work developed in a very specific context. In the defence of this approach we must consider the following principles:
national context. For example, all Portuguese insurance companies must be compliant with the future, European Union’s Solvency II framework which enforces risk adjusted capital allocation under strict conditions and uniform market disclosure. This condition translates into uniform behaviours, product solutions and strategies across companies. Moreover, adding years of
competition, fusions and acquisitions we may assume similar environments for the applicability of a CLV framework.
b) The theory of insurance is relatively uniform, not only at national level but also worldwide;
c) Whenever possible generalisation considerations will be made based on relevant scientific and technical literature;
1.11. Limitations and Delimitations
1.11.1. Delimitations
The research work has a clear delimitation since the CLV concept will only be studied for application on the Non-life line of business. The difference between the types of products, non-life vs. the life is such that the supervisory authorities require that the companies must specialized in only one of these two lines of business. If one Group want to explore life and non-life LOB’s that is only permitted with legally and statutory independent companies, of course this separation extends into the assumptions about CLV calculation and usage.
1.11.2. Limitations
only be tested by a wider research scope by including a larger number of firms in the qualitative and quantitative part of the experiments. That scope is in the present context difficult to achieve since the current researcher, as a worker in a specific Insurance Company, cannot be positioned as a neutral entity with equal research opportunities in different firms.
1.12. Conclusions about the basis of this work
2.
METHODOLOGY
2.1. Overview of Research Work Flow and Project Phases
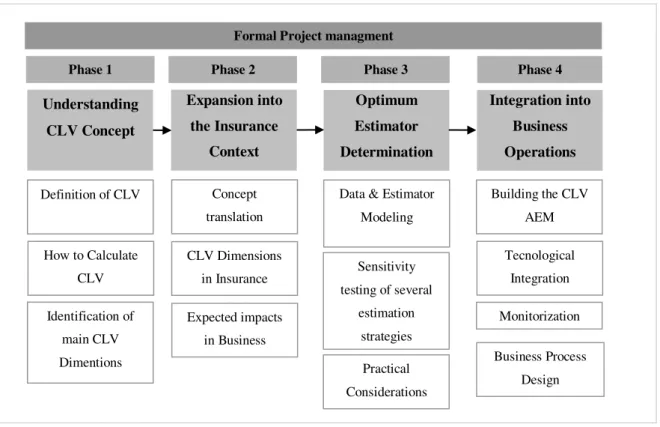
As an overview the research project is divided in four phases governed by formal project management. Some, but not all, key topics are pointed out in Figure 2.1.
Figure 2.1. Research Work Flow
Source: The author
2.2. Phase 1 – Understanding CLV Concept
The first phase of the project is dedicated to build the theme theoretical
foundation. This objective is achieved by literature review with emphasis in two areas: Understanding CLV Concept Expansion into the Insurance Context Optimum Estimator Determination Integration into Business Operations
Definition of CLV
How to Calculate CLV Identification of main CLV Dimentions Concept translation
Building the CLV AEM Tecnological Integration Business Process Design CLV Dimensions in Insurance
Data & Estimator Modeling
Sensitivity testing of several
estimation strategies
Monitorization
Phase 1 Phase 2 Phase 3 Phase 4
Expected impacts in Business
Formal Project managment
Estimation Models and Application in commercial environments. For the estimation models there are key issues to check like what are the typical approaches used in CLV methodologies. In parallel some research about the expectations over the potential qualitative and quantitative impact on the business will be done. This is an important issue since the business will be the operator of the tools that will be created through this research project the deliverables must be accepted by people and integrated into the business operations. This research can be developed by using questionnaires issued to key managers.
2.3. Phase 2 - Expansion into the Insurance Context
The objective of this phase is translating the knowledge obtained during the first phase into the insurance context. This will be done mainly by experimentation and discussion using focus groups with technical personnel. During this phase two research problems must be addressed:
Significant parameters must be identified;
The most appropriate modelling approach must be selected.
These two problems define the business frame and requirements for CLV usage.
2.4. Phase 3 –Estimator Determination
With the business frame as the reference, the project enters in its wider phase where, through experimentation, the estimator (or collection of estimators) will be determined. To achieve that objective there are four main activities:
Data collection & Data modelling;
Application of algorithms for parameter estimation. It is implied the usage of a machine learning methodologies for testing several concurrent modelling techniques;
CLV model design and assessment.
2.5. Phase 4 - Integration into Business Operations
The final phase of the research work is prototyping a framework architecture which objective is supporting consistently a business process for CLV application. In figure 2.2 it is presented a simplified version of the framework.
Figure 2.2. Automatic Estimation Machine Architecture - AEM Source: The author
2.6. Conclusions on Methodology
Although the research methodology is grounded on literature review there is a great deal of experimental and engineering work evolved, especially on the third and fourth project phases. Formal project management is referred, but nothing is said about what kind of PM methodology will be used. Previous knowledge on the Organization indicates an Agile approach. Having this academic work, with the aforementioned phases, running along with the on situ project will bring together the best of both worlds.
Model for Cash Flow Estimation
Business Framework Model for Churn
Prob. Estimation
CLV Agregator
SOA
Busines Processes
Datamart
3.
UNDERSTANDING CUSTOMER LIFETIME VALUE
3.1. Introduction to Literature Review
Having the objective of identifying a framework to operate on a business, this research integrates conceptual and empirical work from several knowledge areas and backgrounds, namely: marketing, customer relationship management, actuarial sciences, financial calculus and machine learning.
To keep this review manageable it will be organized in sections that reflect the research workflow and phases. Starting by understanding the relevance of the
research theme, Customer Lifetime Value, the research will then focus on the
application of the concept on the insurance industry, in this phase insurance concepts will be researched for potential application in the CLV framework. In the third phase the focus will be directed onto the application of techniques and methods for estimating CLV. Lastly, the fourth phase will address the framework integration and interaction with other business processes.
To prepare the overview process the following section will illustrate the method of discovering relevant literature. Which is: with a bootstrap concept identify its
elemental parts and then assemble an appropriate search equation for literature search in scientific databases like WoS. Some degree of triangulation with the insurance industry is also made to check the level of research maturity in that specific area.
3.2. Bootstrap concept
0
(
1
)
)
(
t t t id
t
r
CF
CLV
(1)Where for each customer i
CLV is the Customer Lifetime Value
CF is the net cash flow per period (t)
r is the retention rate for period (t)
d is the discount rate
From the equation (1) its clear that there are three fundamental concepts we must study to understand CLV which are by order of importance: a) retention rate over time (or churn); b) net cash flow over time; c) discount rate. Since discount rate is a collinear concept we’re left with the first two parameters for further investigation. With that in mind the following concepts: Insurance; Churn, CLV will define the keywords and search equations as shown in the following sections.
3.3. Keywords
Customer profitability; Customer Lifetime Value; CLV; CLTV; Customer Equity;
Churn; Customer Retention; Survival Analysis; Insurance; Bancassurance.
3.4. Search Equations
Table 3.1.Search equations
Search Set
Concept
Equation # of
Results
#7 (#4 or #5)
and #3
(Churn Refined Or CLV Refined) and Insurance. We want the union of the intersection of the set
“insurance” and “CLV” with “Churn” and “Insurance” so
These search equations will define the core research documentation set. Further documentation outside this boolean equation will be added as needed.
3.5. Phase 1 – Understanding CLV
The objective of the following sections is the review of the central concepts behind CLV. It is not an in depth review of every method or approach that have been proposed in this area, the intention is to build a reasonable understanding of CLV adequate enough to support the project phases planned for this research work.
the expression must be “ored together”. The reason is
the need to investigate the phenomena of Churn in insurance independently of CLV in insurance.
#6 #4 or #5 Churn Refined Or CLV Refined 501
#5 CLV
Refined
TS=("lifetime*customer*value") or TS=(CLV) or TS=(LTV) or TS=(LCV) or TS=("customer equity") or TS=("Customer Life*time Value") or TS=("lifetime value") or TS=(CLV-models) or TS=("customer
profitability") or TS=("CLTV") AND Language=(English) Refined by: Subject Areas=( BUSINESS OR MATHEMATICS, APPLIED OR MANAGEMENT OR COMPUTER SCIENCE, ARTIFICIAL INTELLIGENCE OR COMPUTER SCIENCE, INFORMATION SYSTEMS OR COMPUTER SCIENCE, THEORY & METHODS OR
TELECOMMUNICATIONS OR COMPUTER SCIENCE,
INTERDISCIPLINARY APPLICATIONS OR BUSINESS, FINANCE ) AND Subject Areas=( BUSINESS OR MANAGEMENT OR
COMPUTER SCIENCE, ARTIFICIAL INTELLIGENCE )
322
#4 Churn
Refined
TS=(churn*) and (TS=(model*) or TS = ("survival analysis") or TS=(analysis)) AND Language=(English) Refined by: Subject Areas=( BUSINESS, FINANCE OR COMPUTER SCIENCE, ARTIFICIAL INTELLIGENCE OR OPERATIONS RESEARCH & MANAGEMENT SCIENCE OR
MANAGEMENT OR COMPUTER SCIENCE, SOFTWARE ENGINEERING OR BUSINESS OR ECONOMICS OR COMPUTER SCIENCE,
INTERDISCIPLINARY APPLICATIONS OR COMPUTER SCIENCE, CYBERNETICS OR MATHEMATICS, INTERDISCIPLINARY APPLICATIONS )
190
#3 Insurance TS=(insurance) or TS=(Bancassurance) 48816
#2 Churn TS=(churn*) and (TS=(model*) or TS = ("survival
analysis") or TS=(analysis))
712
#1 CLV TS=("lifetime*customer*value") or TS=(CLV) or
TS=(LTV) or TS=(LCV) or TS=("customer equity") or TS=("Customer Life*time Value") or TS=("lifetime value") or TS=(CLV-models) or TS=("customer profitability") or TS=("CLTV")
3.5.1. Brief definition of CLV
From common sense it’s apparent that each individual Customer has an impact on the overall firm financial results as described on Glady, N., Baesens, B., & Croux, C. (2009b) work on modelling churn using customer lifetime value. Therefore the firm results are the emerging reality of all Customer contributions, each one different from each other and implying different economic valuations. Decision makers and
researchers recognising the opportunity and importance of that idea for managerial purposes have shaped formulations to capture each contribution and operate over the customer base during its lifetime. Thus the denomination of this idea as CLV - Customer Lifetime Value, the basic CLV model is defined as the total discounted lifetime cash flows generated by the customer, some authors have summarized this concept giving us the following definition:
CLV represents the present value of the expected benefits less the costs of initializing, maintaining and developing the customer relationship (Malthouse and
Blattberg, 2005). Different academics explore the CLV concept (Dwyer, 1997; McDougall et al., 1997; Berger and Nasr, 1998; Jain and Singh, 2002; Mason 2003;
Stahl et al., 2003), which can be summarized as the sum of accumulated cash flows of
a customer over their entire lifetime with the organization. (De Oliveira Lima, E.
(2009) Domain knowledge integration in data mining for churn and customer lifetime value modelling: new approaches and applications - Page 8)
Although in almost every serious business the past commercial records are useful and frequently are used to build traditional customer performance metrics, that information has a relative importance since it is used essentially to build what is called the Past Customer Value. This view can be distorted, mainly because it assumes the same Customer behaviour for the future, it doesn’t incorporate other useful information about the long term potential. For example, an insurance customer had in the first relation year a loss, most likely this Customer is in the red, does that mean this is a bad
Contrary to the past Customer Value, CLV concept is essentially prospective, it looks into the future therefore it is a more powerful concept and simultaneously a moreuseful tool for decision making since it works as an influencer over the short term managerial decisions taking into account the long term effect of each Customer contribution. In the past Customer history lays the information needed to learn, estimate and adjust the parameters to calculate the future or potential value of Customers.
Figure 3.1. The Past and Future Customer Value
Source: The Author
For the future Customer value, since we may be considering large time spans the problem of estimating the probability of occurrence of those cash-flows is central. This implies not only the estimate of how future costs and revenues will vary but also the estimation of the customer retention probabilities as noted by Gupta, S. (2009). Another concept emerged from the research around CLV as described by Wiesel, T., Skiera, B. & Villanueva, J. (2008) on their work on Customer Equity. This concept connects the Customer Lifetime Value to the firm financial results which is a more extensive concept than CLV.
Balance between Observed Acquisition, Maintenance Costs & Revenue
Past Future
Past Customer Value Future Customer Value => CLV
3.5.2. Customer Equity
Customer Equity (CE) is the approach where the connection between CLV and the firm value is taken into account. Customer’s relations are seen as assets and
customers are the drivers of revenues. In a more holistic view CLV can be integrated in a set of strategies and processes geared to generate economic value to the firm’s
stakeholders. Mathematically CE can be considered the sum of the individual CLV for all firm customers as shown in the next formula.
01
(
1
)
)
(
t t t N id
t
r
CF
CE
(2)A more particular formula includes the discrimination of different lines of business, considering that each customer may have more than one of the firm’s products.
N i L l t t l ltd
t
r
CF
CE
1 1 0
(
1
)
)
(
(3)
Where
CE is the Customer equity
CF is the net cash flow per period (t) and line of business (l)
r is the retention rate for period (t)
d is the discount rate
N is the total number of Customers
L is the total number of Products
3.5.3. The importance of CLV and Customer Equity CE
The importance of CLV is intrinsically connected with the commitment with the management of Customer Equity or in other word the Customer base. Given the
importance to create value to the firm stakeholders all the processes related with the customer relation and its impact on value must be assessed. Managing Customer Equity, since not all customers are equal, entails the concept of Customer prioritization. As noted by Rust, R. T., Lemon, K. N. & Zeithaml, V. A. (2004) and Abele, Karin P. N. (2009), firms sponsoring CE management strategies develop some or all of the following activities:
a) Choosing the customers with greater CLV and nurturing them while
“deselecting” the lower CLV customers as a strategy to increase profitability for the firm by:
o having a finer and profitable pricing policy; o increasing investment only in key areas;
b) Since not all customers are equally profitable, CLV is a good metric to reallocate scarce resources within the organization by:
o Create new products or services intended for special and more profitable segments;
o Close services or abandon products;
c) As a side effect of CLV programmes is the ability for the organization to continually assess the customer development strategies;
d) Customer satisfaction is potentiated, thus having them as good market referees for the firm. This could have a good impact in acquisition costs;
3.5.4. Relation between CLV/CE and Customer Lifecycle
Customer Lifecycle Management is a set of Processes with the objective of managing key moments in the relation between a firm and a Customer. Managers and Marketers usually make reference to the following events: a) Acquisition; b) Service; c) Expansion; d) Termination. From the interoperability between the CLV as a tool and the Customer Lifecycle Process emerges the opportunity to leverage the Customer Equity. In Figure 3.2 it is depicted a version of this approach where 10 CLM events are referred.
Figure 3.2. Customer Lifecycle
Source: McKinsey & Company
1. Reducing costs on creating interest 2. Reducing costs for Acquisition 3. Increasing recurring revenue 4. Reducing the direct costs to serve 5. Increasing cross and Up-sell 6. Increasing renewal
7. Reducing cost of migration 8. Reducing churn
9. Limiting risk of bad debt 10.Reducing costs to win back
These concepts can be seen as a value chain, shown in Figure 3.3., of processes which the ultimate aim is to maximize the value creation for its stakeholders:
Customers, Employees and Shareholders.
Figure 3.3. CLV Value Chain
Source: The Author
Having described the macro context of CLV and CE in the business arena, the following sections will focus on the different methodologies and approaches proposed by several authors for calculating CLV. The understanding of these approaches will be important for a more adequate methodology to develop Phase 2 and 3 of this research work.
CLV Estimation
and Customer
Prioritization
Customer
LifeCicle
Managment
Impact on
Customer
Equity
Stakeholder
Value
3.5.5. Different Approaches to CLV/CE Modelling
Some researchers like Gupta, S., Hanssens, D., Kahn, W., Kumar, V., & Lin, N. (2006, Nov.), have done systematizations of methods for Customer Valuation and segmentation. Often more traditional methods are compared with CLV methodology therefore we have the following indicative taxonomy:
Traditional Methods
RFM - Recency Frequency Monetary Past Customer Value
Newer Approaches
CLV – Customer Live Time Value Aggregated Approaches
Individual Approaches Mixed Approaches Probability Models
In this review only a very small number of methodologies will be described in more detail, for a more in depth study of these methodologies it is advisable to consult the authors referred in the beginning of this section.
3.5.5.1.The RFM model
This model is based in quintile binning of three variables R – Recency, how long the customer is registered, F – Frequency, how many times the customer made
Although very simple and cost effective, RFM models tend to be more limited since the method only incorporates, by definition, three variables binned to a set of fixed clusters. The method only integrates the past performance and assumes coarsely equal performance for the future. There isn’t also an individual economic or equity value attributed to each Customer, so there is some kind of “qualitative” feature in this kind of models.
3.5.5.2.Past Customer Value
In this method, PCV, it is assumed that the past Customer behaviour is an indicator of future Customer behaviour. The PCV is calculated considering the total sum of revenue of past transactions adjusted to present value. The PCV can be calculated with the following formula.
Tt
t t
i
CF
d
PCV
0
)
1
(
(4)Where
PCV is the Customer Past Value
CF is the net cash flow per period (t)
d is the discount rate for actualization
T is the total number of time periods before the present
3.5.5.3.Advantages of CLV methods
Unlike traditional methods, CLV approaches take in account the probability of the customer being active in the future therefore having a potential to generate revenue. This analysis can be applied to the customer a whole entity or just to part of its product portfolio. The Customers with a higher probability of being active for a longer time, with positive revenue for the firm, will have a bigger present value. Given that the firm wants to maximise future profitability, the capability to prioritize the right customers is fundamental. Another aspect taken in account is the incorporation of future acquisition and maintenance costs in a view comparable to an investment. In this view, after an initial negative CLV associated with acquisition costs there will be a break even point where revenues will payoff the Customer variable and fixed costs, see Figure 3.5.
Figure 3.4. The Customer as an Investment.
Source: http://www.mrdashboard.com/Break-even_Analysis.html
TR: Total Revenue which is calculated as number of products sold times unit price;
TVC: Total Variable Cost which varies directly with transactions
TR = Unit Price x Transactions
TC = TFC + TVC
P: Profit is calculated as total revenue minus total cost P = TR –TC
3.5.5.4.Aggregate CLV Approaches
In aggregate approaches the calculation of CLV e done with at the level of a segment or even considering the firm as a whole. The following formula states one aggregate approach to calculate the CLV for a customer in segments.
r
A
d
M
GC
CLV
tT
t
t
s
0
(
1
)
)
(
(5)
Where
GC is the average gross contribution margin per customer
M is the average marketing cost per customer
r is the retention rate
T is the number of periods of CLV estimation
t is the period
A is the average acquisition cost per customer
acquisition, return on retention, return on up/cross-selling. In this case the probabilities for the referred events in each segment must be considered. Although being a finer model it suffers from the limitations of all the aggregate approaches, that is, individual Customer variations are not considered. Today in data driven organizations more customer data and information may be available that can be used to estimate with greater precision parameters like Customer or Product retention rate. These limitations lead us to another class of CLV approaches.
3.5.5.5.Individual CLV Approaches
Similar to aggregate approaches Individual approaches are based on the same mathematics but the principles of parameters estimation are different. The objective of individual approaches is to incorporate the maximum information specific to a customer in the calculations. Some proposed approaches state the individual CLV by the
following expression i n x n in x t t n n it in i
A
d
M
d
AGC
Active
P
CLV
1 1 11
1
)
1
(
)
(
(6)Where
i is the Customer index
t is the period for AGC is being calculated
n is the number of periods beyond t
x is the number of periods for CLV estimation
P(Active) is the probability of the Customer i being active in period t
AGC is the average gross contribution margin for Customer i in period t
M is the marketing cost per Customer i
A is the average acquisition cost per Customer i
Contrary to the aggregate approaches the probability of a specific Customer being active P(Active) must be calculated individually rather than at segment or firm level. A variety of methods can be used to estimate this parameter. One proposed method is observing the past Customer behaviour and estimate future interactions, the following formula does that
nN
T
Active
P
(
)
/
(7)Where
T is the number of periods between Customer acquisition and the last cash flow record
N is the number of periods between Customer Acquisition and the period for which P(Active) is to be calculated
n is the number of Cash Flow records
This simple formula relates the total time frame since acquisition with the time until last interaction. If a customer was acquired 10 years ago and only did one cash flow event (purchase) in the first year the probability of being active in the end of the tenth year is only 10%. The formula is also very sensitive to the variation of the level of the activity. If the same customer did two cash-flow events in the same period the probability of being active in the same period is reduced tenfold. This specific formula for calculating P(Active) suggests an empiric calibration and adaptation approach using data from the firm and many variations of this formula can be obtained.
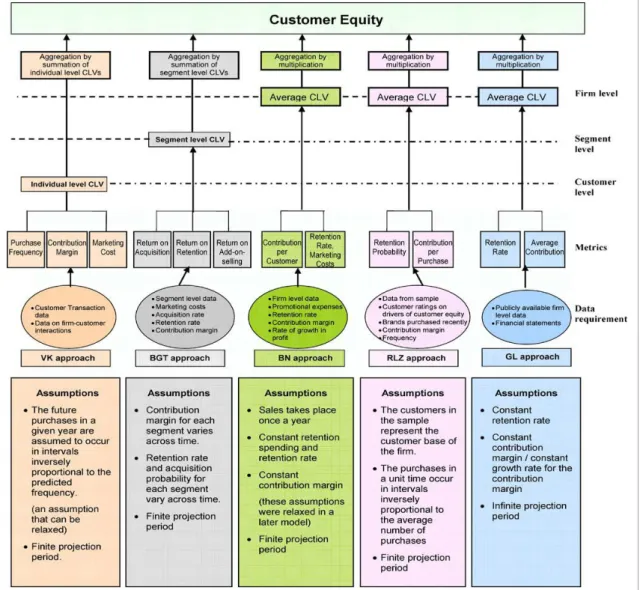
3.5.5.6.Mixed Strategies for CLV calculation
V., & George, M. (2007) and Wiesel, T., Skiera, B., & Villanueva, J. (2008) have proposed mixed strategies to maximize the applicability of a CLV framework in the real world. Depending on the specific business environment, each firm will have an optimal mix of approaches that may or not be used. Figure 3.6 shows one approach to study and compare different approaches with dissimilar aggregation and assumptions.
Figure 3.5. Mixed Strategies – Different concurrent approaches
Source: V. Kumar & Morris George
integrated in the model. That happens with the integration of market data or firm level strategies. Other reason to use mixed approaches is to control the model complexity trying to achieve a goldilocks condition between cost, power and operation ability.
The following table summarizes, at the firm operations level, the differences and contexts between the different CLV calculation approaches.
Table 3.2.Mixed Approaches
Individual Aggregate
Method CLV for every customer is
calculated from customers’
buying history and firm customer exchange
characteristics. CLVs are then aggregated by summation to get the customer equity
Customer equity is computed from firm level measures like acquisition rate, average contribution margin or from average CLV of a sample of customers.
Challenging issues
Longitudinal data on a large number of variables needed.
Does not incorporate competition in the CLV model
Differential treatment to customers on the basis of their CLV may lead to consumer backlash.
Constant average margin and retention rate may not reflect the real life scenario.
The calculation of CLV over an infinite time period is over simplification
The components of customer equity (as per this approach) cannot be segregated completely
The use of average acquisition rates and retention rates for each segment as a surrogate for future retention probabilities ignores the impact of marketing actions.
Sample selection can play an important role in the accuracy of the metric.
Subjectivity of customer rating can affect the accuracy of the metric.
When and where to use?
When longitudinal database is available with the firm and the objectives are:
Formulation of customer level strategies
Formulation of firm level strategies
Financial valuation of a
When the firm does not have longitudinal database and the objectives are:
Formulation of firm level strategies Financial valuation of a firm Comparison of two firms in terms of
The authors of this study proposed a hybrid framework where the different approaches are used according to the limitations and strategies present in the specific business environment.
Figure 3.6. Mixed strategies for CLV/CE estimation – Proposed Hybrid Solution
Source: V. Kumar & Morris George
firm.
Industries In industries where end-user
transaction data is available and marketing investments can be customized
In industries where it is difficult to collect customer transaction data
3.5.6. CLV Parameters
Taking into account the findings pointed in the Understanding CLV section, where the main elements where identified: Churn Ratio, Discount Rate and Cash-flow value and its variations. The challenge is identifying the optimum strategies to estimate these parameters.
3.5.6.1.Discount Rate
This parameter is one of the main factors for CLV calculation, as observed by Gupta, S. (2009), it projects future generated margins into their present value. This depends on the time preference over some kind of asset like money for instance. If someone or an organization does have a high time preference it means that he or she privileges having access to the asset in the short term, putting a higher cost or premium on having access to that asset latter in the future. In the case of a creditor or investor, the cost or premium, for lending an amount of capital and receiving that same amount of capital deferred in time defines a discount rate that compounds several features:
Time value of money: External factors will change the future value of the present capital such as inflation;
The Right to use that capital: The lender gives the privilege to the borrower to use the resources with the confidence and expectation of sharing partially the value/enjoyment created with that resources; Opportunity Cost: A measurement on the value of the next best
alternative;
Default Cost: The uncertainty of not receiving back the capital;
Another reason to base the discount rate, for CLV purposes, on the cost of capital is when the Customer Equity approach is relevant. In this case the firm’s value, Shareholder value and Customer Value are tightly connected.
For the Cost of Capital estimation several methods are proposed by economists and researchers as noted by De Oliveira Lima, E. (2009). Two methods are detailed in the following sections:
3.5.6.1.1 Weighted Average Cost of Capital
Broadly speaking, a company’s investments are financed by either debt or equity. WACC is the average of the costs of these sources of financing, each of which is weighted by its respective use in the given situation. By taking a weighted average, we can see how much interest the company has to pay for its financing.
)
1
(
cT
Dr
V
D
Er
V
E
WACC
(8)Where:
E is the market value of the firm’s equity; D is the market value of the firm’s debt; V is the total financed capital ( E + D); Er is market cost of equity;
Dr is market cost of debt; cT is the corporate Tax;
3.5.6.1.2 Capital Asset Pricing Model
The Capital Asset Pricing Model or CAPM is based on the idea that an investor must be compensated by the sum of time value of money and risk. The time value of money is represented by the risk free rate and the risk part is supported by
supplementary compensation, or Risk Premium, needed to the investor to accept that specific risk compared to the market risk. Thus the return on investment Ri is given by the sum of the risk free rate and the risk premium.
Ri = Risk Free Rate + Risk Premium
The risk-free rate usually is based on a risk free asset, for example 10-year government bond.
The risk premium depends on the systematic risk, risk which cannot be eliminated through diversification. Interest rates, recessions and wars are examples of systematic risks. There is also unsystematic Risk or "specific risk," this risk is specific to individual investment assets and can be diversified away as the investor adds different investments to the portfolio, it represents the component of an investment return that is not correlated with general market moves. Therefore a more formal model of CAPM is given by the following formula:
f m
f
i
R
E
R
R
R
(
)
(9)Where
Ri is the required return on investment; Rf is the risk free rate;
E(Rm)-Rf is the expected market risk premium; E(Rm) is the expected return on market portfolio;
β is the total market variance explained by the investment;
fluctuations than the market. When an investment is riskier the investor requires a higher return rate.
3.5.6.1.3 Discount Rate Analysis
Although there are several formal ways to estimate the discount rate for CLV programs there are no unique answers, it will depend on each specific organization’s reality. What is the return required by investors, if applicable, what is the riskiness nature of the firm’s operations. In each moment can we consider the assumptions about the risk environment as being true, does a risk free asset is really risk free. Ideally the annalists concerned with this issue should do sensitivity tests using different
approaches, also the kind of products and their average lifecycle are relevant in the discount rate analysis. Long term products will have more sensitivity than short term products.
As an example the following figures show three scenarios where, for a fixed time frame of 50 periods, the effect of different discount rates is exposed, CF1: dr =0.05; CF2: dr = 0.075; CF3: dr = 0.1 for a unit of monetary value.
Figure 3.7. Discount Rate Long term Effect on Cash Flows
Source: The Author
Long Term Impact of Discount Rate on Cash Flow s
0.00 0.20 0.40 0.60 0.80 1.00 1.20
1 3 5 7 9 11 13 15 17 19 21 23 25 27 29 31 33 35 37 39 41 43 45 47 49 51 CF1
Figure 3.8. Long term Effect of Discount Rate on Present Value - Accrued
Source: The Author
In this specific case the doubling of the discount rate has an effect of reducing the present value in 43% during 50 periods. See annexe A2 for further detail on this data.
3.5.6.2.Churn Ratio
Churn Ratio measures the rate customers end relations with a business therefore having a major impact in the generation of future cash flows. With this in mind it’s clear that the estimation o this parameter is central in the context of CLV as noted by Gupta, S. (2009), Abele, Karin P. N. (2009), De Oliveira Lima, E. (2009) and many other authors. The approaches to estimate this parameter are further developed in the role of datamining section.
Long Term Impact of Discount Rate on PV
19.17
13.95
10.91
0.00 5.00 10.00 15.00 20.00 25.00
3.5.6.3.Cash Flow Variations
The cash flow estimation is not only determined by the churn behaviour, changes in customer product portfolio or expected variations in margin by internal or external reasons must be considered as was observed by Abele, Karin P. N. (2009) and
Donkers, B., Verhoef, P. C., & de Jong, M. G. (2007). Some authors suggest that the CLV models must estimate those variations.
As a result, the simple profit regression model, which can deal with growth rates in profits, outperforms these models. The model that has a good performance on all
criteria is the Tobit II model, which combines a regression model for profit growth with a Probit model for customer retention, thereby capturing both dimensions of customer behavior. (Donkers, B., Verhoef, P. C., & de Jong, M. G. (2007) - Modelling CLV: A test of competing models in the insurance industry.Page 182)
3.5.7. The role of Datamining
As explained by Berry, Michael J. A. & Gordon Linoff (1997), datamining is the process of discovering by automatic or semiautomatic means significant and complex patterns in large quantities of data. The process can be described by the following steps: a) identifying sources of data; b) prepare data for analysis; c) build and train a computer model; d) apply the computer model to new data; e) test the validity of results. The problems solved by this datamining process fall in two major categories: The first is classification where the objective is deciding the degree of membership of an
observations to a specific class (e.g. is red or is blue) and secondly estimation where the objective is to estimate a certain quantity (e.g. the temperature of a system). There is also other dimension in categorizing datamining methodologies: Supervised methods, where a target or dependent attribute is defined in advance and the algorithm tries to discover relations among independent attributes using positive and negative examples of
analyst the underlying structure. The following table summarise some algorithms commonly used in datamining processes.
Table 3.3. Some Datamining algorithms
All these algorithms use optimally criteria for determining the best possible solution. The supervised methods use, in parallel, a triplet of data sets for that matter: train set to adjust the model, validation set to control the adjustment process and test data set to measure the validity of the solution with data not used in the training process.
Algorithms Problem
Type
Methodology Minus/Pluses
Neural Networks
Classification and estimation; Supervised
Simulation of the adaptive learning process by a network of artificial neurons.
Pluses
Applicable to many problems Good results in complex problems Widely used
Minuses
Hard to explain results Complex Data Preparation Local Minima
Decision Trees
Classification and estimation; Supervised
Growing a readable tree like graph by choosing the most significant attributes and classes to explain the dependent attribute.
Pluses
Explainable results
Differentiate the importance of attributes
Able to a wide range of data types
Minuses
Not appropriate for estimation problems
Only orthogonal solution spaces
Genetic Algorithms
Classification and estimation; Supervised
Simulation of the biologic evolutionary process (Selection, Crossover, mutation) to approximate a function that describes the dependent attribute.
Pluses
Explainable results Easy to apply results
Able to a wide range of data types
Minuses
Computationally expensive No guaranty of optimally
Automatic Clustering Detection
Classification;
Unsupervised Grouping observations by measuring their relative distance to reference points and from each other.
Pluses
Easy to apply
Many Data types supported
Minuses
Datamining methodologies by their nature are in a good position to be used in CLV frameworks. The capability of discovering complex relationships on large datasets makes them powerful tools for estimating behaviours especially when individual CLV approaches are chosen, this power arises from the fact that the trained models can be applied to large sets of individual data records as policies or Customers. As referred in De Oliveira Lima, E. (2009) work, the following figure shows a proposed relation between the Datamining process and the CLV concept.
Figure 3.9. Role of Datamining in CLV frameworks Source: Elen de Oliveira Lima
Outside of the mainstream of classic datamining techniques some authors propose de usage of more classical statistical methods to predict CLV dependent
variables for example Quantile Regression by Benoit, D. F., & Van den Poel, D. (2009). In the case of non-contractual relations between firms and their customers where future CF streams, due to non-reported dropouts or new transactions, are difficult to measure and therefore associate dependent variables, in these cases Negative Binomial Distribution Processes are preferred as stated in Glady’s, N., Baesens, B., & Croux’s, C. (2009a) paper on modified Pareto/NBD models for predicting CLV.
3.5.8. Hurdles in CLV/CE application
Although the CLV/CE approach appears very attractive, since it incorporates the long term impact of Customer profitability, its application has faced difficulties in implementation, not only by technological hurdles but also by organizational ones. Gneiser, M. S. (2010) noted that in some frameworks the implementation complexity appears to be, to the firm, an obstacle in demonstrating the real benefits of a CLV programme. Nevertheless several studies demonstrated that, during the last 40+ years, the slowly changing in firms marketing and operational paradigms, from product focused to a customer focused is increasing the interest and urgency in CLV methodologies.