REPURCHASE INTENTION FOR LODGING
LUIS RAÚL SÁNCHEZ VÁZQUEZ
REPURCHASE INTENTION FOR LODGING
RECOMMENDATION
Dissertation presented to the Graduate Program in of the Universidade Federal de Minas Gerais — Departamento de Ciência da Computação in partial fulfillment of the requirements for the degree of Master in .
Advisor: Rodrygo Luis Teodoro Santos
Sánchez Vázquez, Luis Raúl
S211r Repurchase Intention for Lodging Recommendation / Luis Raúl Sánchez Vázquez. — Belo Horizonte, 2017
xvii, 90 f. : il. ; 29cm
Dissertação (mestrado) — Universidade Federal de Minas Gerais — Departamento de Ciência da
Computação
Orientador: Rodrygo Luis Teodoro Santos
1. Computação — Teses. 2. Sistemas de
recomendação. 3. Indústria hoteleira. I. Orientador. II. Título.
Acknowledgments
Firstly, I would like to express my sincere gratitude to my advisor, Prof. Rodrygo Luis Teodoro Santos, for his support, guidance, knowledge, and all the time of research and writing of this dissertation. I also would like to thank all the people from Brazilian and Mexican institutions who contributed and helped to undertake this MSc. Especially, my sincere gratitude to CNPq (Conselho Nacional de Desenvolvimento Científico e Tecnológico), COCYTEN (Consejo de Ciencia y Tecnología del Estado de Nayarit), and CONACYT (Consejo Nacional de Ciencia y Tecnología de México) for the fund-ing and trust they provided for my research, which was invaluable to complete this work. Also, I compliment the great administrative and research staff at the graduate program of computer science at Federal University of Minas Gerais. I also thank my fellow labmates at LATIN (Laboratory for Treating Information) and LBD (Database Laboratory), for the stimulating discussions and days we worked together before dead-lines and exams. It has been a period of intense learning for me, not only in my academic and scientific career, but also on a personal level. I am extremely grateful to my family for the continued and unconditional support. I express my very profound gratitude to my parents for providing me with unfailing support and continuous en-couragement throughout my years of study. This accomplishment would not have been possible without them. Thank you.
Abstract
Recent years have witnessed the emergence of sharing economy marketplaces, which enable users to share goods and services in a peer-to-peer fashion. A prominent exam-ple in the travel industry is Airbnb, which connects travelers with hosts, allowing both to exchange cultural experiences in addition to the economic transaction. Inspired by recent marketing analyses of repurchase intent behavior on Airbnb, we propose a learning-to-rank approach for lodging recommendation, aimed to infer the user’s per-ception of several dimensions involved in choosing which lodging to book. In particular, we devise features aimed to capture the user’s price sensitivity as well as their perceived value of a particular lodging choice, the risk involved in choosing it rather than other available options, the authenticity of the experience it could provide, and its overall perception by other users. Through a comprehensive evaluation using publicly available Airbnb data, we demonstrate the effectiveness of our proposed approach compared to a number of alternative recommendation benchmarks, including a simulation of Airbnb’s own recommender.
List of Figures
2.1 SEMRI, edge weights denote correlations. . . 7
2.2 Taxonomy of hybrid systems. . . 10
3.1 Ranking problem. . . 16
3.2 Airbnb price histogram. . . 23
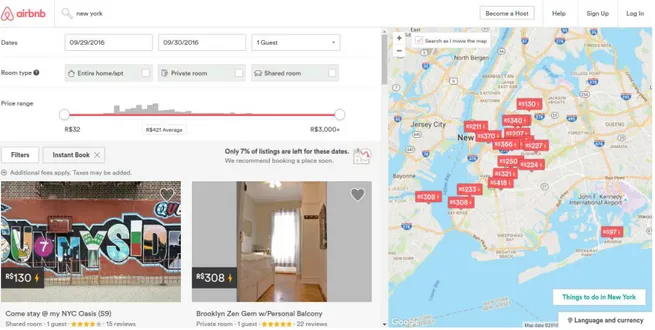
4.1 Airbnb’s search tool. . . 30
4.2 Distribution of macro-areas across the city. . . 31
4.3 lodgings’ sampling procedure. . . 31
4.4 lodgings’ coverage at the target. cities. . . 32
4.5 Recovering methodology used to build guests booking history. . . 34
4.6 Reviews in guests’ profiles. . . 36
4.7 Review’s creation dates. . . 37
4.8 Room types. . . 38
4.9 Property types. . . 38
4.10 lodgings’ prices by their property type. . . 39
4.11 lodging’s price by space attributes. . . 39
4.12 Percentage of lodgings offering amenities. . . 40
4.13 Number of reviews per lodging. . . 41
4.14 Space configuration. . . 41
4.15 Ratings. . . 42
4.16 Star rating. . . 42
5.1 Macro-area with overlapping micro-areas. . . 45
5.2 Folds’ temporal distribution (NYC left and LON right). . . 47
5.3 Sliding time windows. . . 47
6.1 Accuracy. . . 54
6.2 MRR by time window. Error bars denote 95% confidence interval. . . 55
6.5 Averaged LSI (LSI = 0 are omitted). . . 58 6.6 CLLR’s validation. . . 64
List of Tables
3.1 Lodging recommendation features. . . 18
3.2 Venue categories for PV. . . 19
3.3 Distance-based features. . . 21
3.4 PR features. . . 22
3.5 PS features. . . 24
3.6 Lexemes examples. . . 25
3.7 PA features. . . 25
3.8 EWoM features. . . 27
4.1 Test collection summary (* Unique items). . . 32
4.2 Estimated collection completeness of the entire Airbnb (* Estimated Numbers) 37 5.1 Test cases summary. . . 46
6.1 Empirical Feature Efficiency (EFE). . . 59
A.1 PV Features . . . 71
A.2 PR Features . . . 72
A.3 PS Features . . . 72
A.4 PA Features . . . 72
A.5 EWoM Features . . . 72
B.1 Hand build authenticity lexicon. . . 73
B.2 Three reviews with the greatest PA scores . . . 75
C.1 Grid Search. . . 77
D.1 Preference dimensions, MRR Gain/Loss . . . 79
Contents
Acknowledgments vii
Abstract ix
List of Figures xi
List of Tables xiii
1 Introduction 1
1.1 Motivation . . . 2
1.2 Dissertation Statement . . . 3
1.3 Contributions . . . 3
1.4 Dissertation Overview . . . 3
2 Background and Related Work 5 2.1 Sharing Economy . . . 5
2.1.1 SEM Repurchase Intention Model . . . 6
2.1.2 Perceived Value . . . 7
2.1.3 Perceived Risk . . . 7
2.1.4 Price Sensitivity . . . 8
2.1.5 Electronic-Word-of-Mouth . . . 8
2.1.6 Perceived Authenticity . . . 8
2.2 Recommender Systems . . . 9
2.3 Hybrid Approaches . . . 10
2.4 Touristic and Lodging Recommendation . . . 11
2.5 Summary . . . 14
3 Contextual Socio-Economic Models For Lodging Recommendation 15 3.1 The lodging recommendation problem . . . 16
3.2.2 Perceived Risk (PR) . . . 20
3.2.3 Price Sensitivity (PS) . . . 22
3.2.4 Perceived Authenticity (PA) . . . 24
3.2.5 Electronic-Word-of-Mouth (EWoM) . . . 26
3.3 Contextual Learning . . . 27
3.4 Summary . . . 28
4 Data Acquisition 29 4.1 Data Collection . . . 29
4.1.1 City Macro-areas, Micro-areas, and lodgings . . . 29
4.1.2 Context-based Features . . . 33
4.1.3 Guests’ History . . . 33
4.2 Data Characterization . . . 35
4.2.1 Completeness of Guests’ Booking Transactions . . . 35
4.2.2 Data Coverage . . . 37
4.2.3 lodging Characterization . . . 38
4.3 Summary . . . 41
5 Experimental Setup 43 5.1 Problem Definition . . . 43
5.2 Test Collection . . . 44
5.2.1 Geographical interpretation of test cases . . . 44
5.3 Training and Test Procedure . . . 45
5.4 Evaluation Metrics . . . 48
5.4.1 Mean Reciprocal Rank . . . 48
5.4.2 Empirical Feature Efficiency . . . 48
5.4.3 Least Square Improvement . . . 49
5.5 Baselines . . . 49
5.5.1 Non-Personalized Popularity Ranking . . . 50
5.5.2 Airbnb Ranking . . . 50
5.5.3 Bayesian Personalized Ranking Matrix Factorization . . . 51
5.6 Summary . . . 51
6 Experimental Results and Analysis 53 6.1 Model Effectiveness . . . 53
6.2 Model Robustness . . . 56
6.3 Feature Efficiency . . . 57
6.3.1 Review Count . . . 58
6.3.2 Distance-Based Features . . . 60
6.3.3 Price Sensitivity . . . 61
6.3.4 Perceived Risk . . . 62
6.3.5 Perceived Value . . . 62
6.3.6 Electronic-Word-of-Mouth and Perceived Authenticity . . . 63
6.4 Preference Dimensions and the SEMRI . . . 63
6.5 Summary . . . 65
7 Conclusions and Future Works 67 7.1 Summary of Contributions . . . 68
7.2 Summary of Conclusions . . . 69
7.3 Directions for Future Research . . . 69
Appendix A Feature Model 71
Appendix B PA Lexicon, Reviews Examples, and ES parameters 73
Appendix C Grid Search 77
Appendix D Preference Dimensions and MRR 79
Bibliography 81
Chapter 1
Introduction
Recommender systems (RS) are applied in a wide range of domains. They have be-come crucial for many everyday tasks [Sivapalan et al., 2014] in order to tackle the information overload caused by the vast amount of information that exceeds human capabilities to manually search for relevant items. Recommender systems extensively demonstrated their importance in many industries as a major source of revenue and user satisfaction. They are particularly popular for e-commerce companies (e.g. online retailers, streaming movie sites, music applications, and social networks) [Dabholkar and Sheng, 2012; Knijnenburg et al., 2012], representing a substantial component of their business models [Schafer et al., 1999].
The tourism industry has largely adopted the Internet as one of its main sales’ channel, helping customers to find information in order to plan their trip [Law et al., 2014]. Due to the complexity of the travel planning process, specialized e-tourist agen-cies became popular services, which help travelers with personalized assistance to plan their trip [Bobadilla et al., 2013; Buhalis and O’Connor, 2005]. More recently, rec-ommender systems have been proposed to tackle the problem [Felfernig et al., 2007; Kabassi, 2010; Borras et al., 2014] in order to personalize recommendations for users, allowing them to have a customized interaction with online platforms, dealing with the issue of information overload and simplifying the complexity of the task.
The tourism and travel industry is currently being reshaped by the so-called the sharing economy, which is a broad term embracing peer-to-peer-based activities of giv-ing, shargiv-ing, exchanggiv-ing, or purchasing goods and services, exploiting information and communication technologies [Hamari et al., 2015]. Due to the recent emergence of such phenomena, the theories and understanding of the sharing economy are yet overlooked and unexploited in recommender systems, as in many other domains. Researchers have highlighted the divergence and disparity of customers and items of the sharing
economy when compared to their traditional business-to-peer counterparts [Möhlmann, 2015; Hamari et al., 2015], which is mainly explained by customers’ motivational drivers towards consumption in an online, collaborative, and shared manner.
In this dissertation we focus on the lodging recommendation problem in sharing economy environment. More specifically, the recommendation task is given a location, where the user wishes to sojourn, retrieve a list of lodgings sorted by relevance, which is composed of accommodations located at the neighboring of the input location. In order to tackle the problem, we proposed CLLR, a recommender which adopts the concepts of a repurchase intention model [Liang, 2015], to build five preference di-mensions to be leveraged by a learning-to-rank algorithm, which are sustained in five customer behavioral premises towards consumption in the sharing economy: price value (cost/benefit of a particular lodging choice), perceived risk (uncertainty of unwanted outcomes in the transaction), perceived authenticity (genuineness of experiencing lo-cals’ lifestyle), electronic-word-of-mouth (informal opinions of other users), and price sensitivity (awareness of the price dispersion).
Through a comprehensive evaluation we demonstrate the effectiveness of our pro-posed model using publicly available data from the largest lodging provider of the shar-ing economy, Airbnb.1 To the best of our knowledge, this dissertation is the first of its
kind that addresses the sharing economy in recommender systems.
1.1
Motivation
According to the U.S. Census Bureau,2 in 2014, the accommodation industry reported
revenues of $221.8 billion dollars. Some studies claim that Airbnb, a booking site for lodging and one of the most notorious icons of the sharing economy, have rapidly grown to encompass up to 10% of the total hotel industry revenue for some travel destinations [Zervas et al., 2016]. With the promising future of the sharing econ-omy, researchers expect the emergence of more peer-to-peer travel and tourism agen-cies [Zekanovic-Korona and Grzunov, 2014]. The launch of the new service Airbnb Experience (end of 2016) allows users to design experiences/activities that other users can book, this service is evidence of the expansion of the sharing economy in the recre-ational touristic domain. Having demonstrated their potential, it is natural to expect that over the following years we will be witnessing the sharing economy becoming an important portion of the digital economy. Thus, the recommender systems community should also extend its efforts to tackle the challenges that such domain may pose.
1
https://www.airbnb.com/
2
1.2. Dissertation Statement 3
1.2
Dissertation Statement
The statement of this dissertation is that sharing economy lodging recommendation can be improved by modeling users’ repurchase intention. In particular, this dissertation aims to answer the following research questions:
• RQ1: How accurate is CLLR for lodging recommendation?
• RQ2: How robust is CLLR for lodging recommendation?
• RQ3: How do single features contribute to the performance of CLLR?
• RQ4: How do our results relate to existing theories of the sharing economy?
In order to answer these research questions, in this dissertation we explored social-economic theories relevant for the sharing economy in the lodging domain, from which we proposed an approach that models such theories. Then, we designed an evaluation methodology that required the construction of an adequate test collection, to finally analyze the results to answer our research questions.
1.3
Contributions
This research has led to the accomplishment of the following contributions:
• Contribution 1: A feature-based lodging recommendation approach, inspired
by socio-economic theories of repurchase intention for the sharing economy.
• Contribution 2: A test collection and evaluation methodology for lodging
rec-ommendation.
• Contribution 3: A comprehensive evaluation of the proposed approach in a case study using Airbnb.
1.4
Dissertation Overview
Below we present a brief outlook that summarizes each one of the chapters in this dissertation:
• Chapter 2: Background and Related Work gives the base theory to
• Chapter 3: Repurchase Intention Model for Recommendation defines
our proposed model which integrates sharing economy concepts to recommenda-tion systems.
• Chapter 4: Data Acquisition describes the procedure for the construction of
our test collection and characterizes the dataset we built.
• Chapter 5: Experimental Setup explains the design of our evaluation
frame-work with the procedure employed to conduct our experiments.
• Chapter 6: Experimental Results and Analysespresents and analyzes the
results.
• Chapter 7: Conclusion and Future Works concludes the dissertation,
Chapter 2
Background and Related Work
This chapter provides an overview of the sharing economy as a technological trend, and discusses implications for modeling users’ behavioral attitudes, with a special con-sideration for repurchase intention. In addition, it provides background on the recom-mendation problem, reviewing classical recomrecom-mendation techniques, as well as efforts related to the lodging recommendation domain.
2.1
Sharing Economy
The sharing economy is a concept that may have different nuances according to the context where it is employed, with authors having to delimit the extension of its mean-ing. In this dissertation, the sharing economy is defined as new online marketplaces that create innovative consumption modalities that stand in sharp contrast to their traditional or conservative counterparts [Belk, 2014; Hamari et al., 2015; Fraiberger and Sundararajan, 2015]. According to the last definition, sharing economy companies can sell/provide items that are not new. Nevertheless, such companies must adopt in-formation technologies as their main mediator with their customers in addition to offer innovative variants that would separate them from their competitors (not necessarily involving sharing). Collaborative consumption refers to transactions between con-tributors and end-users in a Peer-to-Peer (P2P) manner, involving sharing resources or conjoint consumption (multiple buyers collaborating to consume) [Hamari et al., 2015]. Online collaborative consumption is in most cases a subclass of the sharing economy [Hamari et al., 2015], where the transaction in a P2P manner is the dis-tinctive factor that defines such companies apart from their traditional counterpart. Prominent examples of P2P sharing economy companies are Uber,1 the private
trans-1
https://www.uber.com
portation company, and Airbnb,2 the booking lodging site.
Economic and social researches have studied the sharing economy and found inherent peculiarities of the peer-to-peer lodging domain, highlighting important char-acteristics such as utility, trust, cost savings, and familiarity, to be particularly relevant for their customers [Möhlmann, 2015; Hamari et al., 2015; Liang, 2015]. This translates to users having different consumption preferences, suggesting that customers portrait their behavior differently in the lodging sharing economy than in traditional accommo-dation markets. Another important characteristic of the sharing economy in the lodging domain is that in contrast to hotel supply it can rapidly adapt (add and remove lodg-ing supply) in response to periods of high demand. In addition, lodglodg-ing supply shows a wider geographical coverage, making the lodging sharing economy more than just a substitute for hotels [Zervas et al., 2016]. The latter observation suggests that the lodg-ing sharlodg-ing economy ecosystem substantially diverges from the hotel recommendation scenario.
2.1.1
SEM Repurchase Intention Model
According to the Theory of Reasoned Action (TRA) there exists a straight and tight relationship between attitude and behavior [Ajzen and Fishbein, 1977]. Precisely, TRA states that intention is the best predictor that precedes human action. Therefore, it is appropriate to predict consumers’ purchase behavior by measuring their repurchase intention (RI).
Airbnb3 is a sharing economy web application that permits users to list, search,
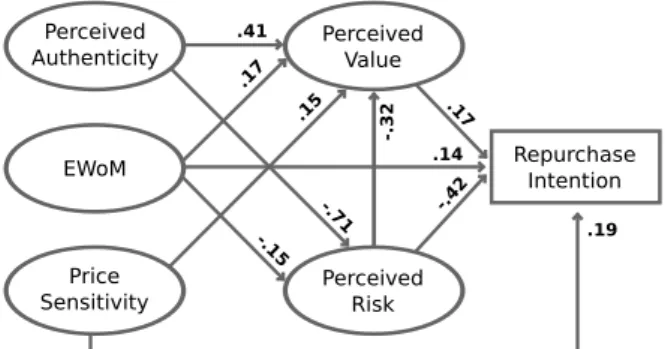
and rent lodgings enabling guests to benefit from locals’ advice. Liang [2015] studied Airbnb customer’s repurchase intention, and validated a model that was constructed using structural equation modeling (SEM), a multivariate statistical analysis technique used to analyze structural relationships. In such model, RI is shown to be dependent on two main variables: perceived value (PV) and perceived risk (PR), and that in turn, PV and PR are influenced by other variables named perceived authenticity (PA), electronic-word-of-mouth (EWoM), and price sensitivity (PS). The SEM model constructed by Liang [2015] (SEMRI) is presented in Figure 2.1. The following sections define the concepts that led to the creation of Liang [2015]’s model, and discuss how they operate in the sharing economy lodging setup.
2
https://www.airbnb.com/
3
2.1. Sharing Economy 7
Repurchase Intention
.17
.19 .14
Perceived Value
Perceived Risk EWoM
Price Sensitivity
Perceived Authenticity
.41
.17 .15
-.15 -.71
-.32
-.42
Figure 2.1: SEMRI, edge weights denote correlations.
2.1.2
Perceived Value
Zeithaml [1988] define perceived value (PV), as the overall consumers’ judgment with respect to the utility of a service/product, based on their perceptions of cost effective-ness (gain versus given).
PV is defined by many authors as a trade-off between benefits (something the consumer receives) and sacrifices (something the consumer gives up) [Kashyap and Bo-janic, 2000]. Both are customer’s perceptions of a mixture of the attributes of the item involved (quality, utility, benefits) upon perceived sacrifices (commonly monetary). In our lodging context, this translates to how valuable the amenities, location, comfort, and other features of the accommodation are with respect to the price of the lodging.
2.1.3
Perceived Risk
2.1.4
Price Sensitivity
Price sensitivity in the touristic domain has been subject of multiple studies that in-vestigate how prices affect tourist’ purchasing behavior [Masiero and Nicolau, 2012a,b; Nicolau and Masiero, 2013]. PS is a concept that refers to the extent to which pricing dictates consumption. Also, it is directly linked to the level of importance consumers place on price relative to other purchasing criteria [Masiero and Nicolau, 2012b]. Price in online contexts has been subject of many research studies [Donthu and Garcia, 1999; Shankar et al., 1999; Degeratu et al., 2000] and is probably one of the most important decision factors, broadly accepted in influencing consumers purchase behavior. It has been shown that the price sensitivity of a customer increases the more he or she is aware of the price dispersion of a given product [Degeratu et al., 2000]. As the trip planning process is an activity that requires a vivid information search exercise [Fodness and Murray, 1997], it is intuitive to assume that travelers become aware of the lodging supply’s price dispersion, while comparing different lodging provider alternatives (e.g. hotels, hostels, campsites), thus, making this scenario intrinsically price sensitive.
2.1.5
Electronic-Word-of-Mouth
Electronic-Word-of-Mouth (EWoM) is defined as any form of informal Internet-based information directed to consumers that is related to the usage/attributes of particular goods, services, or their sellers (e.g. social media posts, blogs, forums, reviews) [Litvin et al., 2008]. Reviews are one of the most frequent forms of EWoM that can be found in most online vendors’ websites [Pang and Lee, 2008]. Most tourist and travel online agencies have also adopted the usage of reviews as a standard practice. Indeed, many studies evidence the strong influence that reviews have on travelers’ purchase decisions [O’Connor, 2008; Gretzel and Yoo, 2008], demonstrating their function as a catalyst of users’ perception regarding a particular lodging [Cantallops and Salvi, 2014].
2.1.6
Perceived Authenticity
2.2. Recommender Systems 9
real and consequently authentic. More specifically, in the scope of this work, the con-cept of PA is defined to be the genuineness of the foreigner traveler experiencing locals’ lifestyle [Liang, 2015]. Such familiarity trait is attractive for sharing economy lodging customers [Guttentag, 2015] and is positively correlated with user’s satisfaction, which in turn encourages consumption.
2.2
Recommender Systems
Recommender systems (RS) are a branch of information systems that are widely used in many real-world setups and can be particularly common in e-commerce websites. Recommender systems aim to filter items from a large catalog that is intractable for humans to explore. The filtering criterion employed is usually intended to fit users’ preferences, interests, tastes, or needs. In contrast to other information filtering sys-tems, recommender techniques are aimed to be proactive, enhancing discovering mech-anisms, as users do not have to explicitly state their information needs. According to Jannach and Adomavicius [2016], the main purpose of recommenders is to suggestgood
items for a user, which in practice translates to two scenarios: (1) predicting user’s
rating scores (rating prediction) or (2) ranking items according to the estimated user preferences (top-N recommendation). Balabanović and Shoham [1997] proposed one of the first categorizations of RS in the literature, which is composed of three classes, named collaborative filtering (CF), content based (CB), and hybrid recommendation techniques.
Collaborative filtering are techniques that make recommendations based on
users’ opinions [Resnick et al., 1994; Shardanand and Maes, 1995] and are the most traditional approaches. The intuition behind CF, is that given a user u, CF objective is to identify other users with similar tastes than uto exploit the items they have liked in the past, which are employed to make recommendations for the target user u. CF techniques are advantageous as they are completely agnostic of the representation of the items being recommended. Indeed, they use what users consumed (generally a user-item rating matrix) without explicitly having to model complex objects such as music and movies [Burke, 2002].
Content basedare techniques that recommend items that are similar to the set
1997].
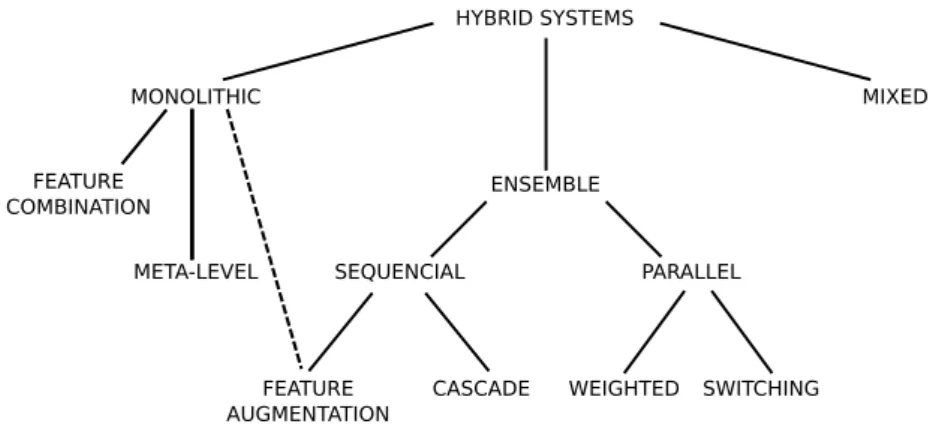
Finally, hybrid techniques are defined as methods that combine two or more recommendation techniques, with the purpose to outperform the usage of a single one [Burke, 2002, 2007]. Hybridization aims to combine the strengths of multiple methods while alleviating the drawbacks and weaknesses of individual recommenda-tion techniques. The feature-based model proposed in this dissertarecommenda-tion falls into this category. In the next section, we review the classification of hybrid recommenda-tion proposed by Burke [2007], which is composed of seven different hybridizarecommenda-tion techniques: weighted, switching, mixed, feature combination, feature augmentation, cascade, and meta-level.
2.3
Hybrid Approaches
According to Jannach et al. [2010], hybridization techniques can be grouped under the taxonomy shown in Figure 2.2, encompassing three classes: Monolithic, Ensemble, and Mixed. Ensemble systems are designed to leverage multiple off-the-shelf algorithms by combining their results into a single and more robust output. The operation of their internal recommendation algorithms can be done sequential or in parallel. Monolithic systems uses various types of data that are integrated into one recommendation algo-rithm. Finally, mixed systems, similarly to ensembles, use multiple recommendation algorithms as black-boxes and the items recommended are presented together side by side, instead of combining multiple results.
HYBRID SYSTEMS
ENSEMBLE
MONOLITHIC MIXED
PARALLEL SEQUENCIAL
FEATURE COMBINATION
META-LEVEL
FEATURE AUGMENTATION
CASCADE WEIGHTED SWITCHING
Figure 2.2: Taxonomy of hybrid systems.
In Weighted hybrid techniques, the outputs of the multiple recommenders are
2.4. Touristic and Lodging Recommendation 11
recommendation component commonly fall under this category. The union/intersection of item sets, that are shared between the exclusive operation of the recommendation modules, also fall in this category.
Contrary to weighted hybridization, Switching does not merge multiple
recom-mendation outputs. Instead, according to the given scenario they face, these methods are able to switch between recommendation techniques. Therefore, a decision criterion has to be established in order to chose the recommender module that will likely achieve the best performance.
In Mixed Hybrid recommendations, the outputs from different recommenders
are presented together, but in contrast to weighted hybridization, there is no shared information between the operation of the recommendation modules. Instead, mixed hybrid approaches output a mixture of the outputs of the recommendation modules, for instance in a side-by-side recommendation lists.
Feature Combination hybridization employs features derived from multiple
knowledge sources, for instance, the scores of other recommenders. Features are com-bined together to constitute a single input to the recommendation model. This hybrid class has not multiple tangible or well defined recommendation components, but rather a single unit recommender.
Feature Augmentationis a stacked version of feature combination, where
mul-tiple recommendation modules are chained. The output of one module is included in the input features of the next one. This strategy allows for each module to stamp its recommendation domain logic, contributing to augment the features of each item.
In Cascadehybridization, recommenders are organized in a hierarchy in such a
way that decisions made by a higher-order recommender cannot be altered by a lower-order one. An example of this method is a recommendation module that re-ranks the items recommended by a higher-order module.
Meta-levelhybrid recommendation is achieved when the model produced by one
of the hybrid recommender modules serves as the input for another module. In contrast with feature augmentation, meta-level hybridization completely ingests models and not merely the features.
2.4
Touristic and Lodging Recommendation
a set of the following items: travel destinations, touristic attractions, recreational ac-tivities, accommodation, and eatery venues. The majority of these works recommend lodgings in conjunction, or constrained, to other items, which leaves unclear how to apply them to pure lodging recommendation. Nevertheless, there are sporadic works that exclusively dedicate their effort to recommend solely accommodations.
The first work we present was proposed by Saga et al. [2008]. Their proposal lever-ages users’ booking history, in order to create an undirected hotel-guest graph. The graph is converted into a preference-transition-network, which is the result of trans-forming the initial hotel-guest graph to an hotel-hotel graph. The intuition behind such transformations is that it allows to certain pairs of hotel nodes to be linked together by mean of the guests they hosted, a link between hotelAtoBis interpreted as users that bookedAare likely to transition to book hotelB, as the transition is supported by users booking records, from which the graph was built. Then, recommendation is achieved in two steps, candidate selection and candidate ranking. Candidate selection is achieved after the user explicitly selects an initial hotel, and based on the preference-transition-network, the system selects neighbor nodes. The next step is candidate ranking, where candidate hotels are sorted using the scoring functionInDegreei−OutDegreei−C2, where InDegreei(OutDegreei) is the in(out)-degree of the candidate hotel i in the transition network, andC is a penalty for the previous booking of the given hotel.
Levi et al. [2012] characterize hotel recommendation as a cold-start scenario, as users do not rate enough hotels to enable techniques such as collaborative filtering to achieve recommendation. The intuition of their proposal is to mimic how users build their opinion about a lodging while reading the reviews that guests wrote to it. They assume that readers evaluate an accommodation giving more importance to reviews wrote from people with the same background as theirs. Background is defined in terms of nationality, travel intention (single, couple, family, group, and business), and preferences on hotel traits (location, service, food, room, general, other). Therefore, hotels are modeled using the text of the reviews, where words are seen as features with different importance weights according to different groups of users under each category (nationality, travel intention, and hotel traits preferences). Then, giving to the recommender a user’s nationality, travel intention, an preferences on hotel aspects, the systems is able to computed a score for each hotel, which is a compound of the feature weights of the groups that the target user belongs. They conducted an experiment using the Internet crowd-sourcing service Mechanical Turk4 to validate their proposal,
presenting evidence of how reviews can be mined to identify typical types of users for
4
2.4. Touristic and Lodging Recommendation 13
a given hotel.
In the work done by Zhang et al. [2015], they proposed a hybrid recommender system that uses collaborative filtering in addition to content based. Their approach consist in three stages, (1) completion of the user-item rating matrix, (2) improvement of the user-item rating matrix, and (3) personalized top-N recommendation. The first stage uses Latent Dirichlet Allocation (LDA) [Blei et al., 2003], a topic model that assumes that documents are produced from a mixture of topics. Exploiting the textual content of a document, LDA allows to backtrack how much a given document belongs to each latent topic. LDA is used to generate user/hotel representation as topic vectors, employing the reviews that a guest wrote and that a hotel received. Then, the topic vectors serve to compute user-user and a hotel-hotel similarity matrices (SU and SV) via Pearson correlation. The item-user matrixX and the similarity matricesSU andSV serve as input for their proposed CF matrix factorization technique, named Preference Factor Model (PFM). PFM uses gradient descent to complete the user-item matrix X, similarly than Singular Value Decomposition (SVD) [Billsus and Pazzani, 1998] does, adding terms considering SU and SV. The second step normalizes the rating scores in X, taking into consideration three main factors (a) the mean rating on each intent class, (b) the sparsity of the user-item sub-matrix in the intent category, and (c) specific user rating statistics (frequency and average). Users’ intent is given by their data collection (single, couple, group, family, business, and others). The final step produces top-N recommendations with maximal marginal relevance (MMR) [Carbonell and Goldstein, 1998], which is a diversification technique used in information retrieval, that reduces redundancy while maintaining query relevance. In other words, MMR is a trade-off between relevance and duplication. Finally, their evaluation demonstrated that rating predictions can be improved by leveraging users’ traveling intent.
PCA-ANFIS is a hybrid method proposed by Nilashi et al. [2015]. Their approach was employed for hotel recommendation in a multiple rating scenario, where multiple
ratings refers to users rating multiple hotel aspects (e.g. value, rooms, location,
clean-liness, check in/front desk, service, and business services). PCA-ANFIS consist in two stages, the first is (1) data preprocessing and (2) training. The first stage creates a three dimensional rating tensor, where the tensor’s dimensions correspond to users, items, and the multiple ratings. The tensor is used to cluster users, using Expectation Maximization (EM) algorithm [Moon, 1996], and for each cluster Principal Component Analysis (PCA) [Wold et al., 1987] was performed for dimensionality reduction.
fuzzy logic principles [Zadeh, 1965]. Their experiments demonstrated that PCA-ANFIS leads to the improvement in predictive accuracy of tourism multi-criteria prediction. They evaluated their proposal using a TripAdvisor’s5test collection, demonstrating the
improvement in accuracy of their multi-criteria collaborative filtering.
2.5
Summary
In this chapter we introduced the sharing economy phenomena. We highlight partic-ularities that detach the traditional hotel scenario from the sharing economy lodging domain. We also dedicate special attention to a repurchase intention model, supported by five customers behavioral premises, investigated under the context of the lodging sharing economy, named price value, perceived risk, perceived authenticity, electronic-word-of-mouth, and price sensitivity. After characterizing the context of this work, we presented a taxonomy of recommender systems, relevant to the scope of this dis-sertation, which is composed of three categories: collaborative-filtering, content-based, and hybrid approaches. A section was dedicated to detail the subclasses of hybrid ap-proaches. Finally, this chapter was concluded presenting some of the few works that are dedicated to recommend hotels. None of the current works on lodging recommendation have evaluated their proposal on the more specific sharing economy domain. In the following chapter we discuss our proposed feature model for lodging recommendation, which is inspired in the related theories of the sharing economy that were addressed in this chapter.
5
Chapter 3
Contextual Socio-Economic Models
For Lodging Recommendation
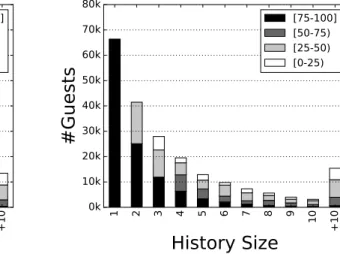
Recommender systems (RS) have demonstrated their effectiveness in scenarios such as recommendation of music, movies, social media content, and online purchases. In such domains, users’ historical transactions are typically abundant, whereas lodgings booking transactions are far more rare and for some users very sporadic. RS typically leverage information on users, items, or interactions between both. In contrast, the target domain of this dissertation has severely sparse user profiles, which limits the applicability of traditional collaborative or content-based approaches. In the data collection used in this dissertation, the user-item matrix is very sparse (99.9997%) and most of the users have small booking transactions profiles (See Figure 4.6, 80% of the users possesses less than 5 bookings), which hinders an accurate modeling of users’ distinctive preferences that is crucial for tackling the recommendation problem.
On the other hand, existing lodging recommendation approaches ignore the eco-nomic drivers that motivate users to consume lodgings in the sharing economy. Re-searches have found important peculiarities that substantially distinguish the hotel domain from the sharing economy lodging scenario [Möhlmann, 2015; Hamari et al., 2015; Zervas et al., 2016; Liang, 2015]. In particular, P2P lodging has been described as more than just a hotel substitute for three main reasons: (1) P2P lodgings provide a much more dynamic ecosystem as lodging supply can rapidly respond to changes in demand, (2) P2P lodgings serve a wider range of use cases due to the increased diversity and geographical coverage of lodging supply, (3) P2P lodging customers give importance to cost savings, utility, trust, and familiarity, shaping unique customer preferences.
In order to overcome the sharing economy challenges in the lodging domain, we
propose a context-aware learning-to-rank approach for lodging recommendation, aimed to exploit the socio-economic context around available lodgings as multiple ranking fea-tures. In the following sections we first introduce the lodging recommendation problem, to further explain our approach, which is inspired by recent socio-economic studies in the domain of Airbnb, the largest lodging provider of the sharing economy.
3.1
The lodging recommendation problem
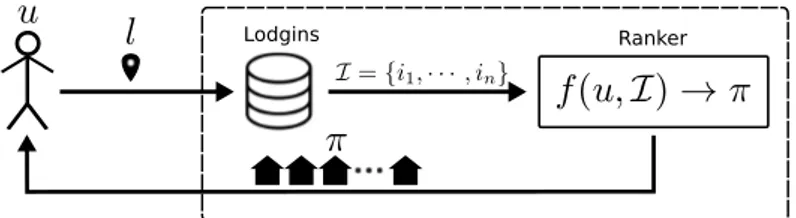
In this dissertation, the recommendation task is defined as given a location where the user wishes to sojourn, retrieve a list of lodgings sorted by their estimated relevance, composed of accommodations located at the neighborhood of the input location. Pre-cisely, the recommendation task is a top-N recommendation task, therefore, it can also be conceived as a ranking problem. Figure 3.1 illustrates the problem, showing a user u, that inputs a target location l to the system. l is used to obtain I ={i1,· · · , in}, a set of n lodgings at the surroundings of l, which is passed to a ranker f(u,I)→ π, a function aimed to produce an optimal permutationπ, of the setI, prioritizing relevant items to the useru.
Ranker Lodgins
Figure 3.1: Ranking problem.
According to the outlined recommendation task, this dissertation proposes a feature-based context-aware model for the set of lodgingsI, which is explained in the following Section 3.2, that in turn, is leveraged by an effective ranker f(u,I) capable to employ these features, as explained in Section 3.3.
3.2
Context-Aware
3.2. Context-Aware 17
1. Perceived Value, the trade-off between the benefits versus the cost of each avail-able lodging;
2. Perceived Risk, the assessment of all possible negative outcomes derived from booking the lodging;
3. Price Sensitivity, the extent to which the price of a lodging affects a guest’s booking behavior;
4. Perceived Authenticity, the extent to which a guest feels like natively living at the lodging place; and
5. Electronic-Word-of-Mouth, informal opinions that frame the judgment of other users towards the lodging
These last concepts are overlooked in RS as drivers of users consumption, espe-cially in the lodging sharing economy domain (Section 2.4). The following sections explain the computation of each one the preference dimensions. Table 3.1 lists and summarizes the 176 features used to represent lodgings in our approach, which are aimed to capture the socio-economic context of an available accommodation in various ways. The input column denotes whether each feature is estimated based upon the
lodging i, lodging context c, or both.
3.2.1
Perceived Value (PV)
The notion of PV can be conceived as the trade-off between the lodging’s benefits ver-sus the price of the lodging. Most of the lodgings’ attributes follow under this concept (e.g. wireless Internet, number of beds, pool, tv cable, weekly price, security deposit). However, these features solely characterize rooms with their enclosed attributes and overlook the value derived from the local context. For instance, having an accommo-dation close to a metro station may be more valuable than the exact same lodging at the same neighborhood, but more distant from public transportation. Similarly, the nearness of other points of interest at the surroundings of a lodging may increase the value of the respective accommodation. Therefore, in order to better quantify the perceived value of a lodging, we need to consult alternative sources of information.
Web mapping services are now a reality made possible by a number of service providers such as Google Maps,1 OpenStreetMaps,2 Yelp,3 Foursquare,4 and many
1
https://www.google.com/maps
2
https://www.openstreetmap.org/about
3
https://www.yelp.com/about
4
Feature Class input qty
Perceived Value (PV)
Pricing i 6
Property type i 21
Room type i 3
Bed type i 5
Equipments i 4
Property capacity i 1
Guests allowed i 1
Amenities i 40
Nearby venues c 3
Nearby venues check-ins (min, max, avg, med) c 12 Nearby venues distance (min, max, avg, med, norm.) i, c 24
Perceived Risk (PR)
Cancellation policy i 5
Ratings i 7
Reviews (std, norm.) i 2
Nearby lodgings c 1
Nearby lodgings reviews (avg, std) c 2
Price Sensitivity (PS)
Histogram lodgings prices (avg, skw, kur) c 3
Sampled lodgings prices (avg, skw, kur) c 3
Price (normalized) i, c 3
Perceived Authenticity (PA)
Authenticity score (avg, med, min, max, skw, kur) i 6
Electronic Word of Mouth (EWoM)
Sentiment score (avg, med, min, max, skw, kur) i 24
Grand total 176
Table 3.1: Lodging recommendation features.
others. Usually, such services offer an API that allows to query for a geographical coordinate to get information of the surrounding geographical layout, venues, transit, and other statistics. In this particular work, we use Foursquare’s API.5
To better capture the concept of PV, such services may be used to obtain in-formation around the lodgings’ geo-location using a fixed custom radius (as shown in Table 3.2). In order to characterize the surroundings of the accommodation in a sense that is compatible with Airbnb guests’ traveling intention, we propose to use mapping services to fetch information of three venues’ categories: Food, Art& Entertainment, and Travel& Transportation.
5
3.2. Context-Aware 19
Category Radius #Venues
Food 500 meters 50
Art & Entertainment 1,500 meters 50 Travel & Transportation 1,500 meters 50
Table 3.2: Venue categories for PV.
The radius used in each category are intended to capture distances one would be willing to cover in order to reach each type of venue from the accommodation, as we explain in the subsequent sections. All the features that belong to the PV category are detailed in Appendix A.1.
3.2.1.1 Food Venues
The food category includes a range of venues such as restaurants, coffee shops, cafe-terias, and other culinary places. The importance of food venues has been studied as a component of touristic involvement, which has been shown to influence the selec-tion of travel destinaselec-tions [Gross and Brown, 2008; Sparks et al., 2003]. Derived from these studies, we conclude that the proximity of food venues also increases the PV of a lodging as they greatly impact the travelers’ overall experience.
To determine the radius used to retrieve food venues that increase the PV of our lodgings, we used a simple criterion based on the time and distance. We assumed that the presence of food places at five minutes walking distance from the lodging add value to the accommodation. Then we established an empirical five minutes walking distance, to be the maximum distance that a pedestrian would consider to transit, in order to reach a food venue. The average preferred walking speed [Browning et al., 2006; TranSafety, 1997] estimates that 500 meters would be covered between five to six minutes by most people, which is the motivation underneath the choice of a 500 meter radius for the food category.
3.2.1.2 Travel & Transportation and Art & Entertainment Venues
Commuting is understood as recurring and periodic travels (routine trips) that people do between two locations. It is most commonly used to define the trips between residence and working locations. Therefore, to estimate the average distance that can be traveled in 15 minutes, abstracting geographic, environmental, and specific urban factors, we rely on studies that investigate commuting [Sandow and Westin, 2010; Lee and McDonald, 2003] and governments commuting statistics (Australia6
and USA7). After reviewing and testing various approaches to translate 15 minutes, to
actual geographical distances, we employed each candidate radius to get various venues samples from the mapping services, and we concluded that 1,500 meters is a feasible and convenient radius to be traversed in 15 minutes by car or public transportation.
3.2.1.3 Distance-Based Features
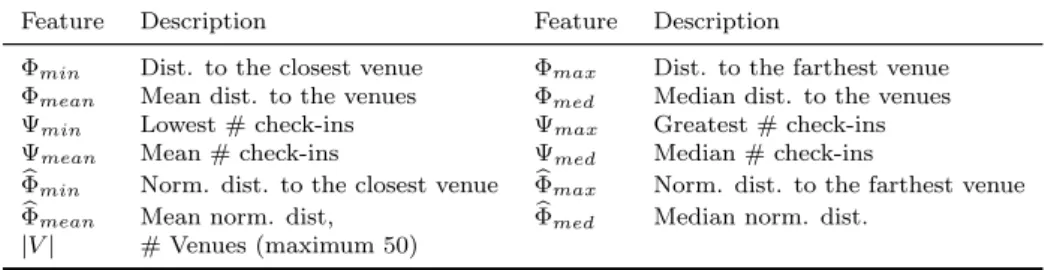
Among the data that may be obtained from the mapping services, two main informa-tion are particularly useful, the distance from each venue to the lodging (Φ) and the number of check-ins (Ψ) that a given venue has. Venues that have greater popularity can be considered as iconic venues of their respective neighborhood, which may be an incentive for making tourists more willing to travel a longer distance, in order to reach the venue. If we consider the proximity of a venue as a factor that increases the value of an accommodation, we may state that just as psychological maps shape geographical boundaries in people’s minds [Quercia et al., 2013], the perceived distance from the accommodation to iconic venues would have a different meaning than the actual phys-ical distance. Therefore, we propose a normalized version of the geographphys-ical distance, using the check-ins the venue possesses as a normalization factor:
b
Φ = Φ/Ψ. (3.1)
Finally, splitting the data by category, we aggregate all venues’ information (Ψ,
Φ, and Φb) separately by their respective group to compute various statistics, as show in Table 3.3.
3.2.2
Perceived Risk (PR)
For online sharing economy lodgings, perceived risk is the degree of perceive all possible negative outcomes, derived from booking the lodging [Liang, 2015]. Viewed from the risk classification perspective proposed by Jacoby and Kaplan [1972], the notion of
6
https://bitre.gov.au/publications/2015/files/is_073.pdf
7
3.2. Context-Aware 21
Feature Description Feature Description
Φmin Dist. to the closest venue Φmax Dist. to the farthest venue
Φmean Mean dist. to the venues Φmed Median dist. to the venues
Ψmin Lowest#check-ins Ψmax Greatest#check-ins
Ψmean Mean#check-ins Ψmed Median#check-ins
b
Φmin Norm. dist. to the closest venue Φmaxb Norm. dist. to the farthest venue
b
Φmean Mean norm. dist, Φmedb Median norm. dist.
|V| #Venues (maximum 50)
Table 3.3: Distance-based features.
perceived risk can be dissected in three different aspects, physical risk, performance risk, and financial risk. Physical risk is a considered as guests rarely know the host. Performance risk is the uncertainty that guests cannot experience the accommodation previously to their arrival. Finally, financial risk refers to the risks that guest may incur in cancellation fees.
The two first dimensions of risk, physical and performance, are tackled by Airbnb’s quality service measures (ratings) and a popularity metric (review count). When an Airbnb guest books an accommodation and the booking is concluded, the guest is asked to give explicit ratings to evaluate particular attributes of the lodging: cleanliness, accuracy, value, check-in, location, and communication, also an overall rat-ing (star ratrat-ing) is shown on the lodgrat-ings’ profiles. In addition, a review count is also provided, and these information (ratings and review count) are public at the corre-sponding lodging profile page. These collaborative reputation strategies alleviate the perception of risk and therefore are drivers of the risk perception.
On the other hand, the financial risk is dictated by the lodging’s cancellation policy, which determines the monetary fee that the guest would incur in case of cancel-lation. Airbnb establishes four main cancellation policies8 named flexible, moderate,
strict, and no-refund, that respectively go from less to more aggressive measures, in order to handle the refund in case of canceling the reservation prior to arrival (one, five, seven days for the first three respectively), and grant a full refund for flexible/moderate policies, and a partial refund for the strict policy. Also, in less common circumstances, super-strict and longterm cancellation policies handle special cases, but are not con-sidered in this dissertation due to the very small number of lodgings that fall under these cancellation modalities.
As in the previous section, we consider the importance of conceiving the lodging’s features expressed in such a way that they leverage the context where lodgings are immersed. To this end, we normalized the review count rusing other lodgings’ review
8
Feature Description
r lodging’s review count
Ωstd Context review counts’ standard deviation
Ωmean Context review counts’ mean
b
r Normalized lodging’s review count
Table 3.4: PR features.
countsΩ, that are located at the surrounding area.9 In statistics, the z-score (standard
score normalization) is the distance, in terms of standard deviations from a given value (observation) to the mean (or sample mean). Therefore, we propose to use a set of review countsΩfrom other lodgings at the surrounding of each accommodation. From
Ωwe are able to obtain a sample standard deviation and a sample mean that we employ to calculate the z-score version of the review count as shown in:
b
r= r−Ωmean Ωstd
. (3.2)
Such z-score can be interpreted as how much positively/negatively popular is the lodging when compared to its local peers.
Finally, the statistics computed in this section (shown in Table 3.4) are included in our model. To conclude this section, the full list of features that fall under this category are detailed in Appendix A.2.
3.2.3
Price Sensitivity (PS)
Price sensitivity is the extent to which the price of a product affects consumers’ pur-chasing behaviors. Price is probably one of the most important factors, broadly and intuitively accepted to be a decisive motivator in consumers’ behavior and intentions. Donthu and Garcia [1999]; Shankar et al. [1999]; Degeratu et al. [2000] offer a good compound of relevant works related to online price sensitivity. Price sensitivity may vary from one customer to another, according to the level of importance that each customer places on price relative to other purchasing criteria. It has been shown that customer’s price sensitivity increases the more he or she is aware of the price disper-sion of a given product [Degeratu et al., 2000]. Therefore, we argue that Airbnb users may present a high degree of price sensitivity, as a direct consequence of the informa-tion displayed on their web interface10, which evidences the price dispersion, making it
highly transparent to Airbnb users. The last statement concretely refers to the price
9
Future sections detail the procedures to obtain 18 review counts of lodgings around any lodging in our dataset (Section 4.1.2), in order to compute the normalized review count.
10
3.2. Context-Aware 23
histogram at the Airbnb search tool (See Figure 3.2), which presents the dispersion of prices in an intuitive way. Originally, the histogram is intended to be used as a price filter. The filter is operated using two draggable slider buttons to set a custom price range that delimits minimum and maximum prices. Such histogram includes the mean price of the lodgings, aiming to guide the exploration of different prices.
Figure 3.2: Airbnb price histogram.
By themselves, lodging prices cannot be perceived as cheap orexpensive without their counterpart lodging prices. To obtain this vision of how a given price l$ stands among other prices, we propose two normalization that are similar to standard score normalization. Given a sample of nearby lodgings’ pricesC,11whereC
meanis the sample mean, and Cstd is the standard deviation of C. The first normalization is computed as shown in:
b
C$ =
l$− Cmean
Cstd
. (3.3)
In addition, assuming that the price mean Amean displayed at the Airbnb price histogram is the true population mean. We propose to change the centering factor in equation 3.3 by Amean. As defined in:
b
A$ =
l$− Amean
Cstd
. (3.4)
The price histogram draws a curve shaped by the lodging prices that are contained within the current search map. We assume that such histogram is built using all the lodgings contained in such area. In order to quantify the human interpretation of the histogram curve, we propose to compute the histogram’s kurtosis and skewness. Skewness is a statistic [Doane and Seward, 2011] intended to score the degree of curve symmetry and kurtosis [Darlington, 1970] measures whether the data is heavy-tailed or light-tailed relative to a normal distribution. In addition, from the sample prices C, useful statistics may be obtained, such as: lowest price, highest price, price standard deviation, price mean, kurtosis, and skewness as shown in Table 3.5.
11
Feature Description
Cmin Lowest price
Cmax Highest price
Cstd Prices’ standard deviation
Cmean Prices’ mean
Ckurt Price kurtosis
Cskew Price skewness
Amean Airbnb prices’ mean
Akurt Price kurtosis
Askew Price skewness
Table 3.5: PS features.
Finally, in Appendix A.3 we show the list of features that shape the concept of PS.
3.2.4
Perceived Authenticity (PA)
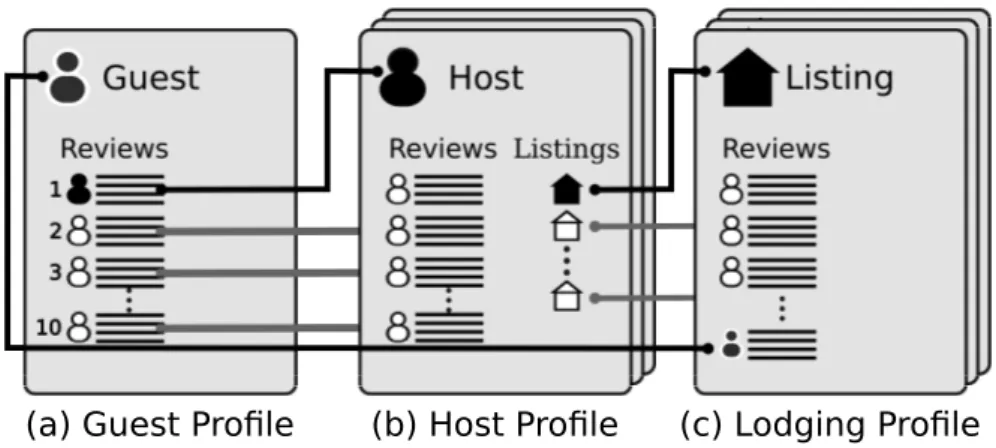
In Airbnb, the concept of perceived authenticity was previously defined to be the extent to which the foreigner guest feels like natively living at the lodging’s location where he or she stays. Guests solely rely on other guests’ reviews to create their own authenticity perception. On Airbnb, when a booking transaction is concluded, guests are asked to write a public review at the respective lodging and host profile, and similarly, the host is requested to write a review on the corresponding guest’s profile page. Hosts and guests are only able to see each other’s comment when both have their reviews published on their profile, promoting the reinforcement of the reviewers’ frankness.
We noticed that some reviews are very descriptive about discrete attributes of the lodging (e.g. cleanness, amenities, neighborhood characteristics). However, they are poorly informative about the guest’s experience as a whole, which could be more useful to characterize the concept of authenticity we defined in past chapters. To mimic the way reviews are used by users to sense the authenticity experience of a lodging, we propose to use information retrieval techniques to create a similarity score between the reviews (documents) and a hand built authenticity lexicon (query). To this end, we use a language modeling (LM) approach [Zhai, 2008] with Dirichlet smoothing [Zhai and Lafferty, 2004].
3.2. Context-Aware 25
are interpreted as the probability of a word (query) to be important to the corpus of a text (document). In this dissertation, PA scores are computed using ElasticSearch12
with standard text processing (Hunspell stemmer [Halácsy and Trón, 2006], lowercas-ing, and stopword removal) (Details in Appendix B.1).
Lexeme Review
living ... I felt that I amlivingthere ...
homey ... The apartment felt very safe andhomey... true ... It’s atrueSan Francisco experience ...
genuine ... heart warming, unique,genuineand inspirational time ... experience ... stay here if you want a real SFexperience...
Table 3.6: Lexemes examples.
A lexicon is an inventory of semantic units called lexemes, commonly composed of a collection of words. The construction of our PA lexicon was done in two stages: exploration and word-selection. The exploration stage aims to first select reviews con-taining the wordexperience, which we presume may comprise useful information about how guests experienced the authenticity of the accommodation, and not merely dis-crete attributes of the room. Then, the word-selection stage consists of reading a set of reviews in order to find words that usually appear when users expressed a positive notion of PA. Table 3.6 shows a few examples of such reviews and the lexemes selected to be part of our lexicon. The lexicon can be seen in Table B.1, which is composed of a set of 33 words.
In Appendix B.2, are shown the three reviews with the highest authenticity scores, to illustrate the effectiveness of this approach, which satisfactory exemplifies how the lexicon is able to grasp and quantify a sense of authenticity expressed in textual reviews.
Feature Description
Λmin lodging reviews’ lowest authenticity score
Λmax lodging reviews’ greatest authenticity score
Λmean Mean of lodging reviews’ authenticity scores
Λmed Median of lodging reviews’ authenticity scores
Λmean Skewness of lodging reviews’ authenticity scores
Λmed Kurtosis of lodging reviews’ authenticity scores
Table 3.7: PA features.
To characterize a lodging’s degree of authenticity, we aggregate their reviews’ scores, similarly to what we did in the previous sections, as shown in Table 3.7. Finally, the full list of features in this category is detailed at Appendix A.4.
12
3.2.5
Electronic-Word-of-Mouth (EWoM)
In previous chapters we explained the dynamics of how reviews are mutually cast between Airbnb entities involved in a booking transaction. When accommodations are offered in a peer-to-peer manner, usually guests write a review to hosts and their lodgings, and hosts reciprocally write a review to guests. On Airbnb, reviews are the most common manifestation of EWoM. Guests are aware that their personal opinion would help to frame the judgment of other users towards an approximation of the quality of the lodging. An opinion which expresses a positive attitude and satisfaction about the lodging would encourage the adoption of a positive feeling in other guests’ minds [Tsao et al., 2015]. We assume that this guest-to-guest information flow plays an important role in the decision process of booking a lodging.
A classical task in sentiment analysis is to derive the polarity of a text, which is understood as a sense of the positiveness or negativeness of the sentiment expressed on a textual form. Sentiment analysis include techniques commonly employed for the treatment of opinions, sentiments, and evaluations from written language, leveraging computational resources [Pang and Lee, 2008; Liu, 2012]. In this dissertation, we are interested in measuring the sentiment polarity of our reviews, rather than investigate the best technique for such task. Therefore, we decided to employ a robust technique for polarity sentiment analysis, as to the best of our knowledge, there is no study that investigates the performance of sentiment analysis methods using Airbnb guest’s reviews [O’Mahony and Smyth, 2009; Thelwall et al., 2012; Ribeiro et al., 2015].
Robustness is understood as the capability of generalizing the accuracy of some model, which is a property that is desirable when tackling unexplored domains [Ribeiro et al., 2015]. Vader [Hutto and Gilbert, 2014] is a robust state-of-the-art sentiment analysis technique, which extracts four polarity sentiment scores: positiveness, nega-tiveness, neutrality, and sentiment compound. The compound score is computed by aggregating and normalizing the other 3 scores. It has been demonstrated that Vader has a consistent accuracy performance in different test collections [Hutto and Gilbert, 2014; Ribeiro et al., 2015], which makes it a good candidate for sentiment polarity detection to be employed to score Airbnb reviews.
3.3. Contextual Learning 27
Feature Description
Υmin lodging’s Rev. Lowest sentiment score
Υmax lodging’s Rev. Greatest sentiment score
Υmean lodging’s Rev. Mean sentiment score
Υmed lodging’s Rev. Median sentiment scores
Υmean lodging’s Rev. Skewness of sentiment score
Υmed lodging’s Rev. Kurtosis of sentiment scores
Table 3.8: EWoM features.
3.3
Contextual Learning
The term Learning-to-Rank (L2R) refers to the application of machine learning in order to build ranking models for information retrieval tasks [Liu et al., 2009]. Despite L2R merely tackles information retrieval problems, L2R has already been applied in RS [Karatzoglou et al., 2013]. In order to tackle the lodging recommendation problem we resort to learning to rank [Liu et al., 2009], which is used to leverage the contextual models for lodging recommendation we presented in previous sections.
In particular, our goal is to learn a ranking model f : X → Y mapping the input space X into the output spaceY. Our input space includes n learning instances
{Xj~ }n
j=1, where Xj~ = Φ(uj, lj,Ij) is a feature matrix representation, produced by a feature extractorΦ, of a sample of lodgingsIj retrieved for useruj near target location lj. As described in Table 3.1, we consider a total of 176 features organized into five broad preference dimensions. In turn, our output space Y comprises n label vectors
{Yj~ }n
j=1, whereYj~ provides relevance labels for each lodging i∈ Ij.
3.4
Summary
In this chapter, we presented our proposed feature-based model, inspired by related theories of the sharing economy. Five sets of features, denominated as preference di-mensions, were created to quantify users’ repurchase intention, namely: price value, perceived risk, perceived authenticity, electronic-word-of-mouth, and price sensitivity. These features were built leveraging techniques of natural language processing, informa-tion retrieval, and feature engineering to describe how accommodainforma-tions are immersed in their surroundings. Also, the recommendation problem is tackled as a ranking problem, employing LambdaMART, a state-of-the-art L2R technique in information retrieval, capable of leveraging the features we created.
Chapter 4
Data Acquisition
In this chapter we explain the procedures undertaken to build the test collection we use in our experiments. Also, we provide a characterization of the collection, comparing two cities of interest in this study. The data was collected during the period comprised between March 2016 to September 2016 with a crawler distributed in 10 machines. Airbnb1 is a web application that permits users to list, search, and rent lodgings,
enabling guests to benefit from locals’ advice, having a genuine cultural exchange and a unique traveling experience. The dataset presented in this chapter is mainly comprised of public information available from Airbnb’s lodgings, their reviews, and their users’ profiles. This collection aims to simulate a user traveling and seeking for lodging in one of the two target cities we chose: New York, United States (NYC) and London, England (LON). This dataset constitutes a contribution to the recommender systems domain and was built to permit the evaluation of recommender systems for sharing economy platforms, with a particular focus on lodging recommendation.
4.1
Data Collection
4.1.1
City Macro-areas, Micro-areas, and lodgings
In order to explore places within the target cities where lodgings are located, we intro-duce the concept of macro-areas and micro-areas, which are suburban regions located in the cities. In conjunction, macro-areas and micro-areas aim to reproduce a repre-sentative overview of the true lodging supply in the city. Each micro-area belongs to a single macro-area, and macro-areas are composed of multiples micro-areas. These two concepts are similar to the concept of neighborhoods in an abstract way.
1
https://www.airbnb.com/
Figure 4.1: Airbnb’s search tool.
Airbnb’s search tool enables guest users to find lodgings that other hosts users rent on Airbnb (see Figure 4.1). The search tool is composed of a ranking list on the left-hand side and an interactive map on the right-hand side. To guide the selection of lodgings in our collection, we used Airbnb’s search tool to retrieve accommodations from NYC and LON. By querying the search tool for either NYC or LON, the map automatically is positioned in a way that it covers the entire city. As an incognito user (a user with no explicit identity or booking information) we fetched a set of 300 lodgings2 from the Airbnb’s website, where the sole information that was given to the
search tool was the name of the city. From this initial set of 300 lodgings in each city, NYC and LON, we only use their geo-location. Their emplacement can be viewed in Figure 4.2. Each one of these geo-location represents a macro-area (300×2in total).
We could eventually have chosen arbitrary points in the map that are uniformly distributed across the city. Instead, the intuition behind our approach is that by querying Airbnb’s search tool as an incognito user, we forced the Airbnb recommender engine to build a non-personalized recommendation of lodgings. This induces Airbnb to adopt a diversification strategy to recommend lodgings that best suit a broader set of macro-areas. As a consequence, this methodology has two main implications: (1) the search tool deliberately displays lodgings located at places commonly searched or booked by other users, and (2) it reflects Airbnb’s lodging supply density in the city, arguably producing more realistic recommendation scenarios, rather than employ
2
4.1. Data Collection 31
(a) 300 macro-areas in New York. (b) 300 macro-areas in London.
Figure 4.2: Distribution of macro-areas across the city.
a simpler criteria to guide the selection of macro-areas, for instance grid sampling. This implies that we have many macro-areas gathered closely together where users commonly tend to seek for lodging (for instance downtown or touristic places), while also covering a diverse set of other suburban locations detached from the mainstream, as observed in Figure 4.2.
City
(a) 300 Macro-areas within the city.
Macro-area
(b) Selection of 9 random geo-locations out of 300.
5
1 2 3
4 6
7 8
9
2km
Micro-area
(c) 300 ranked lodgings.
#1 #2
#300 #3
#4
#130
#37 #20 Macro-Area
2km
2km 2km
Figure 4.3: lodgings’ sampling procedure.
retrieved represent the actual micro-area, as illustrated in Figure 4.3 (c).
This process was followed with the purpose to get a more legitimized represen-tation of macro areas, as they would be represented by nine randomly chosen regions as opposed to a single arbitrary micro-area. Notice that by using the Airbnb’s search tool to retrieve the lodgings, we obtain a non-personalized ranking.3.
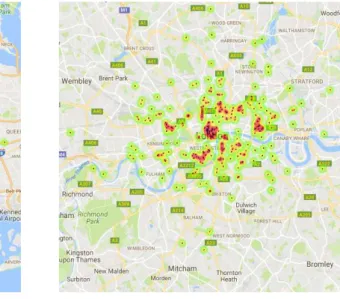
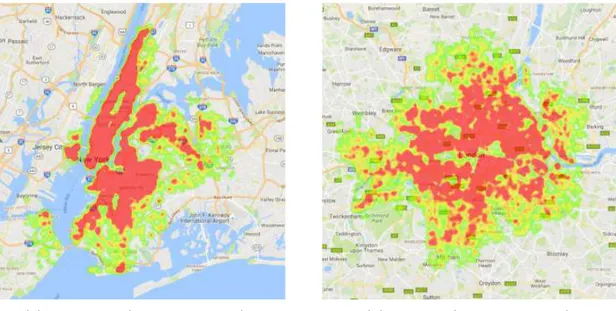
Finally, Figure 4.4 shows the lodgings’ density across the target cities we obtained in our collection. As observed in the figure, we obtain a high coverage of the geographic perimeter of both cities.
(a) New York (17,325 lodgings). (b) London (22,134 lodgings).
Figure 4.4: lodgings’ coverage at the target. cities.
For all of the lodgings in the dataset we crawled their profiles, which contain detailed information about their attributes and the reviews left from the guests that visited the respective lodging. In Table 4.1 we show a summary of the number of lodgings per target city and the number of visitors obtained from the reviews found on the lodgings’ profile pages (Table 4.1, #lodgings and #Reviews).
#lodgings #Reviews #Guests NYC 17,325 250,508 219,915 LON 22,134 266,743 223,106 Total 39,459 517,251 436,109*
Table 4.1: Test collection summary (* Unique items).
3