Priscila Pereira Coltri, Paulo Renato Lima, Andrea Koga-Vicente, Renata Ribeiro do Valle Gonçalves4
(Received: January 10, 2019; accepted: April 15, 2019)
ABSTRACT: In this research, we combine data analyses with hotspots method to identify the spatio-temporal trend of São
Paulo’s coffee cultivation area. Our hypothesis is that coffee cultivation area has been changing significantly in the study area since 1990. Therefore, the main goal of this research was to map the spatial pattern of coffee land use change. For coffee land use diagnostics, official data of cultivated area, hotspot analyses and growth rate were used. The results demonstrated that coffee cultivation area decreased and concentrated in smaller areas, which are traditionally recognized as “coffee quality regions”. The producer size analyses evidenced that, not only the localization, but also the producer profile changes as well. Smallholders increased but medium and large producers decreased significantly in the studied period. The coffee abandonment analyses demonstrated that, over the study period, 51.46% of the coffee area cultivated in the study region was abandoned.
Index terms: Land cover changes, hotspots, coffee abandonment.
MUDANÇA DO USO DO SOLO CAFEEIRO: O ESTUDO DE CASO DO ESTADO DE SÃO PAULO
RESUMO: Nesta pesquisa, combinou-se análise de dados com o método de hotspots para identificar a tendência
espaço-temporal da área de cultivo de café no estado de São Paulo. A hipótese é que a área cultivada com café vem se alterando significativamente no Estado desde 1990. Assim, o objetivo principal da pesquisa foi mapear o padrão espacial das mudanças no uso do solo cafeeiro. Para o diagnóstico do uso do solo do café, foram utilizados dados oficiais da área cultivada, análises de
hotspots e taxa de crescimento. Os resultados demonstraram que a área cultivada de café diminuiu e se concentrou em pequenas
áreas, que são regiões tradicionalmente reconhecidas por sua qualidade. As análises do tamanho do produtor evidenciaram que, não apenas a localização, mas também o perfil do produtor mudou. O número de pequenos agricultores aumentou no período estudado, enquanto os produtores médios e grandes diminuíram significativamente. As análises de abandono de área demonstraram que, ao longo do período estudado, 51,46% da área destinada ao plantio de café foi abandonada na região de estudo.
Termos para indexação: Mudança do uso do solo, hotspots, abandono de áreas cafeeiras. 1 INTRODUCTION
According to Smith (1985), coffee cultivation has begun in AD575 and the first documentation about this crop as we know it is by Razes, from the 10th century. Since then and over the centuries, coffee cultivation has become popular, turning into one of the most consumed beverages in the world. Brazil has dominated the position of largest coffee producers for over 150 years (ICO, 2018). Historically, São Paulo is a traditional coffee producer. However, this position has been lost over time, according to official data from the Brazilian Institute of Geography and Statistics.
Land use and land use changes (LULCC) are a result of complex interactions that involve social, ecological, political, industrial and economic drivers (KLEEMANN et al., 2017).
1Universidade Estadual de Campinas/UNICAMP) - Centro de Pesquisas Meteorológicas e Climáticas Aplicadas a Agricultura/
CEPAGRI - Cidade Universitária “Zeferino Vaz” - 13.083-970 - Campinas/SP- [email protected], [email protected]
2Universidade Estadual de Campinas/UNICAMP - Instituto de Geociências/ IG - Rua Carlos Gomes, 250 - Cidade Universitária
13.083-896 - Campinas - SP - [email protected]
3Embrapa Meio Ambiente - Plataforma ABC - Rodovia SP 340, Km 127,5, S/N - Tanquinho Velho - 13.820-000 - Jaguariúna - SP
Depending on the magnitude and dimension of these interactions, the result may be deeper than cultivation migration and include crop abandonment (SAMPER, 2010).
Assessing spatial changes pattern on adequate spatial data is essential to understanding future consequences and land system dynamics (KUEMMERLE et al., 2016). To analyze change pattern in the agriculture landscape, at different scales, remote sensing techniques are frequently used (GONÇALVES et al., 2012). For temporal evaluation, low spatial with high temporal resolution images are indicated because of the frequency of the data (ZULLO JUNIOR et al., 2014). However, according to Nogueira et al. (2015), recognizing coffee crops changes in low spatial and high temporal resolution images is not trivial because of the crop features and the planting
Coffee land cover changes analyses: a study case ... 132
Where, Pcur is the coffee planted area in the current year (2013) and Ppre is the planted area in the previous period (1990).
(ii) Hotspots Analysis: The hotspot mapping was carried out using the Gi* statistics (HARRIS et al., 2017; GETIS and ORD, 1992) in the ArcGis software to evaluate the coffee land use dynamics. In the analyze a vector is used to identify areas statistically significant with high or low similarity, called hot spots or cold spots respectively (LI et al., 2017). The Z score and the probability distribution of the z-scores (p-value) are calculated for each polygon (WANG et al., 2013). For statistically significant positive Z score, more intense is the clustering of high values (hot spot). On the other hand, the smaller is the Z score (statistically negative significance) more intensive the clustering of low values (cold spot). After that we combine these results with the arabica coffee traditionally quality regions of São Paulo, delimited by “Cafés do Brasil”.
(iii) Production Size: Coffee cultivated areas were divided into four size categories: a) abandoned area (zero hectares); b) smallholders (1-49ha); c) medium producers (50-499ha) and d) large producers (more than 500ha). The growth rate percentage was calculated, on an annual scale, using equations 2.
Where, present is 2013, past is 1990 and n = number of time periods
3 RESULTS AND DISCUSSION
Figure 1 shows the variation of coffee cultivated area in São Paulo State, over the study period. We observed that the cultivated area presents a significant reduction between 1990 and 1995. After that, between 1999 and 2009, the cultivation retraction presented another decrease and then, the reduction area remained stable until the end of the series. We could also verify these spatially changes in Figure 2. The green color in the maps represents the proportion of coffee cultivated area in each municipality of the São Paulo State. It was observed that, in 1990 (Figure 2a), at the beginning of the data series, coffee had a large spatial distribution by the state, which has been decreasing over the years (Figure 2b and c), aggregating in smaller areas. In the end of the series, in 2013, the spatial distribution was concentrated in the northeast and southwest of the state, as observed in Figure 2d.
pattern. As coffee is well adapted in mountain areas, identify the spectral information is difficult because of the shadows and spectral distortions.
Geostatistical techniques applied to soft data are a robust tool to coffee land use change analyses. Hotspot mapping has been widely used as analysis technique in order to identify spatial patterns of a phenomenon or an activity (PRASANNAKUMAR et al., 2011; WANG et al., 2013; LI et al., 2017). Specifically to land cover and uses changes studies (DURAISAMY et al., 2018), this method is used because it works considering not only the feature itself but also analyzing the neighbor features values and, to be identified as a statistically significant hotspots, a feature will have a high value and will be surrounded by other features with high values as well (KUEMMERLE et al., 2016).
Here, we combine data analyses with hotspots technique to identify the spatio-temporal trend of São Paulo’s coffee cultivation area. Therefore, the main goal of this research was to map the spatial pattern of coffee land use change in São Paulo state. Specifically, we asked for the following research question: a) Have coffee land use areas been changed since 1990? b.) Where was coffee planted in 1990 and where is planted today? c.) Have there been a change in cultivations size (smallholders, medium and large producers) from 1990 to nowadays?
2 MATERIAL AND METHODS
The methodological approach to this study that was carried out in São Paulo state, Southeastern Brazil, consisted into three phases, which are detailed in this section. All these analyses were done using the Brazilian Institute of Geography and Statistics – IBGE official data of coffee cultivated area from 1990 to 2013.
(i) Coffee Land Use Diagnostics: The data of coffee cultivated area were used and a database was created in Geographic Information System (GIS) software - ArcGis. We analyzed the data in whole state as well as in each municipality, using the Percentage Change Index (PCi), according to the equation 1 (BERRY, 1993). We spatialized the data to identify the coffee area.
(1)
FIGURE 1 - Coffee planted area (in hectares) in São Paulo State from 1990 to 2013.
FIGURE 2 - Coffee cultivated area in São Paulo State from 1990 to 2013. a) Coffee cultivated area in 1990; b) Coffee cultivated area in 1995; c) Coffee cultivated area in 1999; d) Coffee cultivated area in 2013.
Coffee land cover changes analyses: a study case ... 134
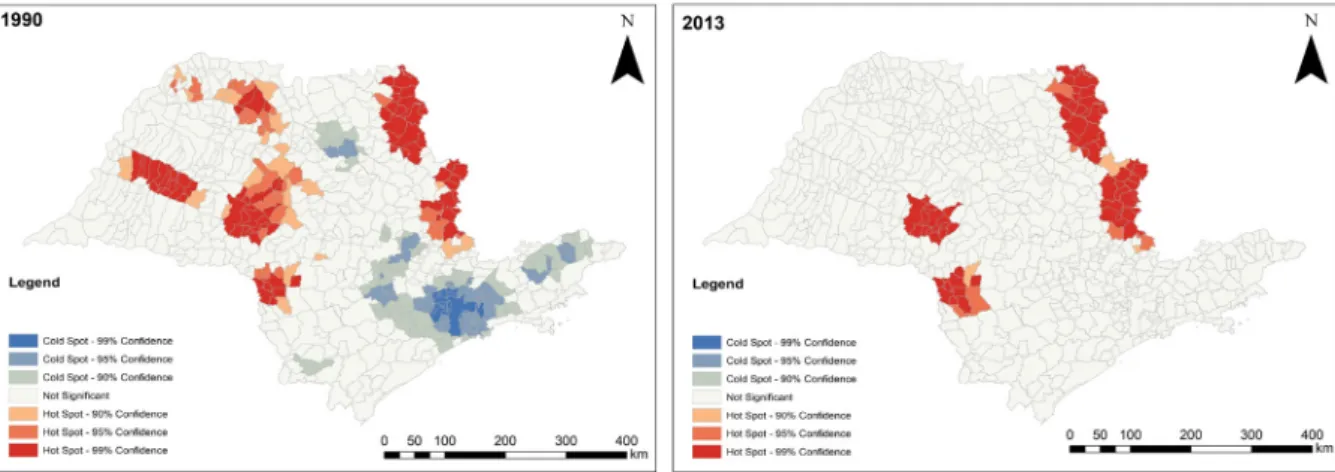
The spatial variation of coffee cultivated area between 1990 and 2013 may also be observed in the hotspots analyses, presented in Figure 3. The municipalities that appear in red are regions statistically significant positive with coffee cultivated area (hotspots), while the location in blue is characterized by region with no or almost no grain cultivation (cold spots), with a variation of 90 to 99% of confidence. It was confirmed that, over the years, the cultivated area decreased, and the blue areas, which represent this amplitude, also disappear from the map, evidencing both the expressive decrease in the coffee area in the state and the geographic modification of the area.
We also verified that the hotspots region concentrated in São Paulo regions: Alta Mogiana, Marília and Garça; and Ourinhos (Figure 4).
This is important because these localizations are considered “specialty coffee” region by the Brazilian Specialty Coffee Association, which means that the coffee produced there is a high-quality grain. Mogiana, for example, because of the high altitude, climate, and soil, is a traditionally recognized region by the quality. These results agree with the “Brazilian Association of Special Coffees”, which presented that while the expansion of the specialty coffee market reaches 15% a year, the conventional coffee grows only 3%.
The producer size analyses demonstrated that, not only the localization, but also the producer profile changes as well (Figure 5). Smallholders increased in the studied period, with an annual growth rate of 7.19%. On the other hand, medium and large producers decreased, with a rate of -1% and -8.34% respectively. The coffee abandonment
analyses demonstrated that, over the study period, 51.46% of the study region was abandoned, with an annual growth rate of 2.9%, corroborating with the spatial maps. Confirming to this data, the percentage change index showed that 346 municipalities of the São Paulo State, presented negative changes, indicating coffee cultivation retraction. Fifteen municipalities maintained the index and 42 increased the cultivation area. Similar results were found in Central America, specifically in Guatemala from 2000 to 2004 (HAGGAR et al., 2013) and Nicaragua (DONAVON et al. 2014) from 2005-2006, when coffee farmers reduced the investment in the cultivated area while others abandoned the crop because of an economic crisis. There are many drives related to coffee land use changes to be analyzed in future researches. Recently, researchers have hypothesized changes on the economy, commodities prices, coffee industry expansion, diseases, expansion of other crops, traditionalism, local infrastructure to coffee farmers, climate trends, etc, (BONGASE et al., 2017; HAGGAR et al., 2013 and DONAVON et al., 2014) may be important drivers to coffee land use changes. The results found here suggested that the magnitude of coffee land use changes between 1990 and 2013 in São Paulo state was serious when the attention is focused on abandonment area, because around 50% of the total coffee area was abandoned. On the other hand, the fact of the cultivation has been concentrated on high-quality regions and the smallholders have increased, demonstrated that the coffee cultivation appears to be more focused on quality than the quantity, following the “specialty coffee” tendency.
FIGURE 4 – Hotspots Coffee cultivated area (2013) and coffee quality regions (light blue = Alta Mogiana; dark blue = Media Mogiana; green = Ourinhos and Avaré; and yellow = Marília and Garça).
FIGURE 5- Annual Growth Rate (%) per group of producers (Zero ha = abandonment area, 1-49ha = smallholders, 50-499 ha = medium producers and >500 ha= large producers)
Coffee land cover changes analyses: a study case ... 136
4 CONCLUSION
In this research, we analyzed coffee land use change in São Paulo State from 1990 to 2013. The performed analyses confirmed the hypothesis that the profile of coffee cultivation in São Paulo state has been changing since 1990. We verified that coffee cultivation decreased and concentrated in small regions of São Paulo, most of them recognized as “quality region” as Alta Mogiana, Marília and Garça, and, Ourinhos. These changes are consistent with the market trends where specialty coffee expands five times more than traditional coffee. At the same time, smallholders increased in the period, medium and large producer’s size decreased. Coffee abandonment area increased significantly. Future efforts are necessary in order to classify and understand the importance of drivers to all of these changes, as their weight, in order to obtain a model of coffee land use change.
5 REFERENCES
BONGASE, E.D. Impacts of climate change on global coffee production industry: Review. American Journal of Agricultural Research, v. 12, n. 19, p. 1607-1611, May, 2017.
DONAVON, J. POOLE, N. Changing asset endowments and smallholder participation in higher value markets: Evidence from certified coffee producers in Nicaragua. Food Policy, v.44, p. 1-13, 2014. Doi: 10.1016/j. foodpol.2013.09.010
DURAISAMY, V., BENDAPUDI, R.; JADHAV, A. Environ Monit Assess, v. 190, p. 535, 2018. Doi:10.1007/s10661-018-6919-5
GETIS, A.; ORD, J.K. The analysis of spatial association by use of distance statistics. Geographical Analysis, v. 24, n.3, p. 189-206, 1992.
GONÇALVES, R.R.V.; ZULLO JUNIOR, J.; ROMANI, L.A.S.; NASCIMENTO, C.R.; TRAINA, A.J.M. Analysis of NDVI time series using cross-correlation and forecast methods for monitoring Sugar-cane fields in Brazil. International Journal of Remote Sensing, v. 33, n. 15, p. 4653-4672, 2012. Doi: 10.1080/01431161.2011.638334
HAGGAR, J.; MEDINA, B.; AGUILAR, R.M.; MUNOZ, C. Land Use Change on Coffee Farms in Southern Guatemala and its Environmental Consequences. Environmental Management, v. 51, n.4, p. 811-823, 2013. Doi: 10.1007/s00267-013-0019-7
HARRIS, N.L; GOLDMAN, E.; GABRIS, C.; NORDLING, J.; MINNEMEYER, S.; ANSARI, S.; LIPPMANN, M.; BENNET, L.; RAAD, M.; HANSEN, M. Using spatial statistics to identify emerging hot spots of forest loss. Environmental Research Letters, v.12, n.2, p.1-13, 2017. Doi: 10.1088/1748-9326/aa5a2f International Coffee Organization, ICO. Statistics. Available www.ico.org. 2018
KLEEMANN, J.; BAYSAL, G.; BULLEY, H.N.N.; FURST, C. Assessing driving forces of land use and land cover change by a mixed-method approach in north-eastern Ghana, West Africa. Journal of Environmental Management, v. 186, p 411-442, 2017.
KUEMMERLE T.; LEVERS, C.; ERB, K.; STEL, S.; JEPSEN, M.R.; MULLER, D.; PLUTZAR, C.; STUCK, J.; VERKEK, P.; VERBUG, P.H. Hotspots of Land use changes in Europe. Environmental Research Letters, v.11, n.6, p. 1-14, 2016. Doi: 10.1088/1748-9326/11/6/064020
LÄDERACH, P., RAMIREZ–VILLEGAS, J., NAVARRO-RACINES, C. et al. Climate change adaptation of coffee production in space and time. Climatic Change, v.141, n.1, pp. 47-62, 2017. Doi. 10.1007/s10584-016-1788-9
LI, Y.; ZHANG, L.; YAN, J.; WANG, P.; HU, N.; CHENG, W.; FU, B. Mapping the hotspots and coldspots of ecosystem services in conservation priority setting. J. Gorgr. Sci, v. 27, n.6, p. 681-696, 2017. Doi: 10.1007/s11442-017-1400-x
NOGUEIRA, K.; SCHWARTZ, W.R.; SANTOS, J.A. Coffee Crop Recognition Using Multi-scale Convolutional Neural Networks. In: Pardo A., Kittler J. (eds) Progress in Pattern Recognition, Image Analysis, Computer Vision, and Applications. CIARP 2015. Lecture Notes in Computer Science, vol 9423. Springer, Cham.
PRASANNAKUMARA, V.; VIJITHA, H.; CHARUTHAA, R.; GEETHAA, N. Spatio-Temporal Clustering of Road Accidents: GIS Based Analysis and Assessment. Procedia – Social and Behavioral Sciences, v. 21, p. 317-325, 2011. Doi: 10.1016/j. sbspro.2011.07.020
SAMPER, M. Costa Rica’s response to the coffee crisis. Latin American Perspectives, v. 37, n.2, p. 72–92, 2010.
SMITH R.F. A History of Coffee. In: Clifford M.N., Willson K.C. (eds) Coffee. Springer, Boston, MA. 1985. chap. 1, p. 1-13. Doi: 10.1007/978-1-4615-6657-1_1
ZULLO JUNIOR, J.; COLTRI, P.P.; GONÇALVES, R.R.V.; ROMANI, L.A.S. Multi-Resolution in remote sensing for agricultural monitoring: a review. Revista Brasileira de Cartografia, v. 66, p. 1517-1529, 2014.
WANG, D.; DING, W.; LO, H.; STEPINSKI, T.; SALAZAR, J.; MORABITO, M. Crime hotspot mapping using the crime related factors—a spatial data mining approach. Applied Intelligence, v.39, p. 772 -781, 2013.