Analysis of Changing Land Use Land Cover in Salinity Affected
Coastal Region
Vikrant Vijay Singh, Anupma Sharma
National Institute of Hydrology, Roorkee- 247667, India
ABSTRACT
Anthropogenic activities have induced many changes in land use over a period of three decades in a salinity affected semi-arid region of coastal Saurashtra in Gujarat. To overcome water scarcity and quality issues, efforts have been undertaken by state authorities to conserve and effectively use surface water resource to supplement the irrigation and domestic water requirements. Surface water schemes implemented in the area have altered the general land use conditions. In the present study, remotely sensed data coupled with ancillary data are used for analysing the land use-land cover change. Supervised classification and post classification techniques are employed to classify various land use-land cover classes and to detect changes, respectively. Landscape pattern change has been studied by analysing the spatial pattern of land use land cover classes structure. The results show that the region has experienced significant changes over a thirty year period. Growth in agricultural activities, policies developed to conserve freshwater runoff, and increase in built-up area, are the main driving forces behind these changes.
Keywords
– coastal region, change detection, GIS, land use, remote sensing, supervised classificationI.
INTRODUCTION
Coastal regions are widely sought after for industrial, agricultural and urban development activities. In the diverse landscape of coastal regions, an investigation of land use and land cover changes is useful in analyzing the developmental changes occurring over a time period. The spatial pattern of land use can reflect the changes brought about by human activities, including urbanization and socio-economic development policies [1]. Remote sensing techniques enable studying these changes in detail and provide the most current information compared to data obtained from statistical charts, topographic or land use maps. In recent times, the method of integrating landscape pattern metrics with Geographic Information System (GIS) and remote sensing has been widely used to characterize land use and landscape pattern dynamics both at basin scale and in urban areas [2,3,4,5].
In India, the western state of Gujarat has a long coastline of about 1,600 km. About 70% of its area is classified as semi-arid to arid [6], thus the demand on water for various economic activities puts a strain on the water supplies. The problem is severe in coastal arid and semi-arid areas where water resources are limited. Groundwater is the principle source of water supply for meeting the irrigation water requirements. Groundwater over-draft makes it susceptible to increased salinity levels due to sea water intrusion and localized saltwater upconing. Several remedial measures have been implemented in the region to recharge the groundwater as well as to conserve and effectively
use surface water resource to supplement the water requirements for irrigation and domestic purposes.
This study investigates a coastal area in Saurashtra region of Gujarat to study spatial and temporal changes of land use and land cover over a period of three decades between 1979 and 2009. The study was accomplished by comparing satellite image based interpretation of land use land cover conditions, and other ancillary data derived from Survey of India (SOI) toposheets and field surveys.
II.
STUDY AREA
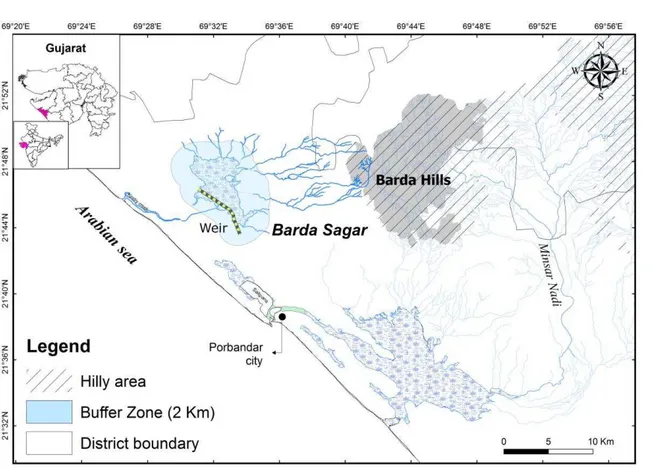
The Saurashtra region comprises the south western part of Gujarat state in western India. Many south-west flowing rivers exist in southern Saurashtra. Minsar river is an ephemeral river that originates in a village of Jamnagar district in the inland hilly region. It drains into the low lying Kerly Ghed area near the Arabian Sea coast in Porbandar district (Fig.1). In 1970s, different measures were initiated by the State Government at various sites to conserve freshwater runoff so as to meet water supply demands of the region as well as reduce groundwater salinity problems. Figure 1 shows the location of Barda Sagar, one of such sites, in Porbandar district. Barda Sagar, located north-west of Porbandar city, is a low lying flat region (previously termed Barda ‘Ghed’). It receives water from seasonal streams that originate in Barda Hills. Maximum water spread area of Barda Sagar is about 21 km2. Changes occurring over a period of three decades are studied in and around a buffer zone of 2 km from the boundary of this site.
Fig. 1 Map showing location of Barda Sagar with buffer area of 2 km around the site.
III.
MATERIALS AND METHODS
3.1 Data Sets
In order to study the changes in the above area, satellite images corresponding to scenes three decades apart were selected. These scenes were selected corresponding to years 1978-79 and 2008-09 with similar annual rainfall, 561 mm and 568 mm, respectively. The selected Landsat Satellite images acquired on 16-Jan-1979 and 30-Jan-2009, correspond to Multiple Spectral Scanner (MSS) sensor and Enhanced Thematic Mapper (ETM+) sensor, respectively. Changes among land use classes were studied for the Rabi season using three softwares ERDAS Imagine 9.1, ArcGIS 9.3 and Fragstats 4.2. Table 1 lists the data used and their characteristics.
Table 1. Dataset used for land use land cover classification
Data Details Year / Date
of Pass
Annual rainfall (mm) SOI toposheets 1:50,000
(41G-05, G-09, G-10, G-13, G-14, G-15)
1970 -
Landsat MSS* (60 m ) 16-Jan-1979 561
Landsat ETM+* (30 m) 30-Jan-2009 568
*MSS Multi spectral scanner, ETM Enhanced thematic mapper
The SOI topographic maps (scale 1:50,000) were used for geometric correction of the satellite images and for acquiring some ground truth information pertaining to interpretation of classes in 1979 satellite image.
3.2 Visual Interpretation
Accuracy in per-pixel registration of multi-temporal remote sensing data is essential for change detection. This is necessary to minimize registration errors that may be interpreted as land cover and land use change, leading to an overestimation of actual change [7]. Change detection analysis is performed on a pixel-by-pixel basis; therefore, any misregistration greater than one pixel will provide an anomalous result of that pixel. In this study, geometric correction is carried out using ground control points from topographic maps with scale of 1:50,000 produced in 1970 to geocode the image of 1979, and then this image was used to register the image of 2009. Root mean square (RMSE) error was found less than a pixel which is considered to be appropriate. RMSE defines a deviation of fitted-polynomial ground control point from real location value.
land cover classes. These classes are defined according to land use classification system adopted from NRSC classification system [8]. Table 2 shows the land use classes defined within the scope of present study. In total, 12 land use and land cover classes are defined.
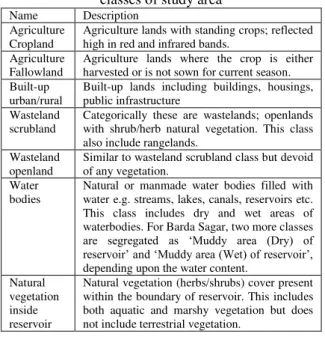
Table 2. Description of different land use land cover classes of study area
Name Description
Agriculture Cropland
Agriculture lands with standing crops; reflected high in red and infrared bands.
Agriculture Fallowland
Agriculture lands where the crop is either harvested or is not sown for current season. Built-up
urban/rural
Built-up lands including buildings, housings, public infrastructure
Wasteland scrubland
Categorically these are wastelands; openlands with shrub/herb natural vegetation. This class also include rangelands.
Wasteland openland
Similar to wasteland scrubland class but devoid of any vegetation.
Water bodies
Natural or manmade water bodies filled with water e.g. streams, lakes, canals, reservoirs etc. This class includes dry and wet areas of waterbodies. For Barda Sagar, two more classes
are segregated as ‘Muddy area (Dry) of reservoir’ and ‘Muddy area (Wet) of reservoir’,
depending upon the water content. Natural
vegetation inside reservoir
Natural vegetation (herbs/shrubs) cover present within the boundary of reservoir. This includes both aquatic and marshy vegetation but does not include terrestrial vegetation.
Satellite images were interpreted visually on the basis of shape, size, tone, texture, association, and other key elemental parameters. Landsat MSS image was available at 60 m coarse resolution. This limits the comparison with high resolution (30 m) images of Landsat ETM+. Therefore, in order to avoid any discrepancy in the results due to the resolution difference in between the two images, ‘resampling’ of MSS data to 30 m was carried out prior to interpretation.
3.3 Image Classification
The two images were classified for land use land cover classes listed in Table 2, for which the supervised classification technique was adopted. Supervised classification is a process of using samples of known identity to classify pixels of unknown identity. Samples of known identity are those pixels located within training areas defined by the analyst. Signatures for various land use and land cover classes were assigned to facilitate classification. Maximum likelihood algorithm was employed that classifies each pixel in an image on the basis of associated spectral signature. This methodology uses characteristics of the training data to assess probabilities that each of the unclassified pixels belong to each of the training data, and uses the probabilities to assign pixels to the most likely classes [9].
After classification, images were corrected manually by ‘recoding’ the pixel values. Often classes are not accurately classified due to the spectral similarities of two different features in an image. Same value or class is assigned to two different features. Therefore, after classification with the help of ground truth data, classes were corrected manually. Ground truth information was collected during field visits in 2010. Information related to land use land cover class, especially agriculture lands and waterbodies were collected. This information was used to manually correct results of classified image of 2009. In addition, data related to historical conditions were also collected from various government agencies (viz., Gujarat Water Resources Development Corporation Ltd., Gandhinagar; Salinity Ingress Prevention cell, Rajkot; Forest Department, Porbandar), and through local interactions and surveys to gage the severity of the water scarcity and salinity problem before the structural measures were taken up. Besides the SOI topographic map, the historical data was used in case of 1979 classified image to correct differences in class category.
3.4 Land Use Change Detection
Thematic maps on the basis of corrected classified images of years 1979 and 2009 were prepared following a common colour scheme. In this study, post-classification change detection technique is applied. Post classification is the most obvious method of change detection, which requires the comparison of independently produced classified images. Post-classification comparison proved to be the most effective technique, because here data from two dates are separately classified, thereby minimizing the problem of normalizing for atmospheric and sensor differences between two dates.
PLAND is quantified as proportional abundance of each patch type (class) in the landscape. AI is calculated from an adjacency matrix, which shows the frequency with which different pairs of patch types (including like adjacencies between the same patch types) appear side-by-side on the map. CONTAG measures aggregation that subsumes both dispersion and interspersion based on the probability of finding cell of type I class next to a cell type of class II. LSI is a measure of the change in the shape of the landscape. LSI increases as shape becomes more irregular over time. SHDI is a diversity index whose value increases as the number of different patch types increases or proportional distribution of area among patch types become more equitable. SHEI measures evenness in between classes such that an even distribution of area among patch types results in maximum evenness [10, 11].
IV.
RESULTS
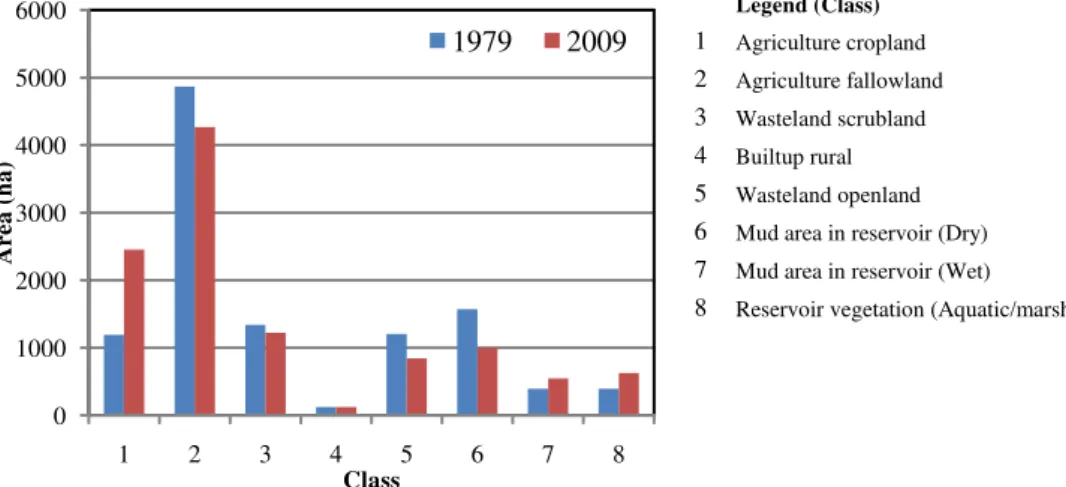
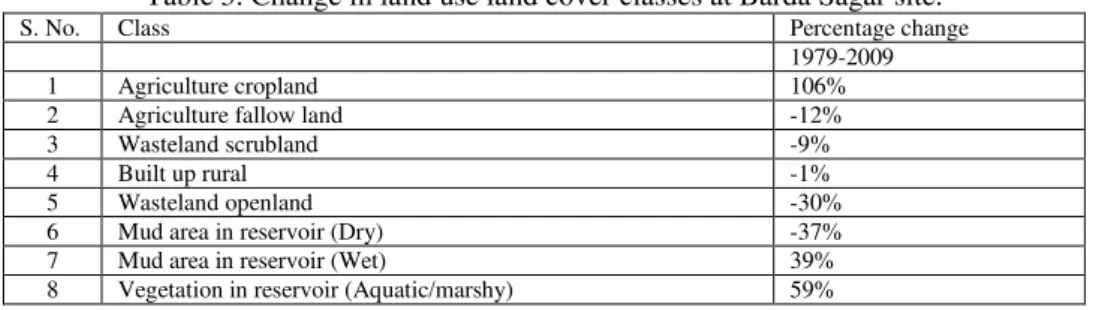
The land use and land cover class areas computed for Barda Sagar site are illustrated in Fig. 2 and corresponding percentage change is shown in Table 3. Both Fig. 2 and Table 3 reveal that agriculture cropland class experienced major positive change since 1979. Croplands have increased significantly by 106% with respect to 1979, while the fallow land shows a decrease of 12% for 2009 with respect to 1979. Mud area (dry) in reservoir has decreased by 37%, while mud area (wet) has increased by 39%. Wasteland open land shows a substantial decrease of 30%. Minor change is observed in built up rural (1%). Reason for these marked changes could be attributed to following: (a) Being a coastal region, groundwater quality is saline at deeper depths in this region. At shallow depths, groundwater is fresh especially during monsoon and post-monsoon. The thickness of this shallow zone of fresh groundwater fluctuates with
annual rainfall received in the coastal area. As the region falls under semi-arid climate and is prone to frequent droughts, crops in previous years could be cultivated only in a single season (Kharif). Construction of an embankment was initiated in 1974-1975 by the State Government in Barda Sagar to impound the freshwater runoff and convert this natural depressed land into a surface water reservoir that could be managed for supplementing local water demands for irrigation and domestic water supplies, through construction of canals and underground pipes. Thus, over the years with the laying of canals and pipes, the impounded runoff during monsoon season became available for longer period of time and could be utilized in non-monsoon season for cultivation of Rabi crop as well. This explains the increment in area of cropland class and steady decrease in fallow lands. It may be noted that in 1979, the construction work for the Barda irrigation scheme was ongoing and, therefore, the impacts of above structures in satellite image of 1979 are minimal.
(b) Prior to construction of the embankment, water was present in Barda Sagar in monsoon season and got dried up by November-December. But after construction of the structure, water in the reservoir remains available till February-March. This explains change in area of land cover class ‘Muddy area in reservoir’.
The spatio-temporal pattern of the landscape is quantitatively described below at landscape and class levels.
4.1 Landscape Metrics at Landscape Level Table 4 shows the change in landscape pattern metrics at landscape level between 1979 and 2009. Shannon’s diversity index (SHDI) increased from 1.48 in 1979 to 1.63 in 2009; Shannon’s Evenness Index (SHEI) increased from 0.71 to 0.78.
Legend (Class)
1 Agriculture cropland
2 Agriculture fallowland
3 Wasteland scrubland
4 Builtup rural
5 Wasteland openland
6 Mud area in reservoir (Dry)
7 Mud area in reservoir (Wet)
8 Reservoir vegetation (Aquatic/marsh)
0 1000 2000 3000 4000 5000 6000
1 2 3 4 5 6 7 8
Are
a
(
ha
)
Class
1979 2009
Table 3. Change in land use land cover classes at Barda Sagar site.
S. No. Class Percentage change
1979-2009
1 Agriculture cropland 106%
2 Agriculture fallow land -12%
3 Wasteland scrubland -9%
4 Built up rural -1%
5 Wasteland openland -30%
6 Mud area in reservoir (Dry) -37%
7 Mud area in reservoir (Wet) 39%
8 Vegetation in reservoir (Aquatic/marshy) 59%
The contagion index (CONTAG) reduced for 62.92% in 1979 to 57.41% in 2009. The Aggregation Index (AI) decreased from 97.46% to 94.95%. This change in the landscape pattern metrics during the study period indicates that spatial variability has increased in the study site. Moreover, the landscape pattern structure became more complex as discerned in the following landscape metric changes from 1979 to 2009: Landscape shape index (LSI) increased from 15.01 in 1979 to 28.13 in 2009. This indicates that shape complexity has become more irregular over time and fragmentation processes have strengthened. Human activities in the study site have resulted in landscape pattern fragmentation and more complex landscape structure.
4.2 Landscape Metrics at Class Level
Table 5 shows calculated landscape metrics at class level. The percentage of land is maximum
for agricultural lands including both croplands and fallowlands. They together constitute 56.15% in 1979 and 61.50% in 2009. This suggests that the agricultural lands remain dominant in both time periods and has increased since 1979. The impact of construction of the embankment has led to an increase water storage that enabled farmers to cultivate even in Rabi season.
Increase in PLAND of cropland since 1979 can be quantitatively described by change in the values of pattern metrics, LSI, and AI. LSI increased since 1979 in all the classes.
PLAND for fallow land and wasteland has decreased from 45.56 to 39.64 and 21.49 to 17.52, respectively. The proportion of land under fallow is replaced by cropland areas. Similarly, proportion of land under wastelands is replaced by fallow land over time. New agricultural lands are derived from unused wasteland. LSI and AI metrics indicates that both the classes undergo fragmentation.
Table 4. Landscape level metrics for Barda Sagar site
Year Total Area (ha) LSI CONTAG SHDI SHEI AI
1979 10926 15.01 62.9252 1.48 0.71 97.46
2009 10913.94 28.13 57.41 1.63 0.78 94.96
Table 5. Class level metrics for Barda Sagar site
Landuse Year Class Area (ha) PLAND LSI AI
Cropland 1979 1157.22 10.59 16.49 95.43
2009 2386.26 21.86 31.21 93.80
Fallowland 1979 4978.35 45.56 15.60 97.93
2009 4326.57 39.64 34.45 94.91
Wasteland 1979 2347.74 21.49 16.02 96.89
2009 1912.41 17.52 28.53 93.69
Urban 1979 87.21 0.80 3.99 96.76
2009 128.79 1.18 4.23 97.13
The increased PLAND of the urban area indicate increasing activities for built-up area and aggregation. The PLAND increased from 0.80 in 1979 to 1.18 in 2009. AI increased from 96.75 in 1979 to 97.12 in 2009 indicating increased connectedness between urban patches.
To summarize, changes in land use structure between 1979 and 2009 were distinctive in the landscape metrics analysis, although urbanization was not rapid. Over the study period, the change can be explained by land transformation and fragmentation of landscapes.
V.
CONCLUSIONS
decrease. A change in seasonal cropping pattern is observed, primarily due to increased surface water availability as an outcome of the developed irrigation schemes in the area. Minor change is observed in built up rural class. Landscape pattern metrics illustrate changes at both landscape and class level at the investigated site.
ACKNOWLEDGEMENTS
The authors would like to sincerely thank the Gujarat Water Resources Development Corporation Ltd. (GWRDC), Gandhinagar; Salinity Ingress Prevention Circle (SIPC), Rajkot; and Forest Department, Porbandar, for providing the relevant data utilized in this study. Field visits to the study area were undertaken during the Purpose Driven Study on ‘Coastal Groundwater Dynamics and Management in the Saurashtra Region, Gujarat’, carried out at the National Institute of Hydrology,
Roorkee in collaboration with GWRDC,
Gandhinagar. The study was funded by MoWR, RD & GR, GoI, under the World Bank assisted Hydrology Project Phase II.
REFERENCES
[1] C.L. Redman, C.L. Human dimensions of ecosystem studies. Ecosystems, 2, 1999, 516–526.
[2] A.P. Gautam, E.L. Webb, G.P. Shivakoti, and M.A. Zoebisch. Land use dynamics and landscape change pattern in a mountain watershed in Nepal. Agriculture, Ecosystems & Environment, 99, 2003, 83– 96.
[3] F. Kong, N. Nobukazu, H. Yin, and A. Kikuchi. Spatial gradient analysis of urban green spaces combined with landscape metrics in Jinan city of China. Chinese Geographical Science, 15(3), 2005, 245– 261.
[4] Y. Xie, M. Yu, Y. Bai, and X. Xing. Ecological analysis of an emerging urban landscape pattern—desakota: a case study in Suzhou, China. Landscape Ecology, 21, 2006, 1297–1309.
[5] X.J. Yu and C.N. Ng. Spatial and temporal dynamics of urban sprawl along two urban– rural transects: a case study of Guangzhou, China. Landscape Urban Planning, 79, 2007, 96–109.
[6] P.P. Patel. Ecoregions of Gujarat. Vadodara: Gujarat Ecology Commission, 1997.
[7] D.A. Stow. Reducing mis-registration effects for pixel-level analysis of land-cover change. International Journal of Remote Sensing, 20, 1990, 2477–2483.
[8] Land Use / Land Cover database on 1:50,000 scale, Natural Resources Census Project, LUCMD, LRUMG, RS & GIS AA, National Remote Sensing Centre, ISRO, Hyderabad, 2006.
[9] J.D. Bossler, J.R. Jensen, R.B. McMaster and C. Rizos (Eds.) Manual of geospatial science and technology (CRC Press, 2004).
[10] K. McGarigal, Fragstats Help.
http://www.umass.edu/landeco/ research/ fragstats/ documents/ fragstats.help.4.2.pdf (2014).
[11] V.V. Singh and A. Sharma. Land Use Land Cover Dynamics and Landscape Pattern Change Analysis in a Coastal Region, Gujarat. Proc. 20th International Conference on Hydraulics, Water Resources and River Engineering (HYDRO 2015 INTERNATIONAL), IIT Roorkee, India, 17-19 December, 2015.