310 G. N. JHAM ET AL.
Copyright © 2003 John Wiley & Sons, Ltd. Phytochem. Anal. 14: 310–314 (2003)
Phytochem. Anal. 14, 310–314 (2003)
Published online in Wiley InterScience (www.interscience.wiley.com). DOI: 10.1002.pca.721
Copyright © 2003 John Wiley & Sons, Ltd.
Received 25 March 2002 Revised 15 August 2002
Determination of the Triacylglycerol
Composition of Coffee Beans by Reverse-phase
High-performance Liquid Chromatography
Gulab N. Jham,*1 Boryana Nikolova-Damyavova,2 Mirtes Viera,1 Ricardo Natalino1 and
Augusto Cezar Rodrigues1
1Universidade Federal de Viçosa, Labarótorio de Pesquisas de Produtos Naturais, Departamento de Química, Viçosa, MG 36.570-000, Brazil 2Institute of Organic Chemistry, Bulgarian Academy of Sciences, 1113 Sofia, Bulgaria
Reverse-phase HPLC with refractive index and light scattering detectors in isocratic and gradient elution modes, respectively, was applied for the separation of the major triacylglycerols (TAG) in coffee lipids. Twelve TAG species could be identified and determined using a linear gradient of acetonitrile in dichloromethane: dichloroethane. The quantitative evaluation was based on the relative area percentages derived directly from a data-station. The procedure was applied to determine the TAG composition of three types of coffee beans har-vested in two coffee producing areas in Brazil and dried by two commonly used procedures. No significant differ-ences in the TAG compositions due to the type, origin and drying procedure were found. Copyright © 2003 John Wiley & Sons, Ltd.
Keywords: Reverse-phase HPLC; triacylglycerols; coffee beans; quality; storage; drying.
* Correspondence to: G. N. Jham, Universidade Federal de Viçosa, Labarótorio de Pesquisas de Produtos Naturais, Departamento de Química, Viçosa, MG 36.570-000, Brazil.
Email: [email protected]
Contract/grant sponsor: FAPEMIG.
Contract/grant sponsor: Bulgarian Scientific Fund; Contract/grant number: X-1009.
Contract/grant sponsor: CNPq.
the determination of the major TAG species in coffee samples.
EXPERIMENTAL
Coffee samples. About 10 kg of coffee beans (Coffea ara-bica L.; Catuaí Vermelho) were harvested in Machado or Viçosa (Minas Gerais, Brazil) by the ‘derriça’ method (that is beans were removed by hand from the tree and allowed to drop to the floor which had been covered with a cloth). From this population, a mixture of beans was obtained by separating 5 kg randomly. From the remainder of the population, the imma-ture and cherry beans were separated by placing the beans in a tank containing 50 L of water. The dry beans floated immediately and were removed, while the imma-ture and cherry beans remained at the bottom of the tank. After draining the tank, the immature and the cherry beans were separated by hand and allowed to dry in the air for 20 h. One portion of each of the samples of beans so obtained [i.e. random mixture (Viçosa beans only), immature and cherry] was dried separately in a conventional dryer at 40°C for 40 h to ca. 12% humidity. The other portion (Viçosa beans only) was dried on a patio for 10–12 days to a humidity of ca. 14%. In this way a total of eight bean samples (T1–T8) were obtained
(Table 1).
Extraction of lipids. Dried coffee beans were finely ground and extracted for 6 h in a Soxhlet extractor with hexane. The resulting extract was dried over anhydrous sodium sulphate, evaporated under reduced pressure at 35°C and stored in a freezer. TAGs were analysed either directly in the hexane extracts or following purification by preparative TLC on silica gel layers as described pre-viously (Nikolova-Damyanova et al.,1998).
INTRODUCTION
Most of the Brazilian coffee produced for internal consumption is considered to be of low quality, and a number of factors such as poor harvesting and post har-vesting practices (Informe Agropecuário, 1997), fungal contamination (Zambolin et al., 1996) and the presence of undesired composts (Spadone et al.,1990) have been suggested as possible causes. Although information concerning coffee lipids is very limited (Kaufmann and Hamsagar 1962; Nikolova-Damyanova et al., 1998; Jham
et al., 2001), these components have been considered to be associated with the low quality of the product perhaps due to the hydrolysis of triacylglycerols (TAGs) with the release of free fatty acids which are then oxidised (Multon et al., 1973; Wajda and Walczyk, 1978; Speer
et al., 1993).
Table 1. Key to the coffee bean samples (type, origin and treatment) analysed by RP-HPLC in the present study
Description of sample Treatment code
Immature coffee beans obtained in Viçosa and dried in a dryer T1
Random mixture of coffee beans obtained in Viçosa and dried on a dryer T2
Cherry coffee beans obtained in Viçosa and dried in a dryer T3
Immature coffee beans obtained in Viçosa and dried on a patio T4
Random mixture of coffee beans obtained in Viçosa and dried on a patio T5
Cherry coffee beans obtained in Viçosa and dried on a patio T6
Immature coffee beans obtained in Machado and dried in a dryer T7
Cherry coffee beans obtained in Machado and dried in a dryer T8
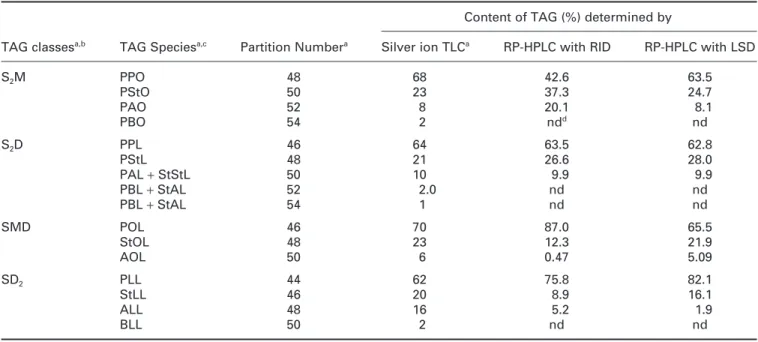
Table 2. Separation of TAG standards in individual classes by silver ion TLCand RP-HPLC using RID and LSD
Content of TAG (%) determined by
TAG classesa,b TAG Speciesa,c Partition Numbera Silver ion TLCa RP-HPLC with RID RP-HPLC with LSD
S2M PPO 48 68 42.6 63.5
PStO 50 23 37.3 24.7
PAO 52 8 20.1 8.1
PBO 54 2 ndd nd
S2D PPL 46 64 63.5 62.8
PStL 48 21 26.6 28.0
PAL + StStL 50 10 9.9 9.9
PBL + StAL 52 2.0 nd nd
PBL + StAL 54 1 nd nd
SMD POL 46 70 87.0 65.5
StOL 48 23 12.3 21.9
AOL 50 6 0.47 5.09
SD2 PLL 44 62 75.8 82.1
StLL 46 20 8.9 16.1
ALL 48 16 5.2 1.9
BLL 50 2 nd nd
a Based on Nikolova-Damyanova et al. (1998).
b S, saturated-; M, monoenoic-; D, dienoic fatty acid moiety.
c P, palmitic-; St, stearic-; A, arachidic-; B, bechenic-; O, oleic-; L, linolenic acid residue. d nd, not determined.
Preparation of TAG standards. The isolation of the main TAG classes from cherry coffee beans, namely S2D,
SD2, SMD and S2M [for abbreviations see footnote
(b) to Table 2] was performed by preparative silver ion TLC using TAGs isolated from cherry coffee beans (RB Tarandjiska, personal communication).
HPLC analysis. Gradient elution analysis was performed using a GBC (Victoria, Australia) model 1150 HPLC pump equipped with a Rheodyne (Rohnert Park, CA, USA) injector, an ACS (Macclesfield, UK) model 570/ 14 LSD, a Shimadzu (Kyoto, Japan) model CBM-101 work station and a Techsphere (HPLC Technology, Macclesfield, UK) ODS column (250 × 4.6 mm i.d; 5µM)
and guard-column (10 × 4.6 mm i.d; 5µM). TAGs were
eluted with a linear gradient of acetonitrile (solvent A) and dichloromethane:dichloroethane (8:2, v/v; solvent B; Nikolova-Damyanova et al., 1990) from 55:45 to 65:35 (A:B) in 40 min at a flow rate of 0.5 mL/min. Isocratic elution was performed using a Shimazdu model LC-6 AD HPLC system equipped with a Rheodyne injector, a Shimazdu model 10A RID, a Shimadzu model CBM-101 data acquisition system and a Techsphere ODS column and guard-column (as described above). TAGs were eluted with acetonitrile:acetone (1:1, v/v) at a flow
rate of 2 mL/min. The TAG standards and the oils obtained from the hexane extraction of coffee samples were dissolved in hexane (10µg/µL) and filtered prior to injection. Sample sizes of 10 and 20µL were injected for LSD and RID, respectively. The quantitative propor-tions of the individual components in the samples were derived directly form the data system as relative area percentages.
Statistics. The experiment was arranged in a completely random fashion involving eight treatments and three replicates for each treatment. The relative percentages of the TAGs were analysed statistically at the 5% signi-ficance level (Scott and Knott, 1974).
RESULTS AND DISCUSSION
The classes S2D, SD2, SMD and S2M of unsaturated
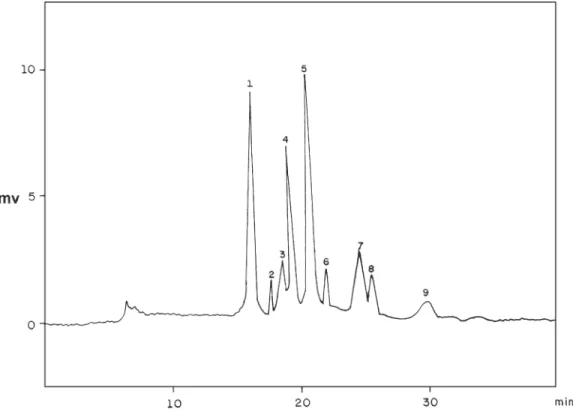
Figure 1. RP-HPLC chromatogram of the four major lipid classes S2M, S2D, SMD and SD2
de-tected by LSD following gradient elution. Key to peak identity: 1, PLL; 2, OOL; 3, StLL; 4, POL; 5, PPL; 6, POO + ALL; 7, PStL; 8, PPO; and 9, PStO. [For abbreviations see footnotes (b) and (c) of Table 2; for details of the chromatographic protocol see Experimental section.]
class was subjected separately to RP-HPLC using either isocratic elution mode with RID or gradient elution mode with LSD. Different mobile phases were tested and the most acceptable results were obtained with the solvents described in the experimental section. All of the expected TAG species, namely PPO, PStO and PAO (S2M class), PPL, PStL and PAL + StStL (S2D class),
POL, StOL and AOL (SMD class), and PLL, StLL, ALL (SD2 class) could clearly be detected using separate
standards [for abbreviations see footnotes (b) and (c) to Table 2]. As can be seen from Table 2, the relative area percentages of the TAGs varied depending on the de-tector employed. As expected, the values obtained by LSD typically agreed much better with previous results (Nikolova-Damyanova et al., 1998).
A typical HPLC-LSD chromatogram of a mixture of the four reference TAG classes (S2M, S2D, SMD
and SD2) obtained using a linear gradient of acetonitrile
in dichloromethane:dichloroethane is shown in Fig. 1. As can be seen, the number of peaks recorded was lower than expected due to peak overlap. Nine peaks could, however, be clearly separated and identified with the help of standards as (in order of elution) PLL, OOL, StLL, POL, PPL, POO + ALL, PStL, PPO and PStO. Using isocratic elution, only six peaks could be identi-fied, namely PLL, StLL + POL, PPL + OOL, ALL, StOL + PStL + POO and PStO. The detection of minor TAGs was not attempted owing to the limited amount of standards available. Furthermore, some of the minor peaks detected by TLC were not identified by RP-HPLC since appropriate standards were not available.
A requirement of our research programme was to evaluate a large number of coffee samples, and hence it was important to develop a rapid and easy method
for the separation and quantitative (%) evaluation of the major TAG species. Previous results have shown that the hexane extract consists of ca. 75% TAG together with free fatty acids, monoacylglycerols, diacylglycerols, terpene esters and free sterols (Nikolova-Damyanova
et al., 1998). Hence, it was important to know whether it was essential to purify the hexane extract prior to RP-HPLC analysis even though this would incur extra time and labour. TAGs from a coffee sample (treatment T3)
were, therefore, purified by TLC (Nikolova-Damyanova
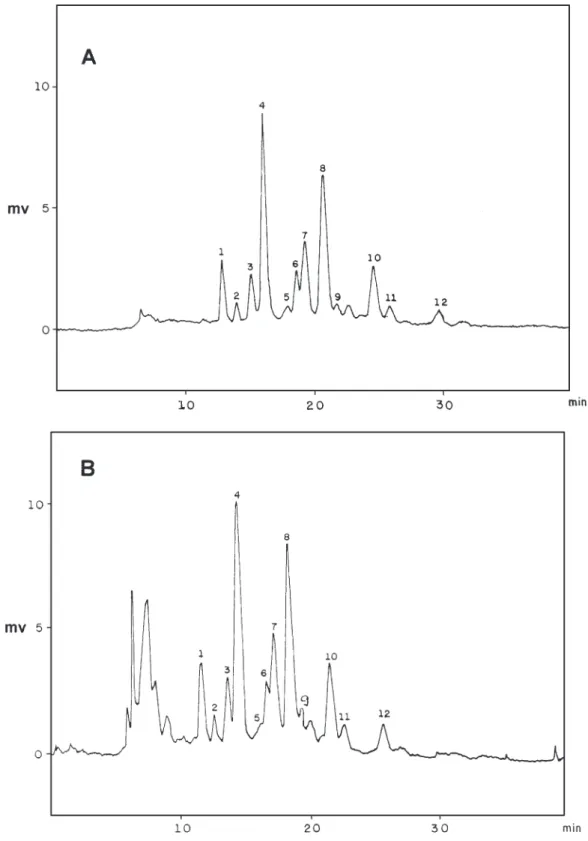
et al., 1998) and analysed by RP-HPLC using gradient elution and LSD. Comparison of this chromatogram (Fig. 2A) with that obtained directly from the crude hexane extract (Fig. 2B; see below) showed that the re-gion where the TAGs eluted was essentially the same. All further analyses were conducted using crude hexane extracts.
The typical HPLC-LSD chromatogram, obtained us-ing gradient elution, of a crude hexane extract of coffee beans (Fig. 2B) showed a clean, smooth base line with good resolution and apparently all major peaks could be easily identified. The analysis was quite reproducible, and 12 peaks representing LLL, StLLn, OLL, PLL, OOL, StLL, POL, PPL, POO + ALL, PStL + StOL, PPO and PStO could be determined. It should be noted that LLL, StLLn and OLL were only identified tentatively based on knowledge of the TAG composition of coffee (Nikolova-Damyanova et al., 1998) and literature data (Christie, 1987). With isocratic elution, only nine peaks could be identified as LLL, StLLn, OLL, PLL, StLL +
no significant effect (p > 0.05) of the method of dry-ing employed on the proportion of TAGs of immature coffee beans (treatments T1 and T4) or cherry coffee
beans (treatments T3 and T6). These results were in
agreement with previous findings (Jham et al., 2001). Although coffee drying processes have been extensively examined (Illy and Viani, 1995), few studies have been conducted on chemical changes accompanying the dry-ing procedure.
Figure 2. RP-HPLC chromatograms of (A) a purified TAG fraction, and (B) a crude hexane extract,
from a cherry bean coffee sample (T3) detected by LSD following gradient elution. Key to peak
identity: 1, LLL; 2, StLLn; 3, OLL; 4, PLL; 5, OOL; 6, StLL; 7, POL; 8, PPL; 9, POO + ALL; 10, PStL +
StOL; 11, PPO; and 12, PStO. [For abbreviations see footnote (c) of Table 2; for details of the chro-matographic protocol see Experimental section.]
Effects of bean type, drying procedures and origin on the TAG composition
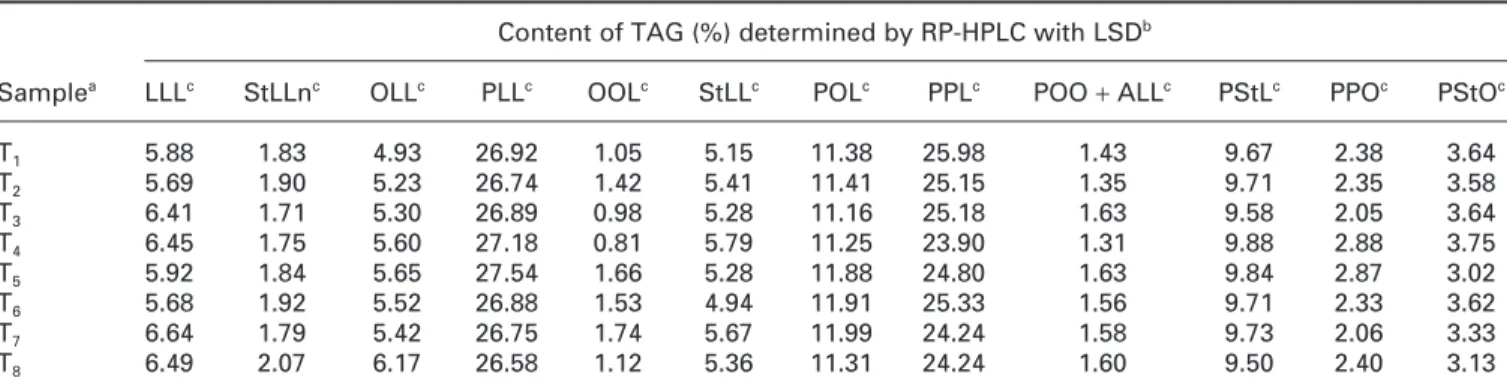
No significant effect (p > 0.05) of bean type was observed (Table 3) in the proportion of the TAGs identified in this study (i.e. LLL, StLLn, OLL, PLL, OOL, StLL, POL, PPL, POO + ALL, PStL, PPO and PStO) for sam-ples obtained in Viçosa (treatments T1–T3; T4–T6) and
Table 3. TAG composition of the hexane extracts of eight coffee samples determined by RP-HPLC with LSD
Content of TAG (%) determined by RP-HPLC with LSDb
Samplea LLLc StLLnc OLLc PLLc OOLc StLLc POLc PPLc POO
+ ALLc PStLc PPOc PStOc
T1 5.88 1.83 4.93 26.92 1.05 5.15 11.38 25.98 1.43 9.67 2.38 3.64
T2 5.69 1.90 5.23 26.74 1.42 5.41 11.41 25.15 1.35 9.71 2.35 3.58
T3 6.41 1.71 5.30 26.89 0.98 5.28 11.16 25.18 1.63 9.58 2.05 3.64
T4 6.45 1.75 5.60 27.18 0.81 5.79 11.25 23.90 1.31 9.88 2.88 3.75
T5 5.92 1.84 5.65 27.54 1.66 5.28 11.88 24.80 1.63 9.84 2.87 3.02
T6 5.68 1.92 5.52 26.88 1.53 4.94 11.91 25.33 1.56 9.71 2.33 3.62
T7 6.64 1.79 5.42 26.75 1.74 5.67 11.99 24.24 1.58 9.73 2.06 3.33
T8 6.49 2.07 6.17 26.58 1.12 5.36 11.31 24.24 1.60 9.50 2.40 3.13
a See Table 1 for sample description and treatment. b
P, palmitic-; St, stearic-; A, arachidic-; B, bechenic-; O, oleic-; L, linolenic acid residue.
c Mean value (n
= 3); values in each column showed no significant differences at 5% probability by the Scot–Knott test.
vidual TAGs in coffee samples and found that there was no influence of bean maturity, drying procedure and geographic origin on the TAG composition. The impli-cations of these findings with respect to beverage quality are presently not clear.
Acknowledgements
The authors would like to thank the Brazilian agencies (FAPEMIG) and the Bulgarian Scientific Fund (project X-1009) for their partial financial support. Fellowships to GNJ and ACR from the Brazilian agency CNPq are also gratefully acknowledged.
Further, no significant effect (p > 0.05) of origin of coffee was observed in the proportion of the TAGs of immature coffee beans (treatments T1 and T7) and cherry
coffee beans (treatments T3 and T8), even though
Machado and Viçosa are known to produce coffee of good and poor quality, respectively. It was not possible to compare these results with literature data since no similar experiments have been conducted with coffee.
In conclusion, although lipids are known to play an important role in the quality of several crops such as soybean, cacao, nuts, there is no such evidence in coffee in spite of speculations of involvement of lipids in coffee quality. We have determined for the first time the
indi-REFERENCES
Christie WW. 1987. High Performance Liquid
Chromatogra-phy and Lipids. Pergamon Press: Oxford.
Illy A, Viani R. 1995. Expresso Coffee: The Chemistry of Qual-ity. Academic Press: London.
Informe Agropecuário. 1997. Qualidade do Café18: 1–76. Jham GN, Velikova R, Muller H, Nikolova-Damyanova B,
Cecon PR. 2001. Lipid classes and triacylglycerols in cof-fee samples from Brazil: effects of cofcof-fee type and drying procedures. Food Res Int 34: 111–115.
Kaufmann HP, Hamsagar RS. 1962. Zur Kentnis der Lipoide der Kaffeebohne. I: Ueber Fettsaure des Cafestols. Fette
Seifen Anstrichmittel64: 206–213.
Multon JL, Poisson B, Cachaginer M. 1973. Evolution de plusieurs caratéristiquers d’un café Arabica au cours d’un stockage expérimental effectuéà 5 humidités relatives et 4 températures différentes. Proceedings of the 6th ASIC
Colloquium; 268–277.
Nikolova-Damyanova B, Christie WW, Herslof B. 1990. The structure of the triglycerides of meadowfoam oil. J Am
Oil Chem Soc67: 503–507.
Nikolova-Damyanova B, Velikova R, Jham GN. 1998. Lipid classes, fatty acid composition and triacylglycerol molecular species in crude coffee beans harvested in Brazil. Food Res Int31: 479–486.
Scott AJ, Knott MA. 1974. A cluster analysis method for grouping means in the analysis of variance. Biometrics 30: 507– 512.
Spadone JC, Takeoke G, Liardo, R. 1990. Analytical investi-gation of rio off-flavour in green coffee. J Agric Food
Chem 38: 226–233.
Speer K, Sehat N, Montang A. 1993. Fatty acids in coffee.
Pro-ceedings of the 15th ASIC Colloquium; 583–592.
Wajda P, Walczyk D. 1978. Relationship between acid values of extracted fatty matter and age of green coffee bean. J
Sci Food Agric29: 237–380.
Zambolim L, Sondhal M, Fernandes NT. 1996. Microorganis-mos associados à qualidade de bebida de café. In
Rela-tório Anual Sobre a Qualidade da Bebida. Universidade