Universidade do Minho Escola de Engenharia
Departamento de Informática
António Carlos Fortuna Ribeiro Dias
Development and implementation of bioinformatics
tools for the reconstruction of GiSMos
Universidade do Minho Escola de Engenharia
Departamento de Informática
António Carlos Fortuna Ribeiro Dias
Development and implementation of bioinformatics
tools for the reconstruction of GiSMos
Thesis dissertation
Master Degree in Bioinformatics
Supervisors
A C K N O W L E D G E M E N T S
Este trabalho não seria possível sem um grande grupo de pessoas que me apoiou durante este ano, e por eles reservo esta primeira secção do trabalho, em forma de agradec-imento.
Em primeiro lugar, um grande obrigado ao meu orientador Oscar Dias, que com mais paciênia do que seria de esperar, que além da realização de um bom trabalho se certificou que de eu de facto terminaria este ano a saber muito mais do que no início, e que alargasse as minhas áreas de conforto.
A todos os meus colegas de mestrado, que de uma forma ou de outra contribuiram para manter um rumo objectivo, especialmente aos que mais de perto trabalharam comigo, Bruna, Pedro, José, Fernando, e também ao Davide e Rentao pela colaboração nos seus projetos.
Aos membros do grupo Bisbii, que apesar de apenas ser convidado nos seus espaços e convívios, sempre me fizeram sentir que fazia parte de algo.
Por fim, e não menos importante, aos meus pais e irmãos, por aturarem toda a trabalheira que um estudante dá, e à minha namorada Catarina, por me obrigar a escrever quando chegou a hora.
A B S T R A C T
The reconstruction of Genomic-Scale Metabolic Model (GiSMo)s is an increasingly growing methodology, which allows to develop models that can be used to perform in
sil-ico predictions on the phenotypical response of an organism to environmental changes and
genetic modifications. These predictions allow focusing in vivo experiments on methodolo-gies that will, theoretically, present better results, thus reducing the high costs on time and money spent in laboratorial experiments. GiSMos are a mathematical representation of the organism’s genome, in the form of metabolic networks. As complex as these can be, because of the large number of compounds involved in many different reactions and pathways, the treatment of all such data is not easily manually performed.
Several bioinformatics software were developed with the aims of improving this pro-cedure, by automating many operations in the reconstruction process. Metabolic Models Reconstruction Using Genome-Scale Information (merlin) is one of such tools, following a philosophy that thrives on providing an intuitive and powerful graphical environment, to annotate data on key metabolic components and building a complete genome-scale model.
While already encompassing a wide range of tools, it is still a work in development. Upon analyzing its functioning, several improvement opportunities were identified, mainly in existing operations. Moreover, missing important features for the reconstruction of GiSMos were as well identified.
This work details the results of this analysis and the improvements performed to enrich merlin’s toolbox.
R E S U M O
A reconstrução de modelos metabólicos à escala genómica (GiSMo) é uma metodolo-gia em rápido crescimento, que permite o desenvolvimento de modelos para fazer previsões
in silico sobre a resposta fenotípica de um organismo a alterações ambientais e a
mod-ificações genéticas. Estas previsões permitem a focagem em experiências in vivo e em metodologias que, em teoria, apresentarão melhores resultados, e portanto reduzir os ele-vados custos em tempo e dinheiro gastos em experiências laboratoriais. GiSMos são uma representação matemática do genoma de um organismo, em forma de redes metabólicas. Devido à complexidade que estas podem ter, devido ao elevado número de compostos en-volvidos em muitas reações em diferentes redes, o tratamento de todos estes dados não é simples de ser feito manualmente.
Vários softwares bioinformáticos foram desenvolvidos com o objectivo de melhorar o procedimento, automatizando várias operações do processo de reconstrução. merlin é uma dessa ferramentas, e segue uma filosofia que prospera em providenciar um ambiente gráfico intuitivo e eficaz, para anotar informação de componentes metabólicos chave e construir a partir dela um modelo à escala genómica completo.
Apesar de já conter uma grande variedade de ferramentas, ainda está em fase de desenvolvimento. Ao ser analisado o seu funcionamento, foram apontadas várias operações passíveis de ser melhoradas. Também foram indentificadas em falta funcionalidades impor-tantes par a resconstrução de GiSMo. Este trabalho detalha os resultados desta análise e o que foi feito para enriquecer a caixa de ferramentas do merlin.
C O N T E N T S
1 introduction 1
1.1 Context and Motivation 1
1.2 Goals 2
1.3 Structure of the Document 2
2 state of the art 4
2.1 Genome-scale metabolic models 5
2.2 Online databases 5
2.3 Model reconstruction 6
2.3.1 Genome annotation 7
2.3.2 Assembling the metabolic network 8
2.3.2.1 Gene-Protein-Reaction (GPR) 8
2.3.2.2 Stoichiometry 9
2.3.2.3 Compartmentalization 9
2.3.2.4 Manual curation 9
2.3.3 Converting the metabolic network to a stoichiometric model 10
2.3.3.1 Biomass formation abstraction 10
2.3.3.2 Other constraints 11
2.3.4 Validation 11
2.4 Metabolic models reconstruction software 12
2.4.1 Available tools 12 2.4.1.1 ModelSEED 12 2.4.1.2 MEMOSys 13 2.4.1.3 SuBliMinaL Toolbox 13 2.4.1.4 FAME 13 2.4.1.5 GEMSiRV 13 2.4.1.6 Pathway Tools 14 2.4.1.7 MicrobesFlux 14 2.4.1.8 RAVEN Toolbox 14 2.4.1.9 CoReCo 15
2.4.2 merlin 15
2.5 Other tools 16
2.5.1 AIBench 16
2.5.2 OptFlux 17
3 pipeline improvement analysis 18
3.1 Load enzymes annotation 18
3.1.1 Blast reports 18
3.1.2 Load annotation files 19
3.2 Enzymes annotation curation 19
3.3 Views 20 3.3.1 Transporters annotation 20 3.3.2 Compartments annotation 21 3.4 Reversibility 21 3.4.1 Current methods 22 3.4.2 Thermodynamic analysis 23 3.4.3 eQuilibrator 25 3.4.4 ModelSEED templates 25
3.5 From merlin to OptFlux 25
3.6 Improved schema 26
4 feature development and results 28
4.1 Software back-end improvements 28
4.1.1 Database API architecture re-structure 28
4.1.2 Relational schema and table renaming 29
4.1.3 Configuration reader 30
4.1.4 Create project GUI 30
4.2 Load blast report 31
4.3 Load genome annotation from files 31
4.3.1 GFF loader 32
4.3.2 GenBank loader 33
4.4 Enzymes annotation auto select 33
4.5 Creation of annotation visualizers 35
4.5.1 Transporters View 36
4.5.2 Compartments View 39
4.7 Integration with OptFlux 43
5 conclusions and future development 46
L I S T O F F I G U R E S
Figure 1 GiSMo reconstruction schema 7
Figure 2 Improved merlin schema 27
Figure 3 Load BLAST report panel 31
Figure 4 Enzymes annotation sample selection window 34
Figure 5 Enzymes annotation α selection results 35
Figure 6 Transporters annotation view example and alignment panel 37 Figure 7 Transporters annotation information panels 39
Figure 8 Compartments annotation view example 41
Figure 9 Correct reversibility panel 43
Figure 10 Database schemas 44
Figure 11 New H2 database schema 44
L I S T O F TA B L E S
Table 1 Referenced databases, containing relevant data for the
reconstruc-tion of GiSMos 6
Table 2 Before and after names of internal database schemas and its
A C R O N Y M S
API Application Programming Interface.
BKM-react BRENDA, KEGG, MetaCyc reactions. BLAST Basic Local Alignment Search Tool. BRENDA Braunschweig Enzyme Database.
CoReCo Comparative Reconstruction.
EC Enzyme Commission.
FAME Flux Analysis and Modeling Environment. FBA Flux Balance Analysis.
GEMSiRV Genome-scale Metabolic Model Simulation, Recon-struction and Visualization.
GFF Generic Feature Format.
GiSMo Genomic-Scale Metabolic Model. GLPK GNU Linear Programming Kit. GPR Gene-Protein-Reaction.
GSMN Genomic-Scale Metabolic Network. GUI Graphical User Interface.
HMMER hidden Markov models.
JDBC Java Database Connectivity.
MEMOSys Metabolic Model research and development System.
merlin Metabolic Models Reconstruction Using Genome-Scale Information.
MOMA Minimization of Metabolic Adjustment.
NCBI National Center for Biotechnology Information.
PGDB Pathway/Genome Database. PHP Hypertext Processor.
RAST Rapid Annotations using Subsystems Technology. RAVEN Reconstruction, Analysis and Visualization of
Metabolic Networks.
REST Representational State Transfer. ROOM Regulatory On-Off Minimization.
SBML Systems Biology Markup Language. SQL Structured Query Language.
TAD Transporters’ Annotations Database. TC Transporter Classification.
TCDB Transporter Classification Database.
TRIAGE Transport Reactions Annotation and Generation.
1
I N T R O D U C T I O N
1.1 context and motivation
Accompanying the growth of the world wide web, and the increased capacity of processing, analyzing, and storing big data, a multitude of web-based biological databases have been created over the past two decades, providing a wide range of easily accessible data, and improving the ease of sharing research results between scientists from many places and various work fields.
As a new and ever-expanding area, supported by biological engineering, biochemistry and applied informatics knowledge, the reconstruction of Genomic-Scale Metabolic Model (GiSMo)s is proving to be a crucial step-forward to researchers all over the world, providing information of great significance on a large variety of organisms. Moreover, the amount of high-quality models is rapidly growing, due to the increasing availability of bioinformatics tools, databases and complementing literature.
One of said tools is Metabolic Models Reconstruction Using Genome-Scale Informa-tion (merlin), in-house built in University of Minho. With a clean and intuitive interface, accompanies anyone that wants to create a model, performing every step to transform a genome sequence into a Systems Biology Markup Language (SBML) file containing a fully functional and well annotated biochemical network, of every reaction that takes place in an organism. This can then be stored and used to perform in silico predictions on the prototypical behavior of the organism.
As part of the a previously developed project, this tool has already had improvements.
merlin stored all of its internal data in relational MySQL databases, which despite being
powerful and have vast functionality, rely on Internet protocols to execute commands between the database and merlin’s platform. This process is somewhat slow and overall more complicated for users with fewer informatics knowledge. With the implementation
of H2 relational database into merlin’s system, the data can now be stored locally on the users machine, requiring no external connections.
During the aforementioned project, and when getting to know the programmatic and overall functioning of the tool, it was noticed that there were several key-points of possible improvement in the work-flow of the application, as well as new features that could add functionality to it. This dissertation details the analysis that resulted from it and the following development and implementation of the proposed improvements.
1.2 goals
The main goal of this work is the development and implementation of new bioinfor-matics based tools, to be bundled in merlin software, in order to improve the speed and reliability of the models drafted using its resources.
In detail, the aim is to perform the follow approaches:
• Reading relevant literature to achieve a major understanding of the state-of-the-art methods
• Development and implementation of new operations to expedite the development of models in merlin
• Perform validation of implemented tools, showing examples of its usage in merlin projects
1.3 structure of the document
The document is organized as follows: • Chapter 2: State of the Art
– Introduction to systems biology and metabolic models – Overview on online biological databases
– Steps in the reconstruction process of a model – Available software to create models
• Chapter 3: Pipeline Improvement Analysis
– Run through the key points identified to be worked on – Tools to be improved
– Features to be developed – Improved schema
• Chapter 4: Feature Development and Results – Back-end improvements on the software – Overview on the improvement processes
– Description of the methodologies on the new tools – Graphical presentation of the final products • Chapter 5: Conclusions and Future Development
– Summary of development – Conclusion on the final product – Future development options
2
S TAT E O F T H E A RT
Organic systems and biology have been together in science going as far as 1915 (Dias and Rocha, 2015). That connection, as accepted as it was, was made formal with the introduction of the general system theory, by Ludwig von Bertalanffy in 1950, that stated that ”… organismic conceptions have evolved in all branches of modern biology which assert the necessity of investigating not only parts but also relations of organization resulting from a dynamic interaction and manifesting themselves by the difference in behavior of parts in isolation and in the whole organism” (Von Bertalanffy, 1972).
As an emerging approach to biological scientific research using engineering methods, systems biology focus on making sense of biological systems on a systematic level, by trying to understand these on a mathematical and computational level (Kitano, 2002). The objective is not as much to understand the genes, proteins as components of an organism, but rather on how each part of the system interacts and connects with each other, how such networks are formed and how to gain control over their functioning and proprieties.
The amount of biological and experimental data being outputted by technologies associated with systems biology, has massively increased during the last decades, making storage and analysis of such information a major field for biological studies. Hence, com-putational methods are being applied in biology, and systems biology does just that by using cutting-edge technological advancements to achieve automation on analytical studies (Kitano et al., 2001), combining both fields to achieve the goal of solving how systems work in their core.
So, the main goal of systems biology is to achieve better and deeper understand-ing of livunderstand-ing organisms. The reconstruction of a GiSMo provides a platform to perform simulations over the systems network of biochemical reactions of an organism.
2.1 genome-scale metabolic models
Making use of the widely available online information, on whole-genome sequences as well as biochemical reactions, freely achievable in several biological databases, it is fairly easy to create Genomic-Scale Metabolic Network (GSMN), for almost every organism, even those that haven’t been subject to thorough studies (Dias and Rocha, 2015). These net-works are the combination of all biochemical reactions that result from the enzymes present in the genome of an organism. Information can be gathered on the compounds that inter-vene is the reactions promoted by these enzymes, compounds that are consumed/produced, and also the relation between reactions. Every different approach for reconstructing GSMN requires the knowledge of the compounds that work as substrates and products, as well as the correct stoichiometry, reversibility status and cellular location, for each one of the reactions that belong in the network.
Whereas GSMN allow understanding the organism’s physiological and chemical char-acteristics, GiSMos are commonly used to perform in silico predictions on how the organism would react to changes in environmental and/or genetic modifications. The latter recon-structions allow making predictions on the organism’s phenotype, based on information contained in its genome, thus providing high confidence in the results obtained from the simulation(Thiele and Palsson, 2010).
These predictions allow focusing in vivo experiments on methodologies that will, theoretically, present better results, thus reducing the high costs on time and money spent on a larger batch of experiments (Dias and Rocha, 2015), (Dias et al., 2015).
Another interesting advantage is that, as nowadays most of the steps in the recon-struction process can be automated with the use of several bioinformatics tools, making this procedure relatively fast to complete and improve when compared to how it used to be a decade ago, improving the viability of these prediction methods. One immediate practi-cal application of GiSMo for biotechnologipracti-cal companies, is that these can ease the process of boosting the production of interesting secondary metabolites, just by determining in
silico the optimal experimental condition, on an organism of interest.
2.2 online databases
The widespread of multidisciplinary information, via web, made the exponential growth of knowledge possible. Much of the information used during the execution of this
Table 1: Referenced databases, containing relevant data for the reconstruction of GiSMos
Database Description Web Address National Center for
Biotechnology Information (NCBI)
Repository of several databases that provides analysis, visualization and retrieval of resources for biomedical and genomic data
ncbi.nlm.nih.gov/ Kyoto Encyclopedia of Genes
(KEGG)
Bioinformatics database that contains information
on proteins, genes, pathways and reactions genome.jp/kegg/ Braunshweig Enzyme
Database (BRENDA)
Protein function database that provides enzymatic and metabolic data. Is updated and evaluated by extracting information from primary literature
brenda-enzymes.org/
Transporter Classification Database (TCDB)
Provides a classification system for the membrane transporter proteins, the Transporter Classification system (TC)
tcdb.org/
BRENDA-KEGG-MetaCyc reactions (BKM-react)
Integrated and non-redundant database containing the biological reactions from BRENDA, KEGG and MetaCyc.
bkm-react.tu-bs.de/
Universal Protein Resource (UniProt)
Collection of information on proteins. Divided on two sections: Swiss-Prot and TrEMBL. The first contains manually annotated proteins with data extracted from literature and computational tools. The second contains computationally analyzed proteins, yet to be manually annotated.
uniprot.org/
ModelSEED Biochemistry Database on biochemistry data biologically
relevant reactions and compounds. modelseed.org/biochem/
BiGG Models
A knowledgebase of Biochemically, Genetically and Genomically structured GSMN reconstructions Integrates several published models, and allows to browse for models content and visualize metabolic pathways.
bigg.ucsd.edu/
project is obtained via numerous freely available online databases. From entire genomes of organisms, to specific enzymatic functions, amongst other vital information, will be gathered from the databases shown in table 1 Dias et al. (2015), Forster (2003).
2.3 model reconstruction
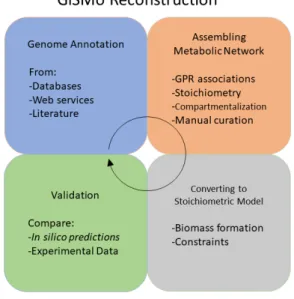
There are several approaches for reconstructing models, using different methodologies, as seen in multiple works on the subject (Rocha et al., 2008),(Feist et al., 2008),(Thiele and Palsson, 2010). But overall, the entire process can be summarized and aggregated into four main steps, thoroughly described in (Dias and Rocha, 2015): genome annotation, assembling the metabolic network from the genome, conversion of the network into a stoichiometric model, and validation of the metabolic model. It is extremely important to understand that this process is iterative, and must be repeatedly followed to ensure the assembly of a high quality model. Moreover, it is mandatory to gather as much information as possible, from many different data sources. A brief description is provided below, and a simplified schema can been seen in figure 1, for each of the main four steps previously mentioned.
Figure 1: GiSMo reconstruction schema
2.3.1 Genome annotation
This is the first critical step when creating a reliable GiSMo. The annotated genome of the subject organism should provide the function of each gene and their respective En-zyme Commission (EC) and Transporter Classification (TC) identifiers. These annotated genomes can be obtained through one of the available online public repositories, such as National Center for Biotechnology Information (NCBI), Kyoto Encyclopedia of Genes and Genomes (KEGG) or ModelSEED. Several specific tools are available for such assessment (Weber and Kim, 2016).
The genome annotation is of paramount importance as it represents the backbone of the model. Hence, a process of re-annotation, targeting the specific information that will possibly improve the final product, should always be considered. Several organisms have already been functionally re-annotated, e.g. (Schaffrath and Breunig, 2000),(Ander-sen, 2005),(The Arabidopsis Genome Initiative, 2000). One important aspect to take into account, is that only the genes involved in enzyme encoding and transport systems are rel-evant to he development of GiSMo. Thus, during the reconstruction, genes that perform such tasks are labeled as metabolic genes. Braunschweig Enzyme Database (BRENDA)
should be used as a source on enzymatic information to validate the assigned gene functions, in an effort to reduce possible annotation errors.
Genomic functional annotation can be obtained through the use of similarity search tools like Basic Local Alignment Search Tool (BLAST) (Altschul et al., 1990) and hidden Markov models (HMMER) (Finn et al., 2011). These perform sequencing alignment, in an attempt to find homologous genes belonging to other organisms, as it provides valuable insight on what the functionality of a gene might be. Presenting its results through a list of the homologies found, and the corresponding similarity scores, options on functional annotation can be user selected.
2.3.2 Assembling the metabolic network
After performing the genome annotation, and selecting the core metabolic genes, such information will be used to assemble the network of reactions promoted both by enzymes and transporter systems. Several sub-steps, briefly described next, must be performed when creating this metabolic network.
2.3.2.1 Gene-Protein-Reaction (GPR)
The draft of the network is obtained by uncovering the so called GPR associations, which are connections between genes, defined by their EC numbers, proteins names, to the reactions they are involved in. Proteins that promote the transport of metabolites are identified by TC numbers.
This process is performed by querying the EC and TC numbers through several databases, such as Transporter Classification Database (TCDB), BRENDA and KEGG to collect the relations between genes, the proteins they encode, and the reactions they belong to. The resulting data consists of:
• Gene names and respective identification numbers • Protein names
• EC and TC numbers
• Reactions names and respective identifiers • Equation of the reactions
• Reactants and products of a reaction
2.3.2.2 Stoichiometry
After obtaining the reaction set, BRENDA, KEGG, MetaCyc reactions (BKM-react) database should be used to verify the stoichiometry of the reactions that are now part of the metabolic network, to make sure everything is chemically balanced.
2.3.2.3 Compartmentalization
Compartmentalization of the model is performed to identify where an enzyme, and consequently the reaction it promotes, is located within the organism. Whether it belongs outside or inside the cell, or in which organelles it operates in. If similar reactions, that follow the same metabolite usage and stoichiometry, take place in different compartments each should have its own entry in the network draft. The same concept applies specifically to metabolites that are the same, but are located and perform actions in different places within the cellular space, i.e., the same metabolite in different compartments is usually connected by transport reactions.
The compartments used for prokaryotes are cytosol, periplasmic space and extracel-lular space, while for eukaryotes, being more complex, the reactions can occur in several other compartments, such as golgi apparatus, lysosome, mitochondrion, endoplasmic retic-ulum or glyoxysome. For higher eukaryotes might be even relevant to differentiate between different tissue types.
Some of this information can be obtained through literature analysis, or searching in available databases, such as Universal Protein Resource (UniProt). There are also several bioinformatics tools that perform the prediction of the enzymes location, running algorithms such as PSORTb 3.0 (Yu et al., 2010) and TargetP (Emanuelsson et al., 2000).
2.3.2.4 Manual curation
When all the previous steps have been completed, it is essential to verify every part of the obtained network yet again, by thoroughly reviewing available literature and databases, to confirm that all useful information was taken into account. This is a necessary step, as automatic methods, while providing a lot of data in a short span of time, do not always obtain the correct data, or even may not be a able to include everything necessary.
• Verify inconsistencies between proteins and function identifiers • Add reactions not yet retrieved, specific for the organism in study • Assess previously unidentified reactions to partial identifiers
• Delete reactions never used in any pathway, to reduce clutter and noise in the future model
• Correct reaction directionality and reversibility
Regarding this last item, this correction process can recur to several methods such as literature analysis, reversibility prediction through thermodynamic constraints, or database sourcing.
The entire process can be sped up, by comparing the draft network to known biolog-ical pathways, and from there identify gaps in the network. These gaps identify missing compounds and/or reactions in the network, that will cause the network to not function properly, resulting in accumulation of undesired compounds, and the non-production of the goal compounds. By identifying gaps, adding the missing information or correcting the existing one, pathways will become functional and ready to work in the network.
Once the GSMN has been curated, it is ready to be converted into a mathematical computational model.
2.3.3 Converting the metabolic network to a stoichiometric model
The set of reactions obtain in previous steps will be used to create a stoichiometric matrix, and several constraints will be added.
2.3.3.1 Biomass formation abstraction
The first step of this stage is including the biomass formation equation, that repre-sents the growth of the organism, within the reaction set. This equation allows a stoichio-metric matrix to be created, using chemical engineering principles to represent the dynamic behavior of the the metabolite concentration, doing so by performing dynamic mass bal-ances with differential equations. Worth mentioning is the steady-state approximation that is applied, in cases that the assumption is that metabolite concentration remains constant throughout time.
2.3.3.2 Other constraints
In order to be able to perform simulations, several constraints must be introduced. Reactions that perform the intake and outtake drains of metabolites, to and from the model, should be introduced.
A mathematical model may have an infinite number of solutions that could suffice the mass balance constraints, as the number of fluxes represented in it are more than the number of said constraints. So, in other to limit this behavior, new constraints are imposed. Determining the irreversibly of reactions and setting the corresponding minimum and maximum fluxes. The reversible ones as constrained between minus infinite and plus infinite, and the irreversible to minimum or maximum flux of zero, when in the forward or backwards direction, respectively. The transport fluxes of several nutrients must also be within certain limits, between zero and a certain uptake value, as so to limit the availability of this compound within the organisms’ network.
2.3.4 Validation
Validating the GiSMo involves using it to make predictions on the organism behavior, when facing various defined environmental conditions and to perform comparative tests with experimental data.
The most widely method for this validation, is Flux Balance Analysis (FBA) (Orth et al., 2010) (Raman and Chandra, 2009). This method relies on the maximization or min-imization of metabolic fluxes, regarding one or more objective compounds, when subjected to determined constraints described in the metabolic model in use.
The validation method should replicate the results obtained through experimental data. As mentioned at the start, GiSMo reconstruction is an iterative process, and several revisions might be required before a final, high-quality, model is obtained. If simulation results do not comply with experimental data then it probably indicates that errors might have been committed when reconstructing of the model. After deep analysis on possible causes, the entire workflow that has been described in this section, should be re-evaluated, to obtain a better and improved model, starting from the second stage onwards.
2.4 metabolic models reconstruction software
During the last recent years, plenty of new software for high-throughput metabolic modeling has been released. While not all offer the same features and tools, some targeting specific organism types, only using enzymes or transporters annotation (or none at all), running locally or on the web, and other differences, they all are worth a look into, to guarantee that the right one for the GiSMo reconstruction process is selected.
As this work focuses on developing tools merlin, a look into the other existing software might prove to be useful, and provide insight on the current methods and ideas for the development process.
2.4.1 Available tools
A comprehensive table containing this programs is found in (Weber and Kim, 2016) and, following it’s ordering by initial release date, some brief insight will be provided on each software. Where possible, the information was cross validated with (Dias et al., 2015) comprehensive tools comparison table, with (Hamilton and Reed, 2014), and with the tools’ own publication article.
2.4.1.1 ModelSEED
Published in 2010, regarded as the first online high-throughput metabolic modeling tool, Model Seed still is one that offers a wider range of features for generation GiSMo. ModelSEED provides enzyme annotation, transporters annotation through Rapid Anno-tations using Subsystems Technology (RAST) (Aziz et al., 2008). Its features set also includes compartments prediction, biomass reaction integration, SBML exporting, path-ways visualization, GPR rules.
However, it is web-based, lacks a Graphical User Interface (GUI) for manual curation, does not highlight metabolic dead-ends in its pathway visualizer, and most importantly is focused on prokaryotic models, so eukaryotic organisms cannot be modeled.
It is to be noted that, regarding the validation of reactions’ stoichiometry, this tool has its own metabolic database(Devoid et al., 2013). Another unique feature, is that ModelSEED performs its automatic generation of the biomass reaction.
2.4.1.2 MEMOSys
Published in 2011, Metabolic Model research and development System (MEMOSys) is developed in Java™on top of the JBoss Seam framework, and allows management, storage, and development of GiSMo. MEMOSys allows for model compartmentalization under manual input from the user and exports the model in standard SBML format (Pabinger et al., 2014). Besides, it lacks many interesting features, as it does not allow for curating the annotation, additing a biomass reaction or any kind of pathway visualisation, while also not offering a proper GUI.
2.4.1.3 SuBliMinaL Toolbox
Published in 2011, SuBliMinaL Toolbox is developed in Java™, and relies on several third-party packages in its core. The in-depth abilities to manage chemical information for metabolites in this tool are indeed notable. It has a very complete feature set that includes enzymes annotation, compartments prediction, biomass reaction integration, GUI for manual curation, GPR rules and reaction stoichiometry validation. SuBliMinaL allows the reconstruction of models for both prokaryotic and eukaryotic organisms (Swainston et al., 2011). Lastly, it has pathway visualizer, but it lacks the ability to highlight metabolic dead-ends.
2.4.1.4 FAME
Published in 2012, Flux Analysis and Modeling Environment (FAME) is a web-based software, developed in Hypertext Processor (PHP) and Java™, that thrives on simplifying building new metabolic models in a streamlined fashion, by bringing ,as much as possi-ble, all the necessary tools into the same environment. Through user input, it allows to manually assign compartments to reactions, as well as biomass reaction insertion, and pos-sesses a pathways visualizer that highlights metabolic dead-ends (Oberhardt et al., 2009). However, it lacks support for performing enzymes and transports annotation, GUI for man-ual curation, GPR rules, and reactions stoichiometry validation, while being specific for prokaryotic organisms.
2.4.1.5 GEMSiRV
Published in 2012, Genome-scale Metabolic Model Simulation, Reconstruction and Visualization (GEMSiRV) is developed in a Java environment with GNU Linear
Program-ming Kit (GLPK) in its core, and is precisely geared towards what its nomenclature implies,
i.e. it allows the reconstruction, simulation and visualization of metabolic models.
GEM-SiRV features’ set includes a GUI for manual curation of the model, pathways visualizer that highlights metabolic dead-ends, GPR rules. Most interestingly, it also incorporates the option to generate robust visual representations, with the objective of being an easy way to present the results (Liao et al., 2012) However, enzyme and transporters annota-tion, compartments predicannota-tion, biomass reaction integraannota-tion, and stoichiometry validation of reactions are all missing factors within this tool.
2.4.1.6 Pathway Tools
Published in 2012, Pathway Tools focus its effort on predicting, modeling, curating and visualizing metabolic pathways. It does not include enzymes annotation, as that is not the goal of the tool. Making use of transporters annotation, it allows the user, through a GUI for manual curation, to perform tasks in order to create and visualize an organism’s (either prokaryotic and eukaryotic) metabolic pathways and it even highlights metabolic dead-ends. It is also to be noted that it creates a proprietary model-organism database, Pathway/Genome Database (PGDB), that stores all data about genomic, proteic and metabolomic information that belong to the organism’s network (Karp et al., 2010).
2.4.1.7 MicrobesFlux
Published in 2012, and running over Python™programming language, MicrobesFlux is a web-based platform for reconstructing metabolic models, for microorganisms that have their genome sequenced. It emphasises its ability to perform FBA and dynamic FBA of generated models on prokaryotic organisms. It includes a pathway visualizer with metabolic dead-ends highlighting, validation of stoichiometry of reactions, receives manual input of biomass reaction equation and allows to export all this in SBML format (Saha et al., 2011). However, it lacks any kind of support for enzymes and transporters annotation, model compartmentalisation and no GUI for manual curation of the model.
2.4.1.8 RAVEN Toolbox
Published in 2013, running on top of MATLAB, Reconstruction, Analysis and Visual-ization of Metabolic Networks (RAVEN) Toolbox performs semi-automated reconstruction of genome-scale models, while also being able to analyze and make simulations on those
models within itself. Usable for both prokaryotic and eukaryotic organisms, it can work with enzymes annotation, perform model compartmentalization, accept manual input of biomass reaction equation, allowing pathway visualization with metabolic dead-ends high-lighting and SBML exporting of the models (Agren et al., 2013). Something that it lacks is not taking transporters annotation,GPR rules and validation of the reactions’ stoichiome-try, and does not include a GUI for manual curation. The fact that it requires proprietary and paid software MATLAB, while bringing advantages of immediate simulation capabili-ties, might be a let down for some potential users.
2.4.1.9 CoReCo
Published in 2014, Comparative Reconstruction (CoReCo) makes an approach on comparative metabolic reconstruction. It is very useful when modeling multiple related species, through comparison. It factors in enzymes annotation, manual input of biomass reaction equation and stoichiometry validation, for both prokaryotic and eukaryotic or-ganisms, and exports models in SBML format (Pitkänen et al., 2014). However, it lacks support for transporters annotation and compartment prediction, pathways visualizer and GUI for manual curation.
2.4.2 merlin
Published in 2015, merlin is an multi-platform open-source application developed in Java™, built on top of AIBench framework (Glez-Peña et al., 2010) that allows the reconstruction of GiSMos, for any organism which genome has been sequenced, including the functional annotation of its entire genome (Dias et al., 2015).
Within it’s implementation, merlin makes use of many Java™libraries, such as Bio-Java, NCBI Utilities Web Service Application Programming Interface (API), UniProtJAPI, ChEBI Java API, Representational State Transfer (REST) API, jSBML, and others. Local data is stored in relational databases, either MySQL for server based operation or H2 as a local machine storage option. The H2 engine integration into merlin was developed and implemented as part of the project that preceded this thesis.
Including a vast amount of tools, merlin allows users to perform several tasks when reconstructing GiSMo. The first three of the four steps presented in figure 1 are performed within merlin’s environment, grouped into two main modules.
The annotation is the first priority, encompassing several tools and GUI visualizers, that help to perform semi-automated enzymes annotation through remote BLAST queries, find the transport relevant genes before generating the corresponding transport reactions using Transport Reactions Annotation and Generation (TRIAGE) and importing predic-tions on organelle localization of the encoded proteins using LocTree3 (Nair and Rost, 2005) or PSORTb 3.0 (Yu et al., 2010) algorithms. The second module is the for the developing and curating the model, in which GPR associations are automatically generated to create the network, the model is compartmentalized and the biomass reaction is inserted into the model. A validation process is then recommended and it should be performed by with the help of other software. For this, merlin provides a way to export the finalized model in the standard SBML format (Hucka et al., 2003).
2.5 other tools
Besides the main focus on the reconstruction of the model, other tools that aid in the creation of the new features to be implemented for such process, and for the further analysis of the finished model, also deserve mention and brief explanation.
2.5.1 AIBench
As a lightweight Java™based application framework, AIBench (Glez-Peña et al., 2010) eases the development of software applied to scientific subjects by simplifying the user interaction, inputs and outputs. It was created with the combined efforts between research groups of University of Minho and University of Vigo. It functions based on receiv-ing the users inputs, processreceiv-ing them internally, and outputtreceiv-ing the resultreceiv-ing by-products. Making use of three main types of objects, being them operations, data types and data type views, it is possible to develop applications for several platforms.
Besides the vast number of offered functionalities, it gives the programmer the possi-bility to re-use GUIs, which largely speed-up the overall programming process (Glez-Peña et al., 2010). AIBench projects are built with three types of elements, datatypes,
oper-ations and views. The first is the group of classes meant to store various types of data
about a single object, second are the classes of methods that perform operations with the information contained in the datatypes, and finally the third are the graphical panels that
will display the information to the user. There is a plethora of AIBench-based applications widely available, including merlin and OptFlux.
2.5.2 OptFlux
OptFlux (Rocha et al., 2010) is a user-friendly, and open source free software for metabolic engineering, developed at University of Minho by the Bioinformatics and Systems Biology research group. It provides a solid platform to perform validation of GiSMos, the fourth step in the reconstruction process seen in figure 1.
It is capable of performing several analysis based on strain optimization, being the first to incorporate evolutionary algorithms and simulated annealing (Gavrilescu and Chisti, 2005) Amongst other features, it can import and export entire metabolic models in SBML format, among other available options. Also, OptFlux provides a repository of models for several organisms that have already been curated, ready to be used for analysis and tests. Some available options for simulating phenotypes, which can be performed within OptFlux, are FBA (Orth et al., 2010), Regulatory On-Off Minimization (ROOM) (Shlomi et al., 2005) and Minimization of Metabolic Adjustment (MOMA) (Segre et al., 2002).
One of the main goals of using this bioengineering methods is to optimize strains to maximize by-products formation, whilst assuring biomass production and growth, which can be performed in silico in OptFlux. This can be performed by running either Opt-Knock, Simulated Annealing or Evolutionary Algorithms. OptFlux was also developed in Java™programming language, on top of the AIBench workbench.
3
P I P E L I N E I M P R O V E M E N T A N A LY S I S
The main goal of the project, as mentioned in the introduction, is to identify which improvements could be performed in merlin’s work-flow and which new functionalities can be added. The following section presents the results of this analysis, explaining the current methodology for each case-study, and providing a brief hypothesis on what can be improved.
3.1 load enzymes annotation
Performing the annotation of enzymes is a vital step in the reconstruction process of models. This attribution of specific enzymatic data provides confidence in the quality of the final model. This is performed by annotating genes with EC numbers that encode its enzymatic proteins, assigning them to specific reactions which will be used to assemble the metabolic network. There are tools that achieve this by trying to find (for each gene) closely related sequences in online databases, by performing remote similarity searches, based on the premise that high similarity between two sequences increases the probability that these share a common lineage and thus a function.
Currently, merlin offers the option to perform similarity searches using hidden Markov models HMMER, as well as remote BLAST using well known and widely used web-services from and NCBI, allowing users to set a plethora of parameters to obtain the best data possible.
3.1.1 Blast reports
While the previously mentioned methods, specifically both remote BLAST opera-tions, offer quality and customizable opportunities to obtain a strong starting point for
the enzymatic annotation of genomes, not every user may be interested in obtaining this information using remote tools. Some common reasoning can be made to this avail, such as users working on private projects do not want their information uploaded to remote servers, or simply that one may already possess reliable and good quality comparison data obtained within the context of the project.
With this reasoning, we found that would be of great value to offer, alongside every other aforementioned tool, a way to load custom BLAST reports from local user-provided files.
3.1.2 Load annotation files
There are file types that provide a rich way to obtain a wide range of metadata, including the genomic information, sequences, annotations, comments and other references, that might provide enough annotation data. The use of these files would allow to provide enzymatic annotation for a merlin project, since it contains information on each coding sequence in an organism’s genome.
Examples of these files are Generic Feature Format (GFF)3 and GenBank, both widely used by the bioinformatics community worldwide. While both have different struc-tures and different information focus, the main difference between them is that while GenBank has (by default) a field for to include EC numbers, which is not required in GFF3, though it may be included in the notes as extra information.
3.2 enzymes annotation curation
The process of manually curating enzymes annotation is tedious and time-consuming, and exponentially grows with genome size. merlin uses a specific algorithm that attempts to provide functionality to every gene, by assigning EC numbers and product names. A numeric score (Scoreec
g) that weights the number of times that each EC number was found
from the homology data (Scoref), and the taxonomy of said organisms (Scoret), is
calcu-lated in function of a controller value (α). This parameter provides either more or less emphasis to each of the scores, according to equation 1.
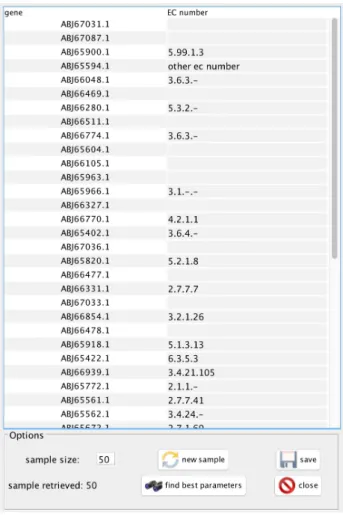
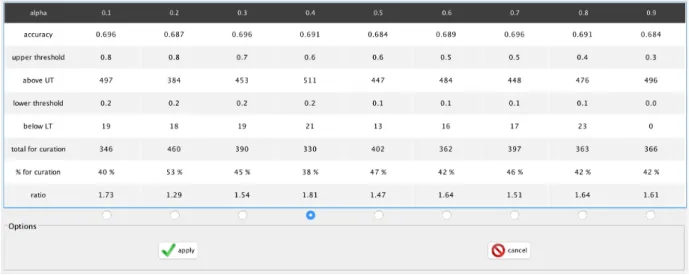
The result is then applied to determine which EC number is most likely to be correct assigning it to the gene. Although merlin provides this functionality, the user still has to determine the best α value to obtain the most accurate annotation possible. The recom-mended method is to manually curate a portion of the genome, manually calculating the frequency of correct annotations, for different α values.
This is still an inefficient process that allows a high degree of automation. Imple-menting an operation that programatically iterates over different α, whilst calculating the frequency of correct annotations for a list of manually curated entries, can greatly decrease manual efforts regarding this stage of models reconstruction.
3.3 views
As previously mentioned, merlin is developed on top of AIBench framework and one of its types of objects are the datatype’s views. These panels add great value within merlin’s environment, as they allow ease of accessibility to various types of data, in well-organized windows, aiding the user in the decision making process, while developing a model.
Several view objects are part of a project, and these can even have sub-views under them. Regarding a given metabolic model, there is the Genes View, Proteins View and its Enzymes Sub-view, Metabolites view, Reactions view and Pathways View. There is also a view available that contains the homology data, named Enzymes View under the annotation tab, that has editable information on the enzymes annotations, and then lets the user include its data into the model itself.
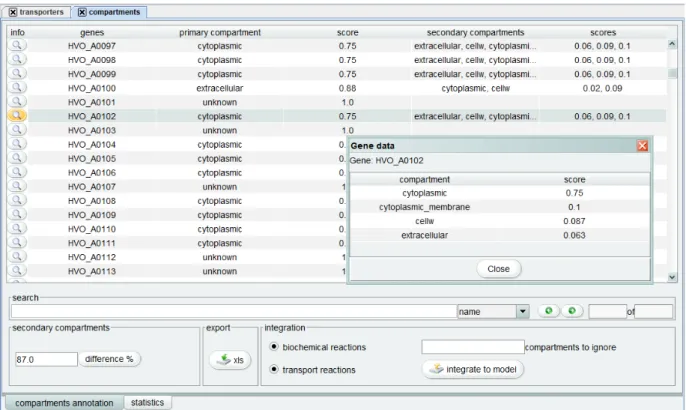
While tools to perform both transporters and compartmentalization annotations are already available in merlin, dedicated visualization panels are missing from its release. Since these annotations are crucial steps in the reconstruction process, the creation of these visualizers will be very helpful also for further improving the overall workflow.
3.3.1 Transporters annotation
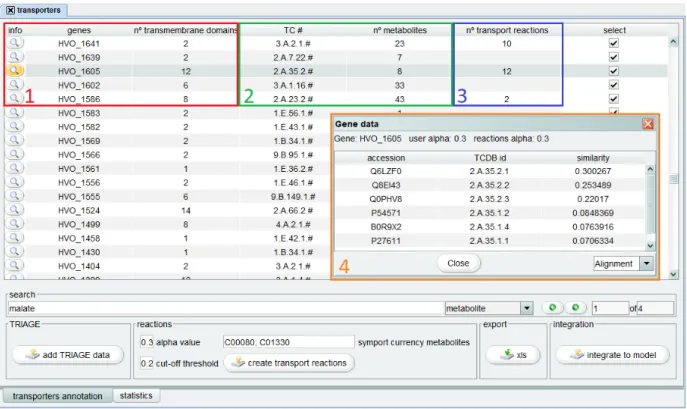
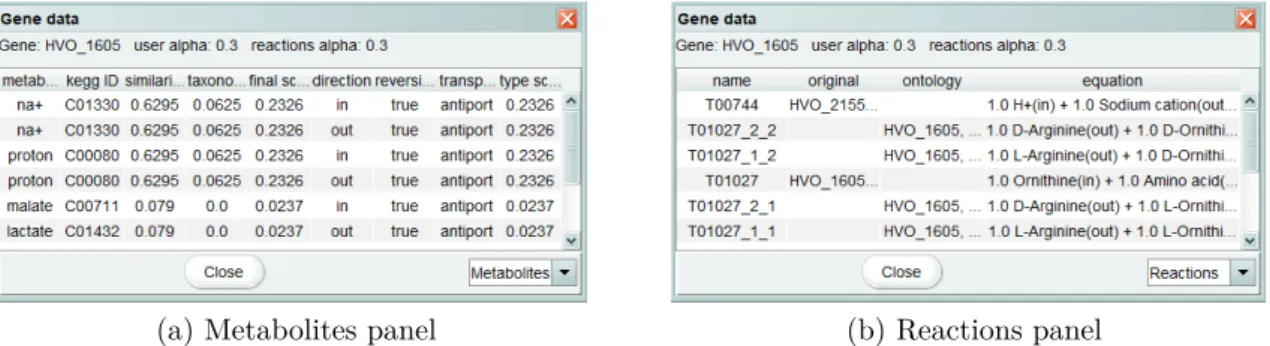
TRIAGE (Dias et al., 2017) is a tool that performs the identification of transporter family and functional annotation of transport reactions before generating reports on the metabolites transported by each transmembrane protein.
Improvements in this tool encompass the implementation of a transporters visual-izer, under the annotation views tab, which will provide step by step information on the
transporters annotation. Initially, gene specific information will be presented, namely the number of transmembrane domains. Such information will then be complemented with data from Triage and, afterwards, with the number or transport reactions generated for each gene. Such visualizer should allow the user to input different parameter values and to directly integrate the transport reactions in the model.
3.3.2 Compartments annotation
Likewise, merlin already offers algorithms to perform the compartmentalization of the model. LocTree3 and PSORTb 3.0 can make predictions on the subcellular locations of all the proteins in a whole genome. Users can load the annotation results, from the reports created by these tools.
A new compartments view will provide the user with a visual representation of the compartment, depending on the tool eventually a secondary compartment, that each gene should be assigned to as well as the corresponding confidence score. This data can be updated with new parameters in real time and when the desired result is achieved it allows integrating the compartments annotation in the model.
3.4 reversibility
In any biochemical reaction the relation between both reactants and products, is determined by its directionality and reversibility state. This determines which compounds are consumed and produced after a cycle of the reaction occurs. As such, knowing this information for every single reaction contained, in a desired organism’s model, is crucial to functionality of its internal metabolic pathways, as they rely on an uninterrupted path for its initial reactants to be converted in its final products. If at any point information on a reaction is either wrong or missing, chances are that this network will not be functional, leaving undesired compounds as output and not producing the actual final products. This gaps in the pathways must be identified and corrected to have a working metabolic draft model of an organism.
As each living organism is biologically and chemically different from each other, so is the way each unique reaction works in them. Hence, the same reaction can have dif-ferent directionality and reversibility values in difdif-ferent organisms. Several factors have huge influence in this, such as in which medium the organism is found in, its pH value,
temperature and the presence of specific compounds or ions. This leads to the conclusion that every single reaction that is meant to be included in a model has to be individually verified and have its reversibility assessed.
Automated metabolic model reconstruction software must include tools to predict the reversibility state of reactions, to conceive high-quality models. Thus, the real goal is to predict reactions’ reversibility with the highest possible confidence level, decreasing the time spent on the manual curation process, whilst improving overall quality. Less gaps to fill means higher chance that most of a pathway is functional just right at the start.
3.4.1 Current methods
merlin already offered an operation designed specifically for correcting reaction’s
reversibility. The pre-built bioreaction database, designed by (Stelzer et al., 2011), contains a table in which reactions’ reversibility state is available for a vast amount of reactions in KEGG’s database. In this article, a defined set of rules were determined to try to predict the reversibility state. The specificities of the rules-set are not in the scope of this project, nevertheless a few examples will be provided.
Reactions are, by default, treated as reversible if:
• on different biological conditions a single reaction has both directions as possible • the certainty of a reaction is not high enough
• ∆G of a reaction is close to 0
Also taken into account was that hydrolysis’ reactions, which are very common, are usually irreversible. Additional information has been collected from BRENDA database.
One clear structural drawback of this database is that it assumes that a reaction is either reversible or that when irreversible it always occurs to the forward direction, based on the orientation used in KEGG database. This immediately eliminates the possibility of its state being reversed, as it provides no information on the reactants and products, of the reaction that it’s trying to access reversibility to.
3.4.2 Thermodynamic analysis
Whereas the previously mentioned database already takes thermodynamics analyses into account, further investigation will be performed on this field. In theory, reactions’ directionality and reversibility should to be assessed by evaluating the reactions’ free energy values.
All living organisms follow the laws of thermodynamics and operate strictly under these, as they are never at a perfect equilibrium with the environment. Hence, constant transactions occur between their systems and their surroundings. In the second law of thermodynamics the Gibbs free energy (G) value determines, for a given pressure and temperature, the quantity of energy able of performing work while a certain reaction occurs. Calculating the change in Gibbs free energy (∆G) for a reaction, which is the difference in energy from its start to its end, should provide insights regarding the reversibility state of the reaction.
The standard free-energy change (∆G’0), in a simplified way can be seen, under
default conditions, as the difference between the amount of free energy contained in the products of a reaction and the free energy of the reactants. So, ∆G’0 becomes negative
if the products are less energetic than the reactants, leading the reaction to take place in such direction, spontaneously. If the difference between the energy levels of the members in the reaction is zero, or very close to it, it is feasible that the reaction can take place in both directions (Nelson et al., 2008). The problem with this approach, besides the fact that the same reaction can have different reversibility values in different organisms, is that ∆G is never precisely equal to zero and no other clear threshold was found in literature that could provide insights regarding which values a reaction is indeed reversible. Several works attempted to use this premise to determine the directionality and reversibility of all reactions within a metabolic model reconstruction process.
∆G’0is calculated on the assumption the activity of every metabolite is equal to
1Mo-lar, which is not true for every compound in a biological system (Albe et al., 1990). Thus ∆G’0 is not an ideal measurement to assess the thermodynamic feasibility of a reaction.
Methodologies described in the works of (Reed et al., 2003) and (Feist et al., 2007), propose to determine reversibility by calculating the maximum and minimum value for the variation in energy of the reaction ∆G’, using equation 2 and 3, respectively.
∆G’max =∆G’0+∆Gtransport+RT Products
∑
i=1 niln(xmax) + Products∑
i=1 niln(xmin) +Ur,est (2) ∆G’min =∆G’0+∆Gtransport+RT Products∑
i=1 niln(xmin) + Products∑
i=1 niln(xmax)−Ur,est (3)∆G’max is a function of the∆G’0 of the reaction, of the uncertainty value estimated
for it (Ur,est), of the energy contribution of the proton gradient when transport in transport reactions (∆Gtransport) and the sum of the formation energies in the involved compounds (n). Other constants include the minimal activity of a metabolite (xmin), assumed to be 0.00001M, the maximum activity (xmax) of 0.02M, R is the universal gas constant, and
T the default room temperature of 298.15K. Different xmin values were assigned for the dissolved gases H2, O2 and CO2, at 0.000034M, 0.000055M and 0.0014M respectively.
From these equations, it was concluded that:
1. reactions in which both∆G’min and ∆G’max is negative, the reaction are irreversible and take place in the forward direction;
2. if∆G’min is negative and∆G’max is positive, the reaction is reversible and takes place in both directions;
3. otherwise, if both ∆G’min and ∆G’max are positive, the reaction is irreversible and takes place in the opposite direction.
This methodology requires a large amount of data on energy values, of compounds and reactions. This values are not easy to be calculated, and take a lot of computational resources to be performed effectively. Making these in real-time within merlin would only degrade the performance of the software, so further research was conducted on how to obtain the required information.
3.4.3 eQuilibrator
The web-based eQuilibrator is a biochemical thermodynamics calculator (Flamholz et al., 2011) that offers a search function for biochemical reactions, and provides calcula-tions on their biochemical proprieties. It provides estimative on the ∆G’0 of a reaction,
and its uncertainty value, under user defined constraints on pH and ionic strength.
While seemingly very complete, eQuilibrator still cannot calculate energy values for a considerable number of reactions, that were found to be included in pathways necessary for the viability of GiSMos. Also, the lack of a proper API for external access limits the usability, from a programmatic standpoint. While offering the possibility to download a database containing calculated energy values, including their uncertainty values, for various
pH levels, the same cannot be said for the formation energies of compounds, rendering the
previously researched equations useless, since not all its variables can be assigned.
3.4.4 ModelSEED templates
The realization that the methodology mentioned above would require deeper research, than the context of the current project would allow, a different approach was then taken. Based on their ”Biochemistry” database, the ModelSEED tool performs this operation on its models, recurring to several templates built by them, for this purpose. As these are available in their online git repository, using its resources is a fairly straightforward process, and since all data in ModelSEED, as previously described, is thoroughly curated, the data contained in these templates is trustworthy and of high-quality.
3.5 from merlin to optflux
Once a model has been created, e.g. in merlin, one of its purposes should be to be exported in a standard format, such as SBML. This filetype is commonly used by bioinformatics tools, including those that use its contained information on biochemical networks, reactions and formulas. Several software tools, such as OptFlux, can open this types of files and use them to perform predictions on the phenotypical behavior of microorganisms and optimization on byproducts of interest.
As the reconstruction process is iterative, taking into account that the likelihood of achieving good results on the first try is fairly low, odds are that further curation will be
required to attain better adjustments of the in silico results to the actual behavior of the organism. Hence, a time-consuming cycle of exporting the model into SBML in merlin, importing into OptFlux to perform simulations, only to have to go back and make changes in merlin, having to re-export and perform all the same steps again, is often necessary.
Therefore, an improvement would be to allow a direct connection, from OptFlux to merlin, allowing the former to access data in the model, without having the hassle of exporting the SBML file and then re-import it. OptFlux has a policy of plug-in based add-ons, which the user may add into their OptFlux installation, that include a list of several different tools. As such, this feature will be implemented following such philosophy further improving the communication between these complementary metabolic engineering platforms.
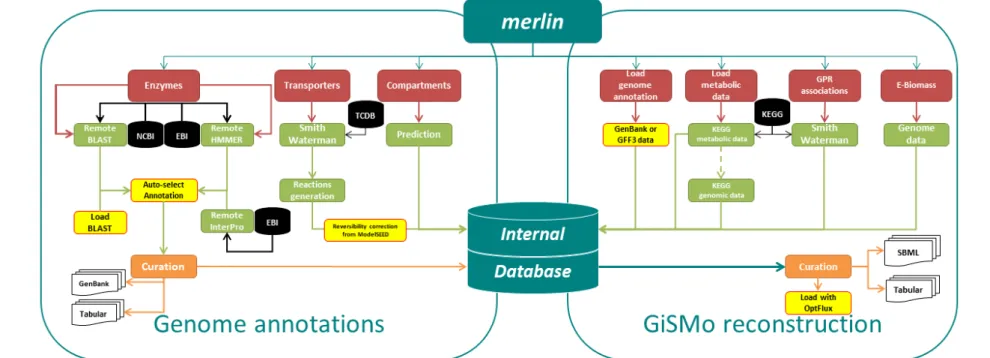
3.6 improved schema
A visual overview on the improvements that added functionalities to the genome annotation and GiSMo reconstruction processes, are available in merlin’s updated schema, in figure 2, highlighted in yellow with red borders.
Figure 2: Improved merlin schema
4
F E AT U R E D E V E L O P M E N T A N D R E S U LT S
4.1 software back-end improvements
Before starting to make changes and additions into the code, some ”house-keeping” work is to be made, to simplify and improve the organization between the various Eclipse projects that merlin uses.
4.1.1 Database API architecture re-structure
Since many of the operations performed tend to either store processed data into a database, load information from a database, or even both actions simultaneously, the way that that links from Java™code to structured queries is made is of vital importance. Structured Query Language (SQL) queries were spread all through the code, embedded in Java Database Connectivity (JDBC) statement objects, and used whenever they were needed within the current methods. While this practice should suffice and was totally functional, merlin has grown into a full-blown and complex piece of software, with hundreds of classes and thousands of code lines. Therefore, improvements were required, to keep each project organized and facilitate future development, while also cleaning up redundancies in the current code.
Classes were created under the database-connector project. These are a repository of static methods, containing all the interactions with merlin’s internal databases. The different API’s are the ”ProjectAPI”, which contains all queries associated with a merlin project, the ”HomologyAPI”, which includes all queries for the operations used to create and edit enzymes annotation, the ”TransportersAPI” for the queries regarding transporters annotation and ”ModelAPI”, that includes all queries that act on the model itself.
Being named as clearly as possible, concerning their function, the overall template that they follow is to receive, as arguments, a statement object that is the established connection with the database and also the required parameters to execute said statement. Also, when needed, results were also returned. The type of SQL statements used can be ”SELECT”, ”INSERT”, ”UPDATE” and ”ALTER”.
While most methods are simple execution of statements, or even the fetching of a result set, some cases exist in which the returned is complex. As Java™methods can only return a single object per method, the most practical solution found was to create special objects named ”capsules”, that are no more than a way to temporarily store several results, returning those results in one bundle, which can then be extracted for use afterwards. Depending on the specific needs of various query results, several different capsules were created.
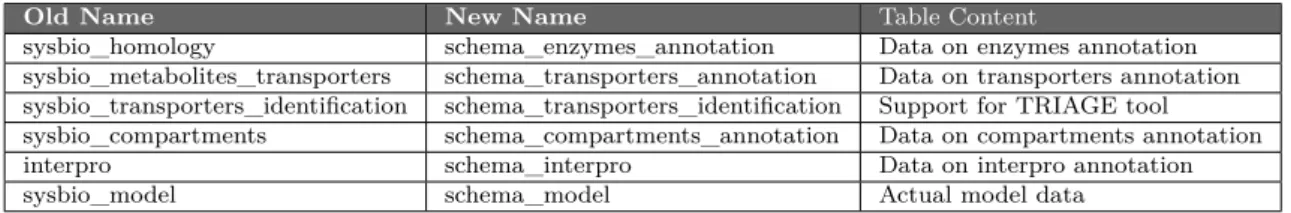
4.1.2 Relational schema and table renaming
For the creation of its internal databases, merlin uses various relational schemas, which facilitate the process of creating SQL queries to create all the tables. The naming schema of these was out-dated and in need of renaming to improve readability and consis-tency. The renaming is shown in table 2, detailing the names using before and after the change. A new file containing only the queries responsible of creating all the table ”views” used, named ”view_database.sql”, was created.
Table 2: Before and after names of internal database schemas and its contents
Old Name New Name Table Content
sysbio_homology schema_enzymes_annotation Data on enzymes annotation sysbio_metabolites_transporters schema_transporters_annotation Data on transporters annotation sysbio_transporters_identification schema_transporters_identification Support for TRIAGE tool sysbio_compartments schema_compartments_annotation Data on compartments annotation interpro schema_interpro Data on interpro annotation sysbio_model schema_model Actual model data
Another important update was the renaming of all tables in the database, as to clar-ify queries made on them. For that, a prefix was added into each table, specclar-ifying which schema they belong to, as that is an indicator to which operations it might be relevant to. The prefix used is taken from the schema name, by removing the ”schema_” part out of it. As an example, table ”tc_numbers”, that is part of the ”schema_transporters_annotation”, new name is now ”transporters_annotation_tc_numbers”.
4.1.3 Configuration reader
Having a clean interface makes for a better experience when using any software. Some information, as relevant as it may be, might not be frequently altered. Moving it into their own configuration files, helps to keep a cluttered GUI more intuitive to work with.
A configuration file reader, which automatically reads a pre-determined configuration file, was implemented into merlin’s code and stored in merlin’sconf folder. This reader parses the information and fills the necessary variables with its contents. These files are included in the software release and its values can be changed anytime, by the user. Their standard organization is one type of data per line, in the format data_type_name : value.
4.1.4 Create project GUI
Every new reconstruction in merlin is started by creating a project. Bound to a single database, it contains the basic information on the organism that is being studied. Some improvements have been made to the panel that allows its creation.
First off, a connection has to be made to either a MySQL or H2 server. This requires user credentials, username and password and in the case of MySQL also the host address and port number. While this is a must for any project, its usual for an user to only use a single database, and so having to go into a configuration file and input there the configuration information is usually a one time action, which is an improvement over having to always type it when creating a new project. Even more so because when using an H2 database, considering that it is stored in the local machine, this type of information is usually not very relevant. Thus, the provided credentials should suffice for the needs of the majority of users.
The NCBI taxonomy id of the organism is also requested in this panel, as it is used to gather relevant data on the organism. This identification is stored in the database itself, after the first time a project was created to it. Assuming the user provided the correct
id in the first place, the panel now automatically fills this field whenever a database is
selected, thus saving time and effort for the user to be always typing it when creating a new project using a previously used database. However, the id is still in a text field, that can be changed if so desired.
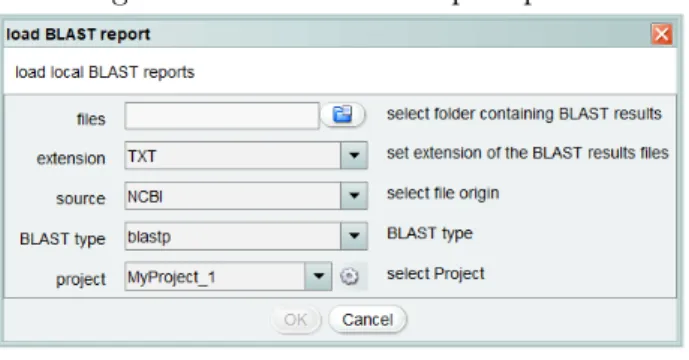
4.2 load blast report
The implementation of a loader operation for user-provided blast reports was straight-forward. The operations that perform remote homology searches in NCBI and EBI send the user requests to web-servers, wait for the response and corresponding result data, which is then processed and its information inserted into merlin’s internal database. Having direct access to the homology data results, in one or more files, the initial steps of the currently used operation can be skipped, and the annotations directly added into the process that stores them in the database.
A new operation added to merlin’s upper menu, under the path annotation>enzymes
> BLAST > load BLAST report, prompts a panel, as shown in figure 3, which compiles
some information from the user. This dialog box retrieves the location of the folder that contains the BLAST report files, by prompting a file explorer panel. It also has four
drop-down box elements that allow the user to select the extension of the report files, either
”.TXT” or ”.OUT”, the origin of the reports, from NCBI or EBI and the type of BLAST performed to obtain those files, blastp or blastx. Lastly, it requires the user to indicate in which project must the reports should be loaded to.
Figure 3: Load BLAST report panel
4.3 load genome annotation from files
Due to the increasing availability of genomic information in standardized files, and the high amount of data they have, the use of said files to include gene annotation into a
merlin project is going to give a good basis to a reconstruction. Several online databases
Parsers were made for GFF version 3 and GenBank filetypes, extracting its information and adding it to a project.
4.3.1 GFF loader
The operation to load GFF files requires the user to provide the file location and to indicate the source from which the file was obtained, either UniProt, NCBI or other. Errors or inconsistencies in the file are also checked in this operation as, although this filetype is widely used, there are several cases in which the standard is not followed in is totality. If errors are found, a temporary text file is created in merlin’s folder, detailing the lines that did not comply with the standards.
Internally, the operation it is divided into three steps, being those parsing, searching
for EC’s and saving. Starting by reading the file, every line is then parsed one by one,
retrieving and temporarily storing relevant information. After gene by gene entries have been created, since GFF files do not include EC numbers as a core field, a search is performed in UniProt, which will retrieve the EC numbers for each gene, using its acession number. All information is then saved into the corresponding tables in the project database. For each gene, the relevant fields are:
• locus tag → identifier of the gene • protein id → id of the encoded protein • direction → direction of the strand
• first nucleotide → the relative position of the first nucleotide within the genome sequence
• last nucleotide → the relative position of the last nucleotide within the genome se-quence
• EC number →EC number identifier