Luísa Maria Ramos Campelo
Licenciatura em Biologia
Fishing the key biological components of
the bacterium
Geobacter metallireducens
for optimal biotechnological applications
Dissertação para obtenção do Grau de Mestre em Biotecnologia
Orientador: Prof. Doutor Carlos A. Salgueiro, Professor Auxiliar,
Faculdade de Ciências e Tecnologia, Universidade Nova de Lisboa
Júri:
Presidente: Prof. Doutora Paula Mª. Theriaga M. B. Gonçalves Arguente: Prof. Doutora Maria Teresa Nunes Mangas Catarino Vogal: Prof. Doutor Carlos Alberto Gomes Salgueiro
Luísa Maria Ramos Campelo
Licenciatura em Biologia
Fishing the key biological components of
the bacterium
Geobacter metallireducens
for optimal biotechnological applications
Dissertação para obtenção do Grau de Mestre em Biotecnologia
Orientador: Prof. Doutor Carlos A. Salgueiro, Professor Auxiliar,
Faculdade de Ciências e Tecnologia, Universidade Nova de Lisboa
Júri:
Presidente: Prof. Doutor(a)
Arguente: Prof. Doutora Maria Teresa Nunes Mangas Catarino Vogal(ais): Prof. Doutor Carlos Alberto Gomes Salgueiro
iii
Fishing the key biological components of
the bacterium
Geobacter metallireducens
for optimal biotechnological applications
“Copyright”
Luísa Maria Ramos Campelo
Faculdade de Ciências e Tecnologia Universidade Nova de Lisboa
Os resultados apresentados no capítulo 2 foram incluídos no artigo Dantas JM, Campelo LM, Duke NEC, Salgueiro CA, Pokkuluri PR (2015) "The structure of PccH from Geobacter sulfurreducens – a novel low reduction potential monoheme cytochrome essential for accepting electrons from an electrode", FEBS Journal, 282, 2215-2231.
Parte do trabalho experimental desta Dissertação foi realizado no âmbito do projecto de investigação científica, com referência PTDC/BBB-BEP/0753/2012”, financiado pela Fundação para a Ciência e a Tecnologia.
v
Acknowledgements
I would never have been able to finish my dissertation without the guidance of my advisor, Professor Carlos Salgueiro and Drª Joana Dantas, help from friends, and support from my family.
Firstly, I would like to express my deepest gratitude to my advisor, Professor Carlos Salgueiro and Drª Joana Dantas for their excellent guidance, caring, patience, and providing me with an excellent atmosphere for doing research.
Secondly, I would like to thank Telma Simões, who as a good friend, was always willing to help and give his best suggestions. It would have been a lonely lab without her. I thank my fellow labmates for the good mood.
vii
Abstract
The microorganims from the Geobacter genus are very interesting because of their potential use for biotechnological applications. They can transfer electrons towards extracellular terminal acceptors, which include toxic or radioactive metals. In addition, they also have the capability to convert renewable biomass into electricity. The most studied members of the Geobacter genus are the Geobacter metallireducens and Geobacter sulfurreducens bacteria. G. metallireducens displays some particular physiological aspects that are even more interesting compared to G. sulfurreducens, which include (i) their ability to reduce aromatic compounds, (ii) more efficient Fe(III) reduction rates, and (iii) the ability to use nitrate as terminal electron acceptor. Similarly, to G. sulfurreducens, a family of five homologous periplasmic triheme c-type cytochromes, designated PpcA, PpcB, PpcC, PpcE and PpcF, was identified in G. metallireducens. In G. sulfurreducens the triheme cytochromes were shown to be crucial for extracellular electron transfer and therefore it is conceivable that these proteins play a similar role in G. metallireducens. Therefore, the main goal of this work was to optimize the production of G. metallireducens triheme cytochromes as a foundation to future optimization of G. metallirudecens-based biotechnological applications. To achieve this goal, the proteins were cloned (except PpcB), heterologously expressed in Escherichia coli and purified. The preliminary characterization of PpcA and PpcF was also undertaken in the present work. The data obtained showed that both are low-spin hexacoordinated c-type cytochromes in the reduced and oxidized forms.
In parallel, it was also undertaken an evolutionary study on PccH, a monoheme c-type cytochrome from G. sulfurreducens that is crucial for microbial electrosynthesis pathways in this bacterium. The results obtained suggested that PccH is a member of a new subclass within the class I cytochromes.
ix
Resumo
Os microorganismos do género Geobacter são muito interessantes devido ao seu potencial uso em aplicações biotecnológicas. A sua relevância deve-se à capacidade de transferir electrões para aceitadores extracelulares que incluem metais tóxicos ou radioactivos. Para além disso, conseguem ainda converter biomassa renovável em electricidade. As bactérias mais estudadas do género Geobacter são as das espécies Geobacter metallireducens e Geobacter sulfurreducens. Quando comparadas com G. sulfurreducens, as bactérias G. metallireducens apresentam alguns aspectos fisiológicos ainda mais interessantes e que incluem: (i) a capacidade de reduzir compostos aromáticos, (ii) uma maior eficiência na redução de Fe (III) e (iii) a capacidade de utilizar o nitrato como aceitador de electrões.
À semelhança de G. sulfurreducens foi possível identificar uma família composta por cinco citocromos tri-hémicos periplasmáticos do tipo c (designados por PpcA, PpcB, PpcC, PpcE e PpcF) em G. metallireducens. Em G. sulfurreducens os citocromos trihémicos periplasmáticos demonstraram ser cruciais para a transferência extracelular de electrões sendo por isso concebível estas proteínas desempenhem o mesmo papel em G. metallireducens.
O objetivo principal deste trabalho consistiu em optimizar a produção dos citocromos trihémicos de G. metallireducens tendo em vista uma futura optimização das aplicações biotecnológicas. Para atingir este objectivo estas proteínas foram clonadas (excepto o PpcB) e posteriormente expressas heterologamente em Escherichia coli e purificadas por técnicas cromatográficas. Foi ainda possível efectuar uma caracterização preliminar das propriedades dos citocromos PpcA e PpcF. Os resultados obtidos por espectroscopia de ressonância magnética nuclear e espectroscopia UV-visível indicam que ambas as proteínas se encontram no estado de spin baixo na forma oxidada e reduzida.
Paralelamente, também foi também efectuado um estudo evolutivo sobre o citocromo c mono-hémico PccH de G. sulfurreducens, o qual se revelou crucial nas vias de electrossíntese desta bactéria. Os resultados obtidos mostram que este citocromo é um membro de uma nova sub-classe da classe I dos citocromos.
xi
List of Contents
Acknowledgements ... v
Abstract ... vii
Resumo ... ix
List of Contents ... xi
List of Figures ... xiii
List of tables... xvi
List of abbreviations and symbols ... xviii
1. Chapter I ... 1
1.1. Introduction ... 3
1.1.1. Geobacteraceae ... 4
1.1.2. Geobacter metallireducens ... 5
1.1.3. c-type cytochromes ... 6
1.1.4. Periplasmic cytochromes c7 in Geobacter ... 7
1.2. Methods ... 11
1.2.1. Cloning of cytochromes c7 from G. metallireducens ... 13
1.2.2. Preparation of competent cell by the calcium chloride method ... 15
1.2.3. Bacterial growth ... 15
1.2.4. Expression tests: PpcC and PpcE ... 16
1.2.5. Protein purification ... 16
1.2.6 NMR experiments ... 17
1.3. Results and discussion ... 19
1.3.1. Cloning of c7 cytochromes from G. metallireducens c7 ... 20
1.3.2 Heterologous expression of c7 cytochromes from G. metallireducens ... 22
1.3.3. Protein purification and expression yields ... 23
1.3.4. Protein characterization ... 28
1.4. Future Work ... 31
2. Chapter II ... 33
2.1. Introduction ... 35
2.2. Methods ... 37
2.3. Results and Discussion ... 39
2.3.1. Comparison with other monoheme cytochromes ... 40
3. References ... 45
4. Supplementary ... 49
4.1. Cloning ... 51
A. Primers design ... 52
B. PCR programs ... 54
C. Gel electrophoresis ... 55
xii
4.2. Purification ... 59
E. PpcF purification steps ... 60
F. Purification of PpcC ... 61
G. Purification of PpcE ... 63
H. Resume of Purification ... 65
4.3. Spectrometry and Spectroscopic Characterization ... 67
I. Mass spectrometry spectra ... 68
J. Visible spectra ... 69
K. NMR spectra... 71
xiii
List of Figures
Figure 1: Scheme of a Geobacter-powered microbial fuel cell ... 5
Figure 2: The structure of c-type heme group labelled accordingly to the IUPAC nomenclature. 6
Figure 3: Structures of triheme periplasmic cytochromes from Geobacter sulfurreducens: PpcA, PpcB, PpcC, PpcD and PpcE ... 7
Figure 4: The nar operon encodes the nitrate and nitrite transporters (narK-1, narK-2), two c -type cytochromes including PpcF, and two genes of molybdenium cofactor biosynthesis (moeA-2, moaA-2) . ... 8
Figure 5: Alignment of cytochromes c7 amino acid sequences ... 9 Figure 6: Overview of the methodology used to clone, produce, purify and characterize triheme
cytochromes from G. metallireducens... 12
Figure 7: Gel electrophoresis 0.8% to evaluate the quality of PCR fragments. ... 20
Figure 8: Gel electrophoresis 0.8% resulting from PCR of colonies of PpcA. ... 21
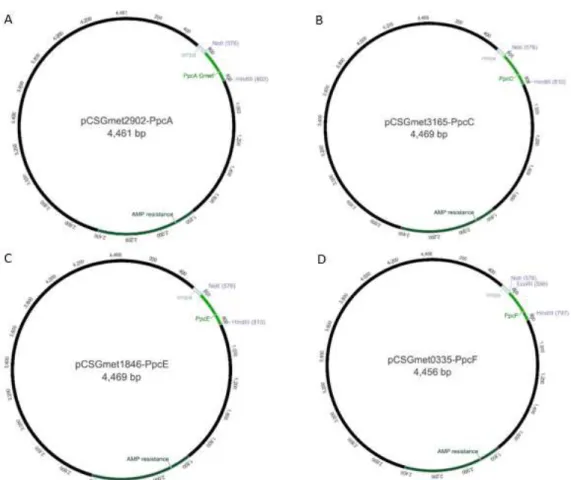
Figure 9: A - Plasmid pCSGmet2902-PpcA resulting from the cloning of PpcA sequence. B -
Plasmid pCSGmet3165-PpcC resulting from the cloning of PpcC sequence. C - Plasmid pCSGmet3166-PpcE resulting from the cloning of PpcC sequence. D - Plasmid pCSGmet0335-PpcF resulting from the cloning of PpcC sequence. In each plasmid, the arrows indicate the hybridization site of pCK32 primers. ... 21
Figure 10: Pellets from periplasmic fraction of PpcF and PpcE. ... 22
Figure 11: SDS-PAGE electrophoresis gel stained with Comassie blue and TMBZ/H2O2 for the
periplasmic fractions of PpcE obtained from cell cultures induced with different concentrations of IPTG. ... 22
Figure 12: SDS-PAGE electrophoresis gel stained with Comassie blue and TMBZ/H2O2 for the
periplasmic fractions of PpcC obtained from cell cultures induced with different concentrations of IPTG. ... 23
Figure 13: Elution profile for the cation exchange column chromatography equilibrated with 10
mM Tris-HCl, pH 8 (flow rate of 1 ml/min) for PpcA. ... 24
Figure 14: SDS-PAGE electrophoresis gel stained with Comassie blue and TMBZ/H2O2 for the
main peaks obtained in the chromatographic purification steps of PpcA. ... 24
Figure 15: Elution profile for the molecular exclusion column chromatography equilibrated with
100 mM sodium phosphate buffer, pH 8 for PpcA. ... 25
Figure 16: A- Elution profile for the cation exchange column chromatography equilibrated with
10 mM Tris-HCl, pH 8 for PpcF (flow rate of 1 ml/min). B- SDS-PAGE electrophoresis gel stained with Comassie blue from the collected fractions during the cation exchange column chromatography.. ... 25
Figure 17: Elution profile obtained in molecular exclusion column chromatography for each band obtained in the cationic exchange chromatography step for PpcF.. ... 26
Figure 18: SDS-PAGE electrophoresis gel stained with Comassie Blue correspondent to the
fractions of the more intense band obtained in the molecular exclusion chromatography of PpcF purification procedure. ... 27
Figure 19: Visible absorption spectra of PpcA in the oxidized and reduced forms. ... 28
Figure 20: 1D-1H NMR spectra of PpcA (70 µM) obtained at 25 ºC before and after
lyophilization. ... 29
xiv
Figure 22: Sequence alignment of the top six hits returned for the amino acid sequence of the
mature PccH using the basic local alignment search tool (BLAST)... 40
Figure 23: Amino acid sequence comparison of Gs PccH cytochrome c with prokaryotic c-type monoheme cytochromes. ... 41
Figure 24: A gallery of representative bacterial class I monoheme cytochromes including PccH shown as cartoons.. ... 43
Figure A- 1: Sequence of ppcA and the primers forward and reverse used for the gene amplification.. ... 52
Figure A- 2: Sequence of ppcC and the primers forward and reverse used for the gene amplification.. ... 52
Figure A- 3: Sequence of ppcE and the primers forward and reverse used for the gene amplification.. ... 53
Figure A- 4: Sequence of ppcF and the primers forward and reverse used for the gene amplification.. ... 53
Figure C- 1: Agarose gel electrophoresis (0.8%) with the result of PCR fragment amplification for ppcC (351 bp), ppcE (336 bp), ppcB (336 bp). ... 55
Figure C- 2: Agarose gel electrophoresis (0.8%) with the result of colonies PCR amplification with pCK32 primers for PpcB and PpcC. ... 55
Figure C- 3: Agarose gel electrophoresis (0.8%) with the result of colonies PCR amplification with pCK32 primers for PpcC and PpcE. ... 55
Figure C- 4:Agarose gel electrophoresis (0.8%) with the result of PCR fragment amplification for ppcB (336 bp) with a different cloning protocol described in section 1.3.1.. ... 56
Figure D- 1: DNA sequencing results for each c-type cytochrome from G. metallireducens. .... 57
Figure E- 1: Elution profile for the cation exchange column chromatography equilibrated with 10 mM Tris-HCl, pH 7.5 (flow rate of 1 ml/min) for PpcF. ... 60
Figure E- 2: Elution profile for the cation exchange column chromatography equilibrated with 10 mM Tris-HCl, pH 8.5 (flow rate of 1 ml/min) for PpcF. ... 60
Figure F- 1: Elution profile for the cation exchange column chromatography equilibrated with 10 mM Tris-HCl, pH 8 for PpcC ... 61
Figure F- 2: Elution profile for the molecular exclusion column chromotography equilibrated with 100 mM sodium phosphate buffer, pH 8 for PpcC ... 61
Figure F- 3: SDS-PAGE electrophoresis gel stained with Comassie blue (A) and the TMBZ/H2O2 (B) correspondent to the collected fractions of PpcC cytochrome purification steps ... 62
Figure G- 1: Elution profile for the cation exchange column chromatography equilibrated with 10 mM Tris-HCl, pH 8 for PpcE ... 63
Figure G- 2: Elution profiles for the molecular exclusion column chromatography equilibrated with 100 mM sodium phosphate buffer, pH 8 for PpcE ... 63
Figure G- 3: SDS-PAGE electrophoresis gel stained with Comassie blue (A) and the TMBZ/H2O2 (B) correspondent to the collected fractions of PpcE cytochrome purification steps ... 64
Figure I- 1: Mass spectrometry spectrum of purified PpcA ... 68
Figure I- 2: Mass spectrometry spectrum of purified PpcF... 68
Figure J- 1: Absorption spectrum of PpcF in the oxidized and reduced ... 69
Figure J- 2: Absorption spectrum of PpcC in the oxidized and reduced ... 69
xv
Figure K- 1: 1D-1H NMR spectra of the oxidized before and after lyophilized triheme
cytochrome PpcF (70 µM) obtained at 25 ºC. ... 71
Figure K- 2: 1D-1H NMR spectra of the reduced and oxidized triheme cytochrome PpcF (70
xvi
List of tables
Table 1: Access number in Kyoto Encyclopedia of Genes and Genomes Web site and signal
peptide cleavage site calculated by two bioinformatics tools for the five periplasmic triheme cytochromes from G. metallireducens... 13
Table 2: Primers used to amplify the sequence of each protein. ... 14
Table 3: Expression yields for triheme cytochromes from G. metallireducens. ... 27
Table 4: Summary of the optical absorption maxima in oxidized and reduced spectra for each
triheme cytochrome from G. metallireducens. ... 29
Table B- 1: PHUSION program ... 54
Table B- 2: PCR colonies program ... 54
Table H- 1: Calculated molecular weight and isoelectric point for the triheme cytochromes from
G. metallireducens using the EXPASY tool ... 65
Table H- 2: Elution gradient value and elution volume for the triheme cytochromes from G. metallireducens in the cationic and molecular exclusion chromatography steps, respectively. .. 65
Table L- 1: Main solutions used in this work ... 71
xviii
List of abbreviations and symbols
1D One dimensional
2D Two dimensional
2xYT 2x yeast extract-tryptone medium AQDS Anthraquinone-2,6-disulfonic acid
AMP Ampicillin
BCA Bicinchoninic acid assay
BLAST Basic local alignment search tool
CLO Chloramphenicol
DNA Deoxyribonucleic acid
D2O Deuterium oxide (heavy water)
E.coli Escherichia coli
EDTA Ethylenediamine tetra-acetic acid IPTG Isopropyl β-D-1-thiogalactopyranoside
LB Luria Broth medium
NCBI National center for biotechnology information
MW Molecular weight
NaPi Sodium phosphate buffer
NMR Nuclear magnetic Resonance
NOESY Nuclear Overhauser effect spectroscopy OD 600 Optical density at 600 nm
pI Isoelectric point
ppm Parts per million
PSA Persulfate ammonium
rpm Rotations per minute
SDS-PAGE Sodium dodecyl sulfate polyacrylamide gel electrophoresis
TEMED Tetramethylethylenediamine
Tris Tris(hydroxymethyl)aminomethane
TOCSY Total correlation spectroscopy UV-visible Ultraviolet-visible
1
1. Chapter I
Fishing the key biological components of the
bacterium
Geobacter
metallireducens
for
3
4
1.1.1. Geobacteraceae
The Geobacter genus represents one of the most usually studied groups of microorganisms capable of extracellular electron exchange. It is characterized by Gram-negative and anaerobic bacteria from the δ-Proteobacteria family. However, recently, studies suggested that Geobacter sulfurreducens can tolerate small amounts of oxygen are therefore is not strictly anaerobic1. The members of Geobacter genus are commonly found in several environments due to their important role in degradation of organic compounds and bioremediation of toxic metals, especially in aquifers polluted by or rich in organic matter 2–5. These bacteria are particularly abundant in Fe(III) rich environments in which they promote the metal reduction process. Therefore, it is fundamental to understand the environmental factors that modulate their growth and metabolic activity6.
The Geobacter members are very interesting due to their roles in the carbon and metal cycles in the aquatic sediments. They are relevant from the point of view of bioremediation in underground aquifers contaminated by organic and metal compounds as mentioned above. The Geobacter group can be also used in microbial fuel cells (MFCs) for producing electricity from organic matter in which microorganisms are the catalyst for oxidizing the organic matter (Figure 1). The anaerobic anode chamber contains organic fuel and a graphite electrode. The cathode
chamber has a similar electrode and is aerobic. Geobacter transfers electrons released from the oxidation of organic matter onto the anode. The electrons flow from the anode to the cathode. The two chambers are separated by a cation-selective membrane that permits the protons that are released from oxidized organic matter to migrate to the cathode side, where they combine with electrons and oxygen to form water6. However, difficulties in scaling up MFCs for extracting
energy on an industrial scale have significantly limited their short-term practical use 7.
In 1987, Geobacter metallireducens was the first microorganism to be isolated from sediments in the Potomac River from Washington D.C. This bacteria obtains its metabolic energy by using iron oxide in the same way that humans use oxygen. G. metallireducens and other species that have subsequently been isolated from a wide diversity of environments represent a very important model of iron transformations on modern earth and may explain geological phenomena, such as the massive accumulation of magnetite in ancient iron formations8.
The most studied members of the Geobacteraceae family are the G. sulfurreducens and G. metallireducens. The first studies on the mechanisms for Fe (III) oxide reduction were carried out on G. sulfurreducens because it was the first species of this family for which a genetic system was developed9.
5
Nowadays, G. metallireducens is more appealing than G. sulfurreducens in some physiological aspects, which include for example aromatic compounds metabolization11.
Figure 1: Scheme of a Geobacter-powered microbial fuel cell12. The anaerobic anode chamber contains the organic fuel, whereas the cathode chamber is aerobic. Geobacter cells transfer electrons released from the oxidation of the organic fuel onto the anode, which can be used to power electric devices. The two chambers are separated by a cation-selective membrane that permits the protons that are releasedto migrate to the cathode side, where they combine with electrons and oxygen to form water.
1.1.2. Geobacter metallireducens
G. metallireducens has a high importance since it was the first discovered microorganism with the ability to: (i) storage energy for their own growth from the oxidation of compounds coupled to reduction of Fe(III), Mn(IV) or U(VI); (ii) oxidize aromatic hydrocarbons under anaerobic conditions13; (iii) utilize humic substances as electron acceptors; (iv) couple the oxidation of organic compounds to carbon dioxide using an electrode as the sole electron acceptor and (v) use of a poised electrode as a direct electron donor 10
6
Tremblay and co-workers 15 identify a very important role for
pilli in the Fe(III) reduction and in the transfer of electrons to electrodes in G. metallireducens. The motility is one of the reasons why these bacteria are more efficient in the reduction of Fe (III) oxides compared to G. sulfurreducens. However the c-type cytochromes are important to this process as well15. To date, the components and mechanisms underlying the extracellular electron transfer in G. metallireducens are not yet fully elucidated 16. This is a crucial step to contribute to develop future applications in biofuel production and bioremediation.
1.1.3. C-type cytochromes
Despite the lack of information regarding the precise extracellular electron transfer mechanisms, it is consensual that c-type cytochromes play a crucial role in this process. Cytochromes are electron transfer proteins containing one or more heme groups. The heme group is formed by a tetrapyrrole porphyrin ring coordinated to an iron atom. The cytochromes have characteristic absorption bands in the visible wavelength range that change with redox, spin and coordination state. Cytochromes can be classified as type a, b, c or d according to the type of substituents at the periphery of the porphyrin ring17.
The small size, high solubility and high helical content and the presence of the heme cofactor have permitted the study of cytochromes c through a variety of spectroscopic techniques18. In
c-type cytochromes the heme(s) group(s) is covalently bound through thioether bonds to cysteine residues of the polypeptide chain arranged in a typical CXXCH motif17. The heme group (Figure 2) is composed by proton-containing groups (four methyl groups, four
meso protons, two thioether protons, two thioether methyl and two propionate groups)19.
Figure 2: The structure of c-type heme group labelled accordingly to the IUPAC nomenclature19.
7
1.1.4. Periplasmic cytochromes c7 in Geobacter
Some extracellular electron transport components are well conserved between G. sulfurreducens and G. metallireducens. This is the case of the genes coding the MacA (Gmet_3091 and GSU_0445) and PpcA (Gmet_2902 and GSU_0612), which are involved in Fe (III) and U(VI) reduction. However many of the genes that code for extracellular electron transfer by G. sulfurreducens, like some essential c-type cytochromes, don’t have homologs in G. metallireducens.
Five triheme periplasmic cytochromes, designated PpcA, PpcB, PpcC, PpcD and PpcE, were identified in G. sulfurreducens 22, 23. These five cytochromes are small soluble proteins, each with approximately 10 kDa20
, and have been extensively studied. These cytochromes have bis-His axial coordination, different and negative redox potentials and their structures have been determined 22 (
Figure 3). The hemes are numbered I, III and IV, a designation that derives from
the superimposition of the hemes with those of the structurally homologous tetraheme cytochromes c3. 22–24.
Figure 3: Structures of triheme periplasmic cytochromes from Geobacter sulfurreducens: PpcA (2LDO, orange), PpcB (3BXU, green), PpcC (3H33, blue), PpcD (3H4N, grey) and PpcE (3H34, pink).
PDB accession code in parenthesis with the corresponded color in the figure.
8
cytochrome PpcF derives from the the relative little homology of this protein with PpcD. As mentioned above, it is suggested that these triheme cytochromes are involved in extracellular electron exchange. In particular, PpcA (coded by gene gmet2902) was shown to be important for direct interspecies electron transfer (DIET). DIET consists in microbial syntrophy in which microorganisms establish electrical connections for the transfer of electrons from one syntrophic partner to another7. PpcA doesn’t directly help to make extracellular electrical contact between
the microorganisms, though it is involved in the process of extracellular electron transfer 25. On the other hand PpcF (coded by gene Gmet0335) allows the transfer of electrons to the nitrate reductase from extracellular electron donors such as humic substances or graphite electrodes10. As mentioned above,
G. metallireducens has the ability to reduce nitrate, in contrast with G. sulfurreducens. The nitrate reductase activity of G. metallireducens is attributed to the narGYJI genes (Figure 4). The gene ppcF of nar operon encodes a periplasmic triheme c-type cytochrome involved in this reduction processes.
Using the PpcF amino acid sequence, the non-redundant amino acid database of NCBI was searched using the Basic Local Alignment Search Tool (Blast)26, and in addition to the five cytochromes c7 mentioned above, other cytochromes c7 were found: Geobacter
metallireducens; Geobacter sulfurreducens KN400; Geobacter sulfurreducens PCA; Geobacter sp. M18; Geobacter bemidjiensis; Geobacter lovleyi; Pelobacter propionicus. (Figure 5).
This work constitutes the first step to understand the role of periplasmic triheme cytochromes in G. metallireducens and simultaneously build foundations to optimize future biotechnological applications driven by these bacteria. In order to achieve this goal it is first necessary to clone, express and purify each protein (PpcA, PpcB, PpcC, PpcE and PpcF).
9
Figure 5: Alignment of cytochromes c7 amino acid sequences. PpcA-F, Geobacter metallireducens; Gsk, Geobacter sulfurreducens KN400; Gsu, Geobacter
sulfurreducens PCA; Geb, Geobacter sp. M18; Gbm, Geobacter bemidjiensis; Glo, Geobacter lovleyi; Ppd, Pelobacter propionicus. The numbers refer to the gene that encodes
11
12
In order to understand the mechanisms underlying the extracellular electron transfer it is necessary to study their components. In the present work the focus was the triheme cytochromes from G. metallireducens. The detailed biochemical study of these proteins requires considerable amounts of material. Thus, it is not practical to isolate the proteins directly from G. metallireducens, because of the slow growth rates and required anaerobic conditions. In addition, due to the large amount of c-type cytochromes produced by G. metallireducens the purification of a target one is also more complex. Consequently, the first step of this work encompassed the cloning and expression of each protein in E. coli. The use of E.coli in heterologous expression holds up to the fact that there are a lot of expression vectors, absence of endogenous cytochromes expression during the fast aerobic growth, easy culture maintenance, and low cost. The second step of the protocol involved the purification of each cytochrome using cation exchange and molecular exclusion chromatography. For last, the proteins were preliminary characterized by mass spectrometry, UV-visible and NMR spectroscopy. An overview of the methodology used is described in Figure 6.
13
1.2.1. Cloning of cytochromes c7 from G. metallirecducens
Gene sequences for each triheme cytochrome from G. metallireducens studied in this work were obtained from Kyoto Encyclopedia of Genes and Genomes Web site (http://www.genome.jp/kegg-bin/show_organism?org=gme). The accession numbers are listed in Table 1. Each triheme cytochrome was predicted to be located on the bacteria’s periplasm.
The prediction of the signal peptide cleavage site of each protein was calculated by bioinformatics tools, the Signal IP 4.1 server27 and PSORT Prediction (http://psort.hgc.jp/form.html). This step allowed us to identify the soluble part of each protein for the cloning step (Supplementary 4.1.A).
Table 1: Access number in Kyoto Encyclopedia of Genes and Genomes Web site and signal peptide
cleavage site calculated by two bioinformatics tools for the five periplasmic triheme cytochromes from G. metallireducens.
Protein Access number Signal peptide Cleavage
Signal IP 4.1 PSORT
PpcA Gmet_2902 20-21 20
PpcB Gmet_3166 20-21 20
PpcC Gmet_3165 23-24 23
PpcE Gmet_1846 20-21 20
PpcF Gmet_0335 22-23 22
The primers for each gene sequence of the five triheme cytochromes and the expression vector that encodes for the PpcF protein were already available in the laboratory. Primers were purchased from Invitrogen, restriction enzymes and T4 DNA ligase from Fermentas.
The genes coding for PpcA, PpcB, PpcC and PpcE were amplified with primers containing restriction sites for the enzymes HindIII and NotI (Table 2) using Phusion
High-Fidelity DNA polymerase (Finnzymes) (Program in Supplementary 4.1.B, Table B-1).
Amplification products were purified using Wizard_PCR Preps DNA Purification System (Promega). A 0.8% agarose gel electrophoresis was used to confirm the fragment size of each amplified PCR fragment. The digestion of the fragments was performed with the restriction enzymes HindIII (VWR) and NotI (Promega) at 37ºC during ≈6 hours, and then 20 min at 65ºC to inactivate the restriction enzymes.
14
ligation product was transformed into E. coli DH5α competent cells prepared by the calcium chloride method and plated for selection in LB medium supplemented with ampicillin (100 µg/mL). The colonies were screened by colony PCR (Program in Supplementary 4.1.B, Table B-2) with pCK32 primers (pCK32_fw: 5’-GGCTCGTATGTTGTGTGGAA-3’ and pCK32_rv: 5’
-AAGGGAAGAAAGCGAAAGGA-3’). The amplification was performed using Taq DNA polymerase (VWR). After the confirmation of the fragment size by 0.8% agarose gel electrophoresis of the PCR product, the cells were grown in liquid LB medium supplemented with ampicillin for plasmid extraction and sequencing. All DNA quantifications were done in Nanodrop 1000 (Thermo Scientific).
Table 2: Primers used to amplify the sequence of each protein.
Protein Primer
Forward Reverse
PpcA CGGCCTTGCGGCCGCCGCTGA
CGAGCTTACCTTCAAG
CGCCGGAAAGCTTCACCATTACTTCT TGTGGCAATCGCCG
PpcB GCGGCGGCCGCGGCCGACACC
CTCAC
CCGGCTGATTCGGCCGAAGCTTTTAC TTCTTGTGGC
PpcC GAGCGGCGGCCGCCSTCGAGA
CCATTACCTTTC
CGTCATAGACAAAGCTTCAACGAGTT AGCCACCTCCGTGAC
PpcE CGTACCCGTCGCGGCCGCTGC
GGATACCATGATATTC
CCGGCTAAGCTTGACATCAAGGGTG CTACTTCCTGTGGTC
PpcF CACATGCGGCCGCCGCCGACG
TATTTGAATTC
GCCCCTACCGCAGGTTCAAGCTTTTA CTTCTTGTGGCAG
15
1.2.2. Preparation of competent cell by the calcium chloride method
Escherichia coli cells, strain BL21, were streaked into Luria Bertani (LB) medium plate supplemented with 34 µg/mL chloramphenicol (CLO) from NZYtech and incubated at 37ºC, overnight. A single colony was selected from the plate and inoculated in 5 mL of LB medium supplemented with 34 µg/mL of CLO. The inoculums were grown at 37ºC overnight (200 rpm) and then 500 µL of that culture was transferred into 50 mL LB medium supplemented with the same antibiotic. Cultures were grown at 37 °C, 200 rpm, until reached an OD600 between 0.4
and 0.6 (approximately during 3 hours).
Cells were harvested by centrifugation at 2,500 xg during 15 min at 4°C. The pellet was gently resuspended in 10 mL of ice cold 0.1M CaCl2 and incubated on ice during 1 hour. The
cells were then centrifuged at 2,500 xg, 10 min, 4°C. The supernatant was removed and the cell pellet was resuspended in 2 mL of pre-cooled 0.1 M CaCl2 solution and 0.5 mL of pre-cooled
80% glycerol.
1.2.3. Bacterial growth
Escherichia coli is the most common expression host in the heterologous expression of multiheme proteins. The gene cluster, ccmABCDEFGH is responsible for maturation of c-type cytochromes under anaerobic conditions in E. coli. To preserve this characteristic in aerobic conditions the gene cluster was cloned to vector pACYC184 28, renamed pEC86 29. The co-expression of pEC86 with a second plasmid pCK32, a pUC derivate, which harbors the gene sequence that encodes for each triheme cytochrome, OmpA leader sequence (drive the new polypeptide to periplasm), a resistance marker for chloramphenicol and lac promoter allows the heterologous expression of c-type cytochromes in E.coli under aerobic conditions 30.
In this system, the lac promoter on pCK32 plasmid is induced by addition of isopropyl- β -D- 1- thiogalactopyranoside (IPTG) from NZYtech. This inductor is a non- metabolizable substrate analog of lactose, which induces the expression of lac operon in E. coli. The mechanism of action involves the IPTG ligation to the lac repressor, causing the alteration of its conformation. The inactivation prevents the repression, thus allowing the transcription of genes contained in this operon, it means that after the IPTG induction, the gene harboring the c-type cytochrome is expressed 30.
E. coli strain BL21 containing the plasmid pEC86 29 (prepared in Section 1.2.2) was
co-transformed with the plasmid pCK32, the expression vector harboring the gene sequence encoding for each triheme cytochrome. Transformed E. coli cells were grown in 2x yeast extract-tryptone (2xYT) supplemented with 34 µg/ml chloramphenicol (CLO) and 100 µg/ml ampicillin (AMP), both from NZYtech. Colonies were selected and aerobically grown until an OD600 between 1.8 and 2 at 30oC, 200 rpm and overnight. 0.1% of this culture was transferred
to 1L of 2xYT medium, also supplemented with 34µg/mL CLO and 100µg/mL AMP and grown for approximately 10 hours at 30oC and 180 rpm. When the cultures reached an OD
16
the protein expression was induced with 10 µM of IPTG 24. After overnight incubation at 30oC and 160 rpm, cells were harvested by centrifugation at 4000 xg, 20 min and 4 oC. The cell pellet was gently resuspended in 30 mL of lysis buffer (20% sucrose (Panreac), 100 mM Tris-HCl (NZYtech) pH 8.0 and 0.5 mM EDTA (Sigma) containing 0.5 mg/mL of lysozyme (Merck)), per liter of initial cell culture. Then the suspension was incubated at room temperature during 15 min and after 15 min on ice with gently shaking. Finally, the cells were centrifuged at 14,700xg, 20 min at 4 oC. The supernatant constituted the periplasmic fraction, which was ultracentrifuged at 44,000xg during 1h and 30 min at 4 oC.
1.2.4. Expression tests: PpcC and PpcE
The yield of PpcC and PpcE obtained was too low, so it was necessary to test different conditions. The protocol used for bacterial growth was the same described in 1.2.3. Section
with the exception that four different IPTG (NZYtech) concentrations: 50 µM, 100 µM, 200 µM and 300 µM were used.
1.2.5. Protein purification
The purification of the proteins was performed using two chromatographic methods: cation exchange and molecular exclusion. The isoelectric point for each protein was estimated using Expasy Mw PI tools31.
17
1.2.6 NMR experiments
All of the NMR experiments were acquired in a Bruker Avance III 600 MHz spectrometer equipped with a triple-resonance cryoprobe (TCI) available at Faculdade de Ciências e Tecnologia, Universidade Nova de Lisboa. 1H chemical shifts were calibrated using the water
signal as internal reference:
𝛿𝐻2𝑂 = 5.11 − 0.012𝑇 (℃)
34
Equation 1
Spectra were processed using TopSpin (Bruker BioSpin, Karlsruhe, Germany). 1D-1H
19
20
1.3.1. Cloning of c7 cytochromes from G. metallireducens c7
The gene encoding for each triheme cytochrome from G. metallireducens was firstly cloned in the expression vector pCK32 and the resulting vectors were called pCSGMET2902, pCSGMET3165, pCSGMET1846 and pCSGMET0335 that encode for PpcA, PpcC, PpcE and PpcF, respectively. Only the results obtained for PpcA are presented in this section, since the cloning protocol was similar for each protein. The results obtained for the remaining proteins are given in the supplementary section.
The correct size of the PCR fragments was evaluated by gel electrophoresis, as described in Figure 7 for PpcA.
Figure 7:Gel electrophoresis 0.8% to evaluate the quality of PCR fragments. Fromleft to the right,
Gene ruler 100 bp DNA ladder (M), negative control (without DNA) and two PCR fragment amplified. PpcA (336 bp).
The analysis of Figure 7 shows that there is no amplification in the negative control. On
the other hand, the size of PpcA amplified fragment corresponds to the expected size (336 bp). A similar result was obtained for PpcC (Supplementary Figure C-1). In contrast, for PpcB and
PpcE the negative controls appear to have a contamination (Supplementary Figures C-1).
However,the amplified fragments appeared the correct size (336 bp) and therefore the cloning protocol was also carried out for PpcB and PpcE.
After ligation, a screening by colony PCR was performed and the fragments obtained were analyzed by gel electrophoresis (Figure 8).
The expected size for PpcA colonies fragment obtained from the amplification of the plasmid with the pCK32 primers is 571 bp. Therefore, the colonies numbered #1, #2, #8 and #12 were selected for sequencing. The sequencing results indicated that only colony #2 presented the correct sequence (Supplementary Figure D-1).
The gel electrophoresis obtained with the fragments resulting from the PCR of colonies transformed with plasmid containing the genes coding for the other triheme cytochromes are indicated in the SupplementaryFigure C-2 and Figure C-3. In the case of PpcC and PpcE the colonies that appeared to have the correct size (579, 580 respectively) were selected for sequencing. The results obtained showed that all the selected colonies had the correct sequence (Supplementary Figure D-1). In contrast, no bands were observed in the gel
21
case, a different protocol was performed but unfortunately it was also not possible to obtain the plasmid coding for PpcB. The results obtained for PpcB using this alternative protocol are described in Supplementary Figure C-4.
Figure 9: A - Plasmid pCSGmet2902-PpcA resulting from the cloning of PpcA sequence. B - Plasmid pCSGmet3165-PpcC resulting from the cloning of PpcC sequence. C - Plasmid pCSGmet3166-PpcE resulting from the cloning of PpcC sequence. D - Plasmid pCSGmet0335-PpcF resulting from the cloning of PpcC sequence.
22
To sum up, it was possible to clone the genes coding for PpcA, PpcC, PpcE and PpcF cytochromes in the pCK32 plasmid. The obtained plasmids were designated pCSGmet2902-PpcA, pCSGmet3165-PpcC, pCSGmet1846-PpcE and pCSGmet0335-PpcF. (Figure 9). The
gene coding for PpcF was already cloned in the laboratory (pCSGmet3166-PpcF).
1.3.2 Heterologous expression of c7 cytochromes from G. metallireducens
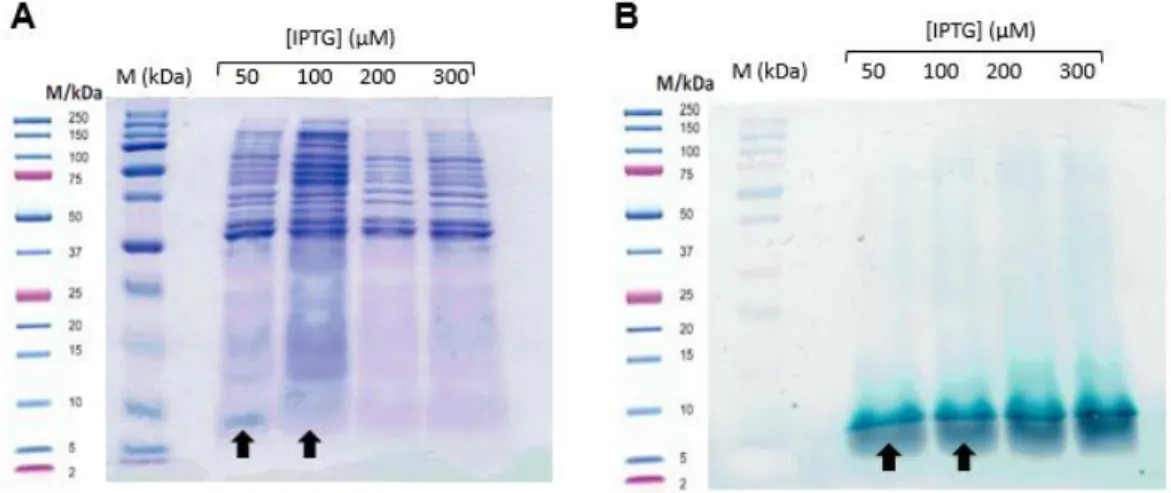
Escherichia coli was used as host, because it presents an efficient expression system to produce multiheme c-type cytochromes. This system has already been described and successfully applied to the expression of multiheme cytochromes containing up to 12 heme groups 19,30. During the bacterial growth, and particularly after cell harvesting, the reddish pellets are indicative of a successfully expression of the target cytochrome. This was observed for cells expressing PpcA and PpcF but not for PpcC and PpcE (Figure 10).
In the case of the two latter cytochromes the lower yields (Table 3) can be attributed to the amount of IPTG used. As mentioned in the Methods section, 10 µM IPTG was used by analogy to that used to express triheme cytochromes from G. sulfurreducens. In order to confirm this hypothesis expression tests were carried out for PpcC and PpcE cytochromes. Analysis of the protein content of the periplasmic fractions by SDS-PAGE indicates that 100 µM IPTG concentration is the more promising concentration to express PpcE (Figure 11) and explain the low yields obtained with 10 µM IPTG. In the SDS-PAGE stained by TMBZ/H2O2 a band that might
correspond to PpcE is observed for all IPTG concentrations used.
Figure 10: Pellets from
periplasmic fraction of PpcF (red) and PpcE (brown-reddish).
Figure 11: SDS-PAGE electrophoresis gel stained with Comassie blue (A) and TMBZ/H2O2 (B) for the periplasmic fractions of PpcE obtained from cell cultures induced with different concentrations of IPTG. From the left to the right: marker Precision plus proteintm Dual Xtra Standards
23
On the other hand, the expression tests for cytochrome PpcC were not very conclusive (Figure 12). In the heme staining SDS-PAGE it is visible one band that corresponds to the
PpcC at ~10 kDa in all IPTG concentrations used. Regardless, the expression yields were very low to allow for characterization of PpcC (see below). Therefore, for this cytochrome other expression vectors and conditions (such as temperature) need to be tested in order to optimize the protein expression.
Figure 12: SDS-PAGE electrophoresis gel stained with Comassie blue (A) and TMBZ/H2O2 (B) for the periplasmic fractions of PpcC obtained from cell cultures induced with different concentrations of IPTG. From the left to the right: marker Precision plus proteintm Dual Xtra Standards (M), periplasmic fraction obtained from cell cultures induced with 50 µM, 100 µM, 200 µM, 300 µM IPTG. The best concentration is indicated with a black arrow.
1.3.3. Protein purification and expression yields
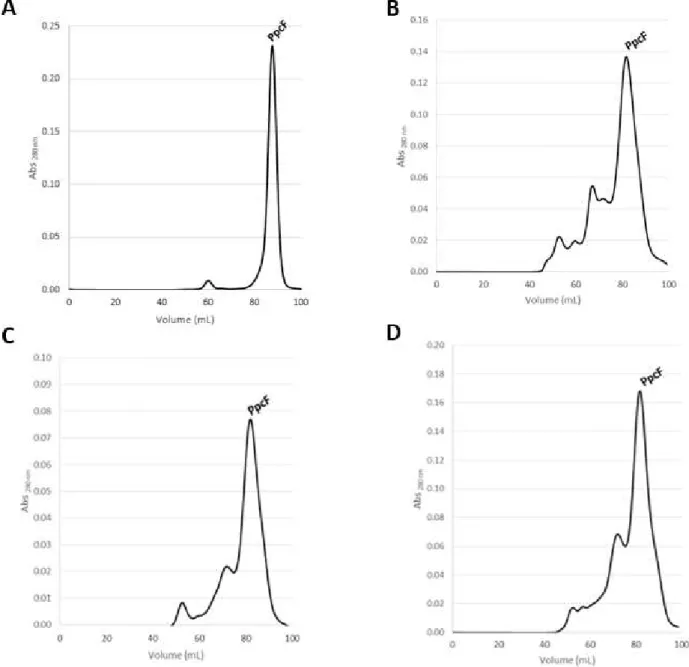
As described in the Methods section, the purification of the four triheme cytochromes (PpcA, PpcC, PpcE and PpcF) followed an identical methodology. After the expression, the proteins were purified by cation exchange followed by molecular exclusion chromatography. The progress of the purification was monitored by SDS-PAGE electrophoresis.
Due to the high isoelectric point of these cytochromes (Supplementary Table H-1) the
proteins strongly bind to the cation exchange column at pH 8. The bound proteins were then eluted with a NaCl gradient ranging from 0 to 300 mM. Each protein of interest was eluted at different percentage as is represented in (Supplementary Table H-1).
24
The fractions correspondent to these two peaks were combined separately and analyzed by SDS-PAGE electrophoresis (Figure 14).
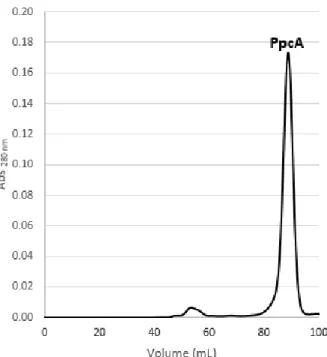
The fraction corresponded to peak 2 in the cation exchange chromatography was further purified by molecular exclusion chromatography (Figure 15) and the protein of interest
was eluted at different volumes with 100 mM sodium phosphate buffer, pH 8 (Supplementary Table H-2). After this purification step, only one band was observed in the SDS-PAGE
electrophoresis (Figure 14) and corresponds to a MW of approximately 10 kDa.
Figure 14:SDS-PAGE electrophoresis gelstained with Comassie blue for the main peaks obtained in the chromatographic purification steps of PpcA. From the left to the right: 1- periplasmic fraction; 2- cation
exchange column chromatography band #2; 3- cation exchange column chromatography band #1, 4- molecular exclusion column chromatography band and marker precision plus proteintm Dual Xtra Standards (M).
25
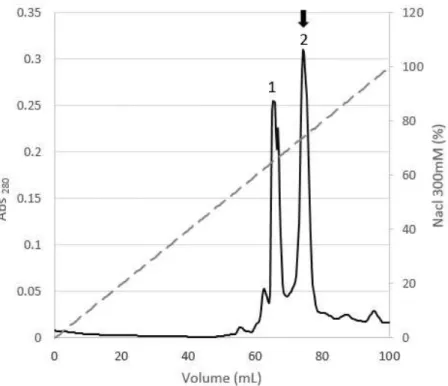
Although PpcF was already cloned in the laboratory, no attempts had been made to express and purify it. The expression was successfully achieved in the present work but there were some problems during the purification of this protein. In the cationic exchange
Figure 15: Elution profile for the molecular exclusion column chromatography equilibrated with 100 mM sodium phosphate buffer, pH 8 for PpcA. PpcA eluted at 85 ml.
Figure 16: A-Elution profile for the cation exchange column chromatography equilibrated with 10 mM Tris-HCl, pH 8 for PpcF (flow rate of 1 ml/min). Primary and second y-axis , represent the variation of absorbance at
280 nm (dark solid line) and the NaCl gradient profile (grey dashed line), respectively. PpcF eluted 55%, 65%, 70% and 75%. B- SDS-PAGEelectrophoresis gel stained with Comassie blue from the collected fractions during the cation exchange column chromatography. Each number in the SDS-PAGE corresponds to a band in the
26
chromatography, four bands were obtained (Supplementary Figure 18A). The analysis of the SDS-PAGE gel indicates that the target protein is present in each fraction.
Each fraction obtained in the cation exchange chromatography was purified in separate by molecular exclusion chromatography. The elution profiles obtained are indicated in (Figure 17).
The fractions correspondent to the more intense bands obtained in the molecular exclusion chromatography were analyzed by SDS-PAGE (Figure 18). The results showed a
single band at the expected molecular weight for PpcF.
27
Figure 18: SDS-PAGE electrophoresis gel stained with Comassie Blue correspondent to the fractions of the more intense band obtained in the molecular exclusion chromatography of PpcF purification procedure. A-Dcorrespond to panels indicated in Figure 17.
Although the purification of PpcF was successfully achieved at pH 8, slightly modifications to the purification protocol were investigated in order to optimize the ionic exchange chromatography step. In fact, purification of PpcF was also carried out at pH 7.5 and 8.5 (see Supplementary Figures E-1 and E-2). However no major improvements were
obtained from these alterations.
The elution profiles obtained for the purification of cytochromes PpcC and PpcE are indicated in supplementary material (Supplementary Figures F-1 and F-2 for PpcC and Figures G-1 and G-2 for PpcE). The SDS-PAGE electrophoresis gels stained with Comassie
blue and TMBZ/H2O2 (Supplementary Figures F-3 and G-3 for PpcC and PpcE, respectively)
indicates that after the molecular exclusion chromatography step both proteins are not entirely pure. This indicates that the purification protocol for PpcC and PpcE requires further optimization.
Protein yields were quantified by visible spectroscopy using the PpcA from G. sulfurreducens extinction absorption coefficient of the α band characteristic of the protein reduced form (552 = 97.5 mM-1cm-1 )33. The yields obtained are indicated in Table 3.
Table 3: Expression yields for triheme cytochromes from G. metallireducens.
Protein Expression yield (mg/L cell culture)*
PpcA 1.95
PpcB -
PpcC 0.14
PpcE 0.02
28
1.3.4. Protein characterization
Due to the low expression yields of PpcC and PpcE only PpcA and PpcF molecular mass was confirmed by MALDI-TOF-MS. In the case of PpcA, the more intense peak in the mass spectrum corresponds to a molecular mass of 9691.48 Da ± 0.05% (Supplementary Figure I-1). The value obtained is slightly above the error compared with the expected value for
the mature PpcA (9682.58 Da; see Supplementary Table H-1). In the case of PpcF, the value
obtained from the mass spectrum corresponds to a molecular mass of 9739.80 Da ± 0.05% (Supplementary Figure I-2), which is in agreement with the predicted value for mature PpcF (9735.71 Da; see Supplementary Table H-1). For both measurements the equipment was
externally calibrated with a horse cytochrome sample, which might explain the deviations observed.
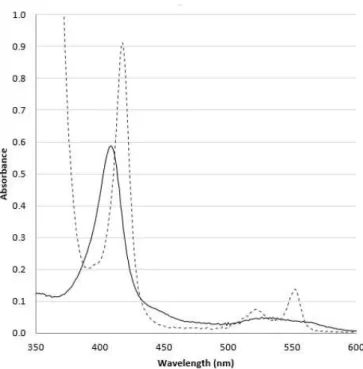
The optical absorption spectrum of PpcA has an intense peak (Soret) at 412 nm. Upon reduction the protein shows the Soret, β and α bands at 419 nm, 523 nm and 552 nm, respectively (Figure 19).
Figure 19: Visible absorption spectra of PpcA in the oxidized (solid line) and reduced (dashed line) forms.
Similarly, for the other three proteins (PpcC, PpcE and PpcF) the optical absorption spectra in the oxidized and reduced form are typical of low-spin hexacoordinated c-type cytochrome (see Supplementary J). The optical absorption maxima values for each
29
Table 4: Summary of the optical absorption maxima in oxidized and reduced spectra for each triheme cytochrome from G. metallireducens.
Optical
absorption(nm)
PpcA PpcC PpcE PpcF
Oxidized Soret 412 410 406 410
Reduced Soret 419 418 419 421
β-band 523 521 519 523
α-band 552 553 550 552
In addition to the optical spectroscopy and mass spectrometry characterization, were also probed the features of PpcA and PpcF in 1D 1H NMR spectra. For both proteins spectra were acquired before and after lyophilization to evaluate their integrity. The comparison of the spectra showed that the spectra are similar (Figure 20, Supplementary Figure K-1).
Figure 20: 1D-1H NMR spectra of PpcA (70 µM) obtained at 25 ºC before (A) and after (B) lyophilization.
The 1D 1H NMR spectra of the reduced and oxidized state for PpcA and PpcF are
indicated in Figure 21 and Supplementary Figure K-2, respectively. The NMR spectra
-30
type cytochromes showing signals in the reduced and oxidized states below 12 and 20 ppm, respectively.
Figure 21:1D-1H NMR spectra of the reduced (A) and oxidized (B) triheme cytochrome PpcA (70 µM) obtained at 25 ºC, pH 8. The typical regions of the heme substituents in the oxidized spectrum are indicated.
Meso protons
Heme axial histidines Thioether methyls, Thiother protons
Heme methyls, Heme propionate group
31
1.4. Future Work
33
2. Chapter II
PccH, a new class of monohemic cytochrome
The results shown in this chapter have been published in the paper Dantas JM, Campelo LM, Duke NEC, Salgueiro CA, Pokkuluri PR (2015) "The structure of PccH from Geobacter sulfurreducens – a novel low reduction potential monoheme cytochrome essential for accepting electrons from an electrode", FEBS Journal, 282, 2215-2231
35
36
Geobacter spp. demonstrated an amazing respiratory versatility that confers these bacteria a highly relevant role in the biogeochemistry of several anaerobic environments. These capabilities show a huge potential for Geobacter based applications in bioenergy production and bioremediation35. Since these bacteria can use insoluble electron donors and acceptors besides the common soluble compounds. The use of compounds that cannot freely diffuse into and from cells requires that microorganisms be capable of extracellular electron exchange. This principle represented the Geobacter-based bioenergy strategies, like microbial fuel cells and microbial electrosynthesis.
Microbe-electrode exchange is also required for microbial electrosynthesis in which microorganisms use electrons supplied by electrodes for the reduction of carbon dioxide to multicarbon fuels or other organic commodity chemicals. The establishment of an efficient microbe–electrode exchange by Geobacter spp. and other electrogenic bacteria, such as Shewanella spp., requires the participation of electron transfer proteins to link intracellular oxidative reactions to extracellular reductions beyond the outer membrane and vice-versa. Ross et al. 36 showed that the Mtr respiratory pathway, which catalyzes electron flow from cytoplasmic oxidative reactions to electrodes in Shewanella oneidensis strain MR-1, is also used for the electrode-dependent fumarate reduction
Studies analyzing the gene transcript abundance in current-consuming versus current-producing of G. sulfurreducens biofilms reveal that electrode-dependent fumarate reduction was independent of major outer membrane cytochromes required for extracellular electron exchange. The fumarate reduction was dependent from the monoheme c-type cytochrome designated PccH 37. Deletion of gene pccH completely inhibited electron transfer from electrodes but had no influence on electron transfer to electrodes, which suggest different routes for electron transfer into and out of the cell in G. sulfurreducens.
PccH is characterized a basic protein with a polypeptide chain length of 129 amino acids that contains a typical heme-binding CXXCH sequence close to the N-terminus. The structure of PccH, taken together with the sequence comparisons, suggests that this cytochrome forms the first characterized representative of a new subclass of monoheme cytochromes. To the best of our knowledge, PccH is the first c-type monoheme cytochrome showing a negative reduction potential value within the physiological pH range of growth for G. sulfurreducens. This feature permits the protein to be redox active at the typically negative working potential ranges encountered by this bacterium.
37
38
Amino acid sequence comparisons were performed using BLAST at the NCBI 38. Multiple sequence alignments and dendograms were produced using CLUSTAL X2 39 and then plotted using DRAWTREE from the PHYLIP package 40. The structural comparisons are
39
40
2.3.1. Comparison with other monoheme cytochromes
There are a total of 14 small monoheme cytochromes (10–15 kDa) in G. sulfurreducens. However, a BLAST search with the sequence of PccH does not show any significant sequence homology with the other monoheme cytochromes from G. sulfurreducens. As reported previously 35, the BLAST search revealed a relatively high homology (70% identity) with a monoheme c-type cytochrome from Pelobacter propionicus but modest homology with cytochromes from other organisms (Figure 22).
Ambler’s class I cytochromes include the subclasses of monoheme cytochromes c2, c5,
c6, c551/552, c553 and c554 18,42. More recently, Stelter et al. 43 proposed a new subclass of class I cytochromes for c-type cytochromes from the bacteria of the Bacteroidetes phylum. Representative sequences from all the above mentioned cytochromes were used together with the top six hits returned for the BLAST search with PccH sequence to produce the dendogram presented in Figure 23. From this analysis, it is clear that a separate group is formed by PccH and its most homologous sequences (Figures 22 and Figure 23), suggesting that they are representatives of a new subclass within the class I cytochromes. Further structural evidence discussed below reinforces this proposal.
GsPccH G E VTY R K D I KPI F D V RCA GC HG A D A APE Y H AFK A E K E K W L A K G QGMRM D TYS HLI F Y T A WPD TG ALM R R
Pp YP_900515.1 (70%) Q E TTW R K D V KPL F D A RCA AC HS D V S APE H D AFK E K K Q R W L A N G QGMRM N SYS HLI Y Y T A WPG TG ALM R R
Tn YP_007216771.1 (54%) E E VTY I E H V QPL F E A QCA GC HG V N A -PY V G DFD Q D E D H Y V E M G IGPRM D SYA DLI M F V V YPD TG ALM R R
Ts YP_002512332.1 (51%) N E VTY R E H I RPL W E N NCA QC HG A T A -PY R G EFR E D R A R Y E R E N KGPRM D TYA DLV Y F I A WPS TG ALM R R
Lc YP_001792017.1 (51%) A D VTY R N D I RPL I K A QCD EC HG D T A -PT L A EFK L A E E R Y K K E K LGPRT D TYA DLV Q L I S WPD TG ALM R R
Rf YP_521339.1 (49%) A D VTY R A D V QPI L K A QCD DC HG A E A -PT L K EFD L A K E K Y T K E K SGPRL S TYE TLL Q L I A YPD SG AFM R R
P YP_546929.1 (47%) Q E VTY R T D I APL W K S RCV AC HG A Q S -PE R A DFL L D E K G Y A E K S QGPRM D SYE RLI A F I S WPD TG AFM R R
GsPccH L D D GK N S - K D AKPG N M YR HL GA T E E ERQ RN LA V F K AW V G- - - VWN L K K W - - - P D I TKE ELN A I T V TY
Pp YP_900515.1 L D D GR N L - K G GKAG N M YQ FL GA T E A ERQ KN LA V F K AW V G- - - TWV V K R W - - - P D V TKD ELN G I R V KY
Tn YP_007216771.1 L D D GS S H - P E GKPG N M YE HL GA D G D ERQ RN LA V F K AW V G- D D AWN L E R W - - - G D I TKQ QLD R L E L AY
Ts YP_002512332.1 L D D GG N T - A N GKPG N M YQ YL GG S E E ERQ KN LA L F R AW V GG D E AWT M K R S - - - G E I SKE ELE R F K L AY
Lc YP_001792017.1 L D D GS N T - A D KKPG N M YK HL GE T E A ERA KN LE I I K TW V GG P G AWN L N R W E K R G E V P A I TKE QLD M L K V KY
Rf YP_521339.1 L D D GS G S - A D KKPG N M YK HL GE T D G QRA AN LK V I K AW V G- E G GWN P N R W T A R G D V P A I TKE QLD K L Q L KY
P YP_546929.1 L D D GS S Q Y A G GKSG N M YQ YL GS T D A ERA AN LK L L K GW V G- D G AWN L N R W N K R G D V P M V SKE QLD K I Q L KY
1 20 40 60
80 100 120
10 30 50
70 90 110
Figure 22: Sequence alignment of the top six hits returned for the amino acid sequence of the mature PccH using the basic local alignment search tool (BLAST). Pp, P. propionicus; Tn, Thioalkalivibrio nitratireducens; Ts,
Thioalkalivibrio sulfidophilus; Lc, Leptothrix cholodnii; Rf, Rhodoferax ferrireducens; P, Polaromonas sp. The sequence
41
Figure 23: Amino acid sequence comparison of Gs PccH cytochrome c with prokaryotic c-type monoheme cytochromes (accession number in parenthesis):Agrobacterium tumefaciens (P00081);
Aphanizomenon flos-aquae (P00116); Arthrospira maxima (P00118); Azotobacter vinelandii (AAC45922);
Bordetella pertussis (Q7VVZ0); Bradyrhizobium japonicum (Q89SL2); Burkholderia dolosa (ZP_00982883); Campylobacter jejuni (NP_282300); Colwellia psychrerythraea (YP_270114);
Dechloromonas aromatica (AAZ45778); Desulfovibrio vulgaris (YP_012252); Flavobacteroides bacterium
1 (ZP_01105921); Flavobacteroides bacterium 2 (ZP_01105294); Gs PccH (GSU3274); Gs OmcF (NP_953478); Halothiobacillus neapolitanus (P25938); Helicobacter pylori (WP_000756023.1); Idiomarina
baltica (ZP_01041945); Legionella pneumophila (YP_096733); Leptolyngbya boryana (P00117); Leptothrix cholodnii (YP_001792017.1); Microcystis aeruginosa (P00112); Paracoccus denitrificans (P00096);
Pasteurella multocida (NC_002663); P. propionicus (YP_900515); Photobacterium sp. (ZP_01162384);
Polaromonas sp. (YP_546929.1); Polaromonas naphthalenivorans (ZP_01020507); Pseudomonas
fluorescens (YP_351250); Rhodothermus marinus (ACA83734.1); Rhodopseudomonas viridis (1CO6);
Robiginitalea biformata 1 (ZP_01120248); Robiginitalea biformata (ZP_01119795); Rhodoferax
ferrireducens (YP_521339.1); Rubrivivax gelatinosus (ZP_00243317); Synechococcus sp. (P00115);
Thermus thermophilus (1C52); T. nitratireducens (YP_007216771.1); T. sulfidiphilus (YP_002512332.1);
Vibrio cholerae 1 (NP_229825); Vibrio cholerae 2 (NP_231872); Wolinella succinogenes (NP_906926);
Yersinia pestis (CAC89905). The Ambler’s class I monoheme cytochromes subclasses c2, c5, c6, c551/552, c553 and c554 are labeled.The two unlabeled groups correspond to the c-type cytochromes from the
42
The proteins of the PccH family contain the largest monoheme cytochromes observed to date, with ~ 129 amino acids. For comparison, the mitochondrial cytochromes have ~ 104 amino acids, whereas the other subclasses of class I cytochromes are even smaller (~ 80 amino acids). PccH is structurally quite different from any of the other class I cytochromes.
Structural alignment with secondary structure matching 41 also did not reveal any
significant structural homologs; cytochrome c554 from Cholorobaculum tepidum (PDB code:
4J20) is the top hit in this search, with a Z-score of 2.7 (rmsd = 3.8 Â for 69 residues aligned) and 50% of sequence identity.
The structure of PccH is unique among all the monoheme cytochromes of class I known to date 18,42. For comparison, a gallery of structures of bacterial monoheme
c-type cytochrome representatives from each of the subclasses is shown in Figure 24. There are a significant
number of amino acids strictly conserved in the PccH family of cytochromes (Figure 22).
Thirty-four of 129 residues (29%), including the two cysteines and the axial ligands histidine and methionine residues, are conserved. Therefore, it is likely that the structural fold of this family of cytochromes will be conserved.
43