M
ASTER OF
S
CIENCE IN
FINANCE
M
ASTER
’
S
F
INAL
W
ORK
PROJECT
EQUITY RESEARCH
:
DEUTSCHE
LUFTHANSA
AG
LUÍS
MIGUEL
ROCHA
SANTOS
PALMA
DE
FIGUEIREDO
M
ASTER OF
S
CIENCE IN
FINANCE
M
ASTER
’
S
F
INAL
W
ORK
PROJECT
EQUITY RESEARCH
:
DEUTSCHE
LUFTHANSA
AG
LUÍS
MIGUEL
ROCHA
SANTOS
PALMA
DE
FIGUEIREDO
S
UPERVISOR
:
VICTOR
MAURÍLIO
SILVA
BARROS
i
Abstract
This project contains a detailed evaluation of Deutsche Lufthansa AG, according to
ISEG’s Master in Finance final work project. This report was written in accordance with
the recommendations of the CFA Institute. The reason for choosing the company was
the interest in the presentation of Deutsche Lufthansa on the trip to Frankfurt
conducted by ISEG master in finance, and the interest for the airline industry in general.
This report was written in accordance with the public information available on
September 23
th, 2016, any information or event subsequent to this date has not been
considered. The target price was obtained using an absolute valuation method, more
specifically the method of Discounted Cash Flow (DCF), complemented by a relative
valuation method, more specifically, the method of Comparable Multiples. With a price
target of € 14.43 at the end of 2016, representing an upside potential of 37.51% from
the current price of € 10.49, our final recommendation for Deutsche Lufthansa AG is
to Buy, despite the risks that may occur such as the increase in fuel prices or the
increase in the market risk premium that can strongly affect the price target. Our risk
assessment estimates a medium risk for the company.
JEL classification: G10; G32; G34.
Keywords: Equity Research; Valuation; Mergers & Acquisitions; Deutsche Lufthansa
AG; Airline Industry.
ii
Resumo
Este projecto contêm uma avaliação detalhada da Deutsche Lufthansa AG, de acordo
com o projecto de trabalho final do programa de Mestrado de Finanças do ISEG. Este
relatório foi elaborado de acordo com as recomendações do CFA Institute. O motivo
pela escolha da empresa deveu-se ao interesse na apresentação da Deutsche
Lufthansa na viagem a Frankfurt conduzida pelo Mestrado de Finanças do ISEG e
pelo gosto pela indústria aérea no geral. Este relatório foi elaborado de acordo com a
informação pública disponível a 23 de Setembro de 2016, qualquer informação ou
evento posterior a esta data não foi considerada. O preço-alvo foi obtido utilizando um
método de avaliação absoluto, mais especificamente o método dos Fluxos de Caixa
Descontados (DCF), complementado por um método de avaliação relativo, mais
especificamente, o método dos múltiplos comparáveis. Com um preço-alvo de € 14.43
no final de 2016, representando um potencial de valorização de 37.51% face ao preço
corrente de € 10.49, a nossa recomendação final para a Deutsche Lufthansa AG é de
Compra, apesar dos riscos que possam ocorrer como o aumento do preço dos
combustíveis ou o aumento do risco de mercado que podem afectar fortemente o
preço-alvo. A nossa avaliação de risco estima um risco médio para a empresa.
Classificação JEL: G10; G32; G34.
Palavras-Chave: Equity Research; Avaliação de Empresas; Fusões e Aquisições;
Deutsche Lufthansa AG; Indústria Aérea.
iii
Acknowledgements
This Project represents the end of an important stage of my life, filled with much effort,
dedication and hard work. However, none of this would be possible without the support of my
family, girlfriend, professors and friends.
To my dad Luís, my mom Ana, my sister Catarina and my grandmother Maria Isabel, for the
unconditional support, encouragement and valuable insights through all my life that made me
achieve all my personal and professional goals.
To my girlfriend Filipa and her family, for always believing in me.
To my colleagues and friends, for the friendship and good moments along this journey.
And last but not least, to my supervisor Victor Barros, for the guidance, patience and valuable
insights that pushed myself to always do better and for the long hours spent discussing and
improving this project.
I also want to dedicate this project to my Grandfather Luís Figueiredo for being an inspiration
in my life and to my Grandfather António Santos for making this project possible that motivated
me to do my best.
iv
Index
Abstract
i
Resumo
ii
Acknowledgements
iii
Index
iv
List of Figures
v
List of Tables
vii
1.
Research Snapshot
1
2.
Business Description
2
3.
Management and Corporate Governance
4
4.
Industry Overview and Competitive Positioning
6
5.
Investment Summary
13
6.
Valuation
14
7.
Financial Analysis
19
8.
Investment Risks
21
Appendices
24
Appendix 1: Income Statement
24
Appendix 2: Statement of Financial Position
25
Appendix 3: Income Statement per Segment
26
Appendix 4: Cash Flow Statement
28
Appendix 5: Key Financial Ratios
29
Appendix 6: Common-Size Income Statement
30
Appendix 7: Common-Size Statement of Financial Position
31
Appendix 8: Common-Size Income Statement per Segment
32
Appendix 9: Forecasting Assumptions
34
Appendix 10: Business Structure
37
Appendix 11: Valuation Methods
38
Appendix 12: Competitors Analysis
40
Appendix 13: Competitors Resume
41
Appendix 14: Forecasting Analysis
42
Appendix 15: Discounted Cash Flow
45
Appendix 16: Peer Selection
46
Appendix 17: Peers Strategies
47
Appendix 18: Return on Equity
48
Appendix 19: Risk Matrix
49
Appendix 20: Risks to Price Target
49
References
51
v
List of Figures
Figure 1: Share Price
1
Figure 2: EBIT estimations
1
Figure 3: LHA Segments
2
Figure 4: Total average number of Employees
2
Figure 5: “7to1 – Our Way Forward” Strategic Program
3
Figure 6: Types of Shareholders
5
Figure 7: Shareholders’ Nationality
5
Figure 8: World GDP Growth
6
Figure 9: German GDP Growth
6
Figure 10: German Inflation rate
6
Figure 11: Oil Prices Development ($/barrel)
6
Figure 12: Current Fuel Hedging Level
6
Figure 13: Financed Fleet
7
Figure 14: Interest Rates
7
Figure 15: Ratio of floating/fixed interest rates
7
Figure 16: Current Exchange Rate Hedging Level
8
Figure 17: Air Share
8
Figure 18: Passenger and Cargo Yields
8
Figure 19: LHA’s Main Costs (in €m)
8
Figure 20: Worldwide Passenger Departures (millions)
9
Figure 21: Worldwide Freight Tones (millions)
9
Figure 22: Change of Demand and Supply
9
Figure 23: Change of PLF
9
Figure 24: Share of Seats from Europe to all Regions
10
Figure 25: Share of Seats from Europe to Europe
10
Figure 26: Share of Seats from Europe to North America
10
Figure 27: Airline Alliances per Revenues (billions)
11
Figure 28: Porter’s 5 Forces
11
Figure 29: Passenger Transport in Europe by Car (billions)
12
Figure 30: Passenger Transport in Europe by Bus (billions)
12
vi
Figure 32: Passenger Transport in Europe by Plane (billions)
12
Figure 33: Passenger Transport in Europe by Railway (billions)
12
Figure 34: LHA’s EPS
13
Figure 35: Logistics EBIT
13
Figure 36: Monte Carlo Price distribution
13
Figure 37: Combination of Total revenue
14
Figure 38: Combination of Traffic revenue (millions)
14
Figure 39: Traffic Revenue (millions)
14
Figure 40: Other Revenue (millions)
14
Figure 41: Cost of materials and services (millions)
15
Figure 42: Staff Cost (millions)
15
Figure 43: Capex (millions)
15
Figure 44: D&A (millions)
15
Figure 45: EBIT Margin
19
Figure 46: LHA’s Structure
19
Figure 47: LHA’s Equity Ratio
19
Figure 48: LHA’s Liquidity (millions)
19
Figure 49: ROE
20
Figure 50: Projected ROE
20
Figure 51: Gross Profit Margin
20
Figure 52: Historical Share Price
20
Figure 53: Risk Matrix
21
Figure 54: Percentage of Terrorist Acts
21
Figure 55: Number of accidents per year
21
Figure 56: MC Price distribution
22
vii
List of Tables
Table 1: Analyst’s Risk Assessment
1
Table 2: Market Profile
1
Table 3: Valuation Output
1
Table 4: LHA sensitivity Analysis
1
Table 5: LHA Fleet
2
Table 6: Supervisory Board Remuneration
4
Table 7: Executive Board Remuneration
4
Table 8: LHA Major Shareholders
5
Table 9: LHA financing structure
7
Table 10: Yearly average exchange rate
7
Table 11: EUR/USD Forecast
8
Table 12: Net Profit per Region
9
Table 13: Traffic share per Region of LHA
10
Table 14: SWOT Analysis
11
Table 15: Valuation Summary
13
Table 16: Effects of change in Perpetuity WACC
13
Table 17: Net Working Capital
15
Table 18: DCF output
16
Table 19: EBIT per segment
16
Table 20: FCFF
16
Table 21: WACC
17
Table 22: EV/EBITDA Output
18
Table 23: P/E Output
18
Table 24: Multiples Output
18
Table 25: Peer selection output
18
Table 26: 2016 Peer group output
18
Table 27: Segments share of group revenue
19
Table 28: Monte Carlo statistics
23
Table 29: Effects of change in staff cost and percentage of aircraft fuel
23
Table 30: Effects of change in Country risk premium and terminal growth rate
23
1
LHA: Consistently safeguarding the future
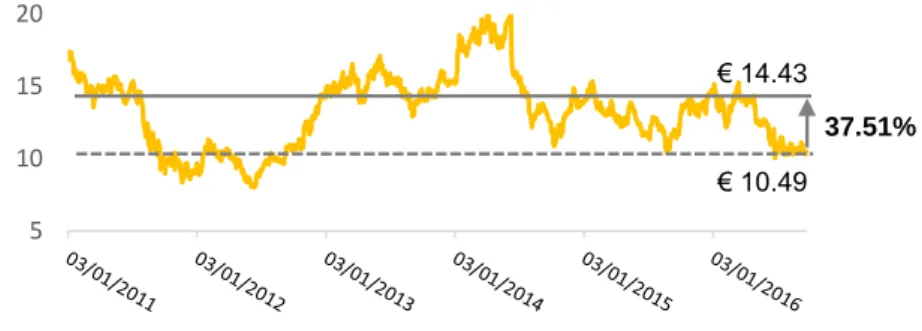
(YE2016 Price Target of € 14.43 (+37.51%); recommendation is to Buy)BUY is our recommendation for Deutsche Lufthansa AG (LHA), with a price target of
€ 14.43 at the end of 2016, using the discounted cash flow method. Relative valuation through multiples supports our view that LHA is currently undervalued. This offers a potential 37.51% upside gain from its latest closing price of € 10.49 although with medium risk.
Figure 1: Share Price Source: Reuters
Passenger Airline group segment is the main driver of the group performance with 74.30% share of group revenue. We anticipate an increase in traffic revenue in this segment due to favorable passenger yields and fuel prices, along with the good performance of the airline industry. LHA’s EBIT is expected to increase until 2017, and then to decline, due to the increase in costs in general and the deceleration of revenues driven by the slowdown in German GDP.
The airline industry is now in the stage of maturity, where the level of profit is beginning to decline and competition becomes aggressive. In order to gain more market share, LHA intends to make considerable investments.
One large investment is in the fleet, by replacing older aircrafts with new ones, increasing the seat capacity without increasing the total size of the fleet and by renewing the cabin layouts. Another is to invest in the low-cost segment, through the development of Eurowings, in order to face the fierce competition from the low-cost airline companies. With these investments we believe that LHA will outperform the industry in the medium term.
Table 4:LHA sensitivity Analysis Source: Author, Company Data
Change in percentage of aircraft fuel and lubricants
14.43 € 22.34% 22.44% 22.54% 22.64% 22.74% 22.84% 22.94% 23.04% 23.14% 23.24% 23.34% Price 18.98 € 18.08 € 17.17 € 16.26 € 15.34 € 14.43 € 13.51 € 12.58 € 11.66 € 10.73 € 9.80 € Change (%) 31.60% 25.32% 19.01% 12.69% 6.36% -6.37% -12.76% -19.17% -25.60% -32.05% 5 10 15 20
1.
Research Snapshot
Table 1: Analyst’s Risk Assessment Source: Author
Low Medium High
Table 2: Market Profile Source: Reuters
Previous close price 10.46 € Open price 10.41 € Closing price 10.49 € High 10.51 € Low 10.36 € 52-wk High 15.41 € 52-wk Low 9.90 € Volume 3,224.520 Shares outstanding (€m) 466.15
Table 3: Valuation Output Source: Author, Company Data
Valuation 2016F Target Price DCF 14.43 € Multiples (average) 16.60 € EV/EBITDA 15.80 € P/E 17.40 €
DEUTSCHE
LUFTHANSA AG
BUY
Medium risk
23 September 2016Germany
Our risk assessment estimates a medium risk for LHA
1 700 1 800 1 900 2 000 2 100 2 200
Figure 2: EBIT estimations Source: Author, Company Data € 14.43
€ 10.49
2
Deutsche Lufthansa AG (LHA), also known by Lufthansa Group, is a global aviation
group with a total of 540 subsidiaries and equity investments, organized into four main business segments: passenger airline group; logistics; maintenance, repair and overhaul services (MRO) and Catering (Figure 3). The leading position in all market segments, makes LHA the world’s leading aviation group.
The company was founded as “Luftag” on January 6th, 1953 with headquarters in Cologne. Later, in 1954 the company changed its name to “Deutsche Lufthansa AG”. LHA started its operations in 1955. During its activity, the group, formed an important commercial alliance called “Star Alliance”, and bought other important airline companies, Swiss Airlines in 2005, Brussels Airlines in 2008 and Austrian Airlines in 2009.
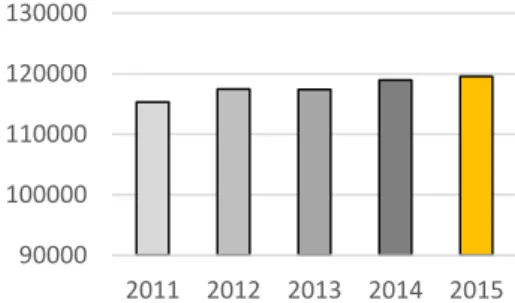
Currently, LHA has an important operations base at Frankfurt Airport, called Lufthansa Aviation Center (LAC) and basis hubs in Munich, Vienna and Zurich, with a total average of 119,559 employees (Figure 4) and a total fleet of 600 aircrafts (table 5) by the end of 2015.
The Passenger airline Group Segment is the core segment of LHA, representing 74.3% share of group revenue. The Hub airline companies: Lufthansa Passenger Airlines, Swiss Airlines and Austrian Airlines, as well as, the low-cost companies: Germanwings and Eurowings, together with investments in Brussels Airline and SunExpress, complete the airline portfolio (appendix 10). The large fleet offers a global route network of 297 destinations in 89 countries, with main routes in Germany, Austria, Belgium and Switzerland.
Lufthansa Cargo, is the responsible for the Logistics Segment, representing 7.3% share of group revenue. The focus of this business segment, is in the airport-to-airport airfreight business. The transport of animals, valuable cargo, and dangerous goods, are some examples, of the portfolio of products that Lufthansa Cargo is used to carry.
Lufthansa Technik, provides a range of services in the MRO Segment, such as; maintenance, components, aircraft systems and completion and servicing of VIP aircraft, that can be provided individually, or for the entirely fleet. This business segment represents 10.2% share of group revenue.
The Catering Segment, through LSG Sky Chefs, offers both catering products and in-flight services, such as entertainment programs, food and drinks. It represents 7.4% share of group revenue. This Business Segment, together with the MRO segment, are support segments that can be provided for LHA itself or other companies.
The remaining 0.8% share of group revenue, is due, essentially, by the successor companies of the former IT services, the Central group functions and by Airplus. All together, these companies, form the Other Segment.
LHA exhibit a vertical structure in which the passenger airline group is the core segment followed by the logistics segment with the MRO and Catering being support segments. The performance of the passenger airline group is the main driver of the group’s revenue.
2.
Business Description
Table 5: LHA Fleet
Source: LHA Annual Report 2015
Company Fleet size
LHA Passenger Airlines 414 Swiss Airlines 88 Austrian Airlines 79 Lufthansa Cargo 19 Total fleet 600 90000 100000 110000 120000 130000 2011 2012 2013 2014 2015 74.3% 10.2% 7.4% 7.3% 0.8% Passenger Airline Group MRO Catering Logistics Other
Figure 3: LHA Segments Source: LHA Annual Report 2015
Figure 4:Total average number of Employees Source: LHA Annual Report 2015
3
Company Strategies
Improving the costumer experience: the customer satisfaction is a big concern to
LHA. In order to guarantee a better experience, measures are taken as: expanding
the route network and investing in new fleet, by replacing the older aircraft by recent
ones and by renewing the cabin layouts. Offering personalized products and
services also improves the customer satisfaction.
Investment in the Cost Segment: one big strategy is the investment in the
Low-Cost Segment, by the development of Eurowings. The goal is to be the lead company in point to point transit, offering efficiency with competitive costs. It started by incorporate a large part of the Germanwings’ route network, as this brand will be integrated into Eurowings during 2016. The target are the price-sensitive customers. LHA will gain new customers with this low cost investment, by entering into a new customer segment, but this strategy will cannibalize costumers from the Hub airlines. The goal is to generate growth over the medium term and to grow faster than the average. It is expected for Eurowings, to have a slightly negative adjusted EBIT for the first year, mainly due to the costs of expanding the company.
Upgrading the Aviation Services: upgrading the business segments: MRO,
Catering, Logistics and others, focusing on the quality of services, via partnerships or acquisitions, to maintain a leading position in the market and to create a higher added value for the customer.
Financial Strategy: maintain a good credit rating; have a minimum liquidity of 2.3
billion euros at all times; achieve an equity ratio of 25% in the medium term; maintain a largely unencumbered fleet; achieve a debt repayment ratio of 45 to 35 per cent; achieve a regular dividend ratio of 10 to 25 per cent of EBIT and hedge against financial risks (in particular: Fuel, exchange rate and interest rate risk).
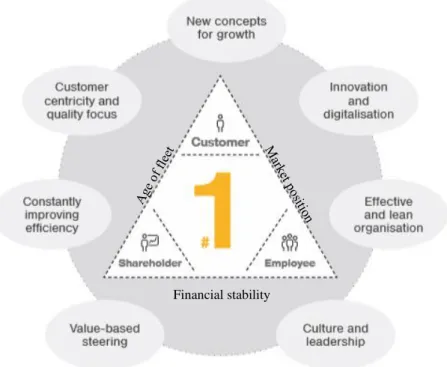
To fulfil these strategic objectives, LHA initiated a program in 2014 named “7to1 – Our Way Forward” strategic program (figure 5). This program is applied across the group, in all group segments, to ensure an optimal structure and governance for the entire group.
Figure 5: “7to1 – Our Way Forward” Strategic Program Source: LHA Annual Report 2015
4
LHA follows an Anglo-Saxon Model, which includes a Board of directors, an Audit Committee and a statutory Auditor (Pwc).
The Board of Directors is organized into two principal boards, that work closely in order to achieve a higher value to the company: the Supervisory Board (which includes a Steering Committee, a Nomination Committee and an Arbitration Committee), that is responsible for the management of the company, and the
Executive Board, that is responsible for taking decisions, which, are taken, by the
voting members. LHA, acts in compliance with the German Corporate Governance Code, with the exception that the ancillary benefits are not capped.
Board Members
The Supervisory Board is composed by the honorary chairmen, Wolfgang Röller and Jürgen Weber, together with the 23 voting members, among them, Wolfgang
Mayrhuber, serves as Chairman of the supervisory Board. He studied Mechanical
Engineering at the Technical College in Austria and at the Bloor Institute in Canada, he also has an Executive Management Training course at the Massachusetts Institute of Technology (MIT) in Boston and is a board member since 2013. Christine Behle, serves as Deputy Chairwoman and employee representative. He is graduated in business administration and is a board member since 2013.
The Executive board is composed by Carsten Spohr, serves as Chairman of the Executive Board and CEO. He is graduate in industrial engineering from Karlsruhe University and is a board member since 2011. Karl Ulrich Garnadt, serves as Chief Officer Lufthansa German Airlines (including Eurowings), is a board member since 2014. Harry Hohmeister, serves as Chief Officer Group Airlines, Logistics and IT (including Hub Management). He has a diploma in commercial air transportation and is a board member since 2013. Simone Menne, serves as Chief Officer Finances and Aviation Services. She has a degree in business administration and is a board member since 2012. Bettina Volkens, serves as Corporate Human Resources and Legal Affairs. She has a doctorate in Law and is as board member since 2013.
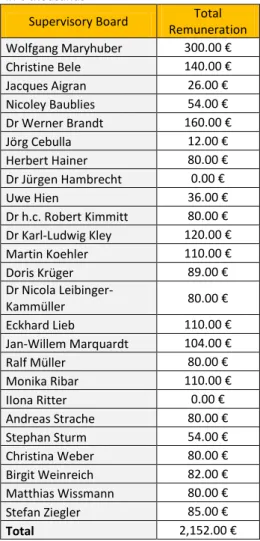
The Board members remuneration can be seen in tables 6 and 7.
This Governance structure, is suitable for this company. It prevents the situation that a member of the Board of Directors acts in their own interest, because it is always necessary to have the consent of a majority of the voting members of the executive board. This protects the shareholders for decisions that could affect the company. The specialized committees, also have an important participation as controlling the nominations, auditing and recommending the board of directors, preventing other similar cases.
3.
Management and Corporate Governance
Table 6:Supervisory Board RemunerationSource: Company Data
in € thousands
Supervisory Board Total Remuneration Wolfgang Maryhuber 300.00 € Christine Bele 140.00 € Jacques Aigran 26.00 € Nicoley Baublies 54.00 € Dr Werner Brandt 160.00 € Jörg Cebulla 12.00 € Herbert Hainer 80.00 € Dr Jürgen Hambrecht 0.00 € Uwe Hien 36.00 € Dr h.c. Robert Kimmitt 80.00 € Dr Karl-Ludwig Kley 120.00 € Martin Koehler 110.00 € Doris Krüger 89.00 € Dr Nicola Leibinger-Kammüller 80.00 € Eckhard Lieb 110.00 € Jan-Willem Marquardt 104.00 € Ralf Müller 80.00 € Monika Ribar 110.00 € IIona Ritter 0.00 € Andreas Strache 80.00 € Stephan Sturm 54.00 € Christina Weber 80.00 € Birgit Weinreich 82.00 € Matthias Wissmann 80.00 € Stefan Ziegler 85.00 € Total 2,152.00 €
Table 7:Executive Board Remuneration Source: Company Data
in € thousands
Executive Board Total remuneration Carsten Spohr 2,674.00 € Karl Ulrich Garnadt 1,783.00 € Harry Hohmeister 1,396.00 € Simone Menne 1,910.00 € Dr Bettina Volkens 1,842.00 €
5
The Shareholder Structure is divided into two main types of investors, the
institutional investors (don´t have to be necessarily from the airline industry, for
example, Investment firms and funds), with 53.9% of the shares, and the private
individuals, with 46.1% of the Shares (Figure 6). The management Team holds less
than 1% of all shares issued by the company. LHA Shares are majority held by German Investors, with a total of 74.9% of the shares (Figure 7). These shares are all registered, with transfer restrictions to ensure that, the majority of Lufthansa investors, are from Germany, as German Aviation Compliance Documentation Act (LuftNaSig) stipulates. Every share has equivalent voting rights.
This Shareholder Structure is also suitable for this company. As LuftNaSig stipulates, the company has the power to monitor the share ownership at any given time, preventing hostile takeovers. The major shareholders of the Lufthansa Group can be seen in table 8.
LHA focus on Sustainable and Responsible Business. Compliace with the world’s largest initiative for responsible company management (UN Global), and with the German Coporate Governance Code, reflects the Corporate Resonsibility of the Group. Studies, in reduction the fuel consumption, emissions and noise abatement, are some examples of the measures taken, in order to improve the environmental impact. One of the biggest measures was the huge investment in a state-of-the-art low-emissions fleet, to improve ecological sustainability.
Table 8:LHA Major Shareholders Source: Reuters
Investor
Rank Investor Name
%
Outstanding Position Country 1 Templeton Investment Counsel, L.L.C. 5.00% 23226938 United States
2 BlackRock Asset Management Deutschland AG 3.13% 14540036 Germany 3 Capital Research Global Investors 2.94% 13663966 United States
4
Norges Bank Investment Management
(NBIM) 1.63% 7563507 Norway
5 Deutsche Asset Management Investment GmbH 1.44% 6671328 Germany
6 Frankfurt-Trust Investment-Gesellschaft mbH 1.13% 5235000 Germany 7 Deka Investment GmbH 0.97% 4505621 Germany 8 The Vanguard Group, Inc. 0.96% 4479391 United States 9 Dimensional Fund Advisors, L.P. 0.83% 3835462 United States 10 BlackRock Institutional Trust Company, N.A. 0.77% 3597174 United States 11 McKinley Capital Management, LLC 0.67% 3106005 United States
12 Franklin Templeton Investment Management Ltd. 0.63% 2923141 United Kingdom 13 Templeton Global Advisors Ltd 0.57% 2646620 Bahamas 14 DB Platinum Advisors 0.54% 2521028 Luxembourg 15 Carmignac Gestion 0.51% 2372137 France 16 Goldman Sachs Asset Management (US) 0.50% 2339565 United States 17 NFJ Investment Group LLC 0.46% 2156834 United States 18 AQR Capital Management, LLC 0.38% 1751644 United States 19 Commerz Funds Solutions S.A. 0.37% 1738319 Luxembourg 20 Franklin Advisers, Inc. 0.33% 1546030 United States
74.9% 8.3%
16.8%
Germany USA Other
53.9%
46.1%
Institutional Investors Private Individuals
Figure 6: Types of Shareholders Source: LHA Annual Report 2015
Figure 7: Shareholders’ Nationality Source: LHA Annual Report 2015
6
Economic Outlook
The Global Economic outlook is favorable. Almost 1% of the World GDP is spent on air Transportation. In 2012, the World GDP dropped as a result of the global crisis. In 2015, the estimated growth of 3.09% was slightly less than in 2014 (figure 8), due to political and financial crises and to the deceleration of China’s economic activity. For the coming years, the world GDP is expected to grow steadily, between 3 and 4 per cent.
The German Economic outlook is favorable. Germany is the euro’s area biggest economy, with a stable growth over the recent years (figure 9). In 2012, the German
GDP had a huge drop, due to the Euro Zone debt crisis, loss of confidence on financial
markets and political problems. Nevertheless, recently, Germany achieved a moderate and stable growth after the recovery in 2014. This outlook is due to the positive financing and labor market conditions, high net migration, low oil prices, benefits from unprecedented stimulus by the European central bank and by the growth of domestic demand. However, Germany could be affected by the slow growth of China economy (due to the trade exposure) and by the inflow of refugees. For the coming years, the German GDP, is expected, to continue to grow in the short term and to decline slightly in the medium term. On the other hand, the German Inflation Rate has been falling since 2012 (figure 10), mainly due to the sharp drop in energy costs, however, it is expected to increase in the following years.
Market Analysis
Oil Prices have a big impact on the company accounts, being the second large
expense (17.2 % of LHA operating expenses). We can distinguish two types of oil used in the airline companies: Brent Crude, a light and sweet oil, from oil fields in North Sea, ideal for refining into gasoline and Jet Kerosene, a type of substance that comes from crude oil distillation, ideal to be used as Jet Fuel for Jet aircraft. These two types of oil are normally correlated and priced in US dollars. In 2015, the price decreased sharply (figure 11), due to the oversupply and declining demand of crude oil, mainly as a result of the growth of EUA and Iraq as a producer, the return of Iran to the oil market, the overproduction of the OPEC oil cartel, the appreciation of the U.S. Dollar and the deceleration of China’s economy. This fall on oil prices contributed significantly to LHA’s better results. In order to reduce exposure to fluctuations in fuel prices, airline companies usually practice Fuel Hedging by buying or selling expected future oil prices through investment tools such as swaps contracts, call options, among others. These hedges are mainly in crude oil.
LHA performs in a time horizon of up to 24 months (by definition, 5% of exposure is hedged monthly) with a maximum hedging level of 85% in each month, depending on the company in the Group. For 2016 the current fuel hedging level is about 76% (figure 12). It is expected that oil prices remain low in the short term and to go up slightly in the medium term.
4.
Industry Overview and Competitive Positioning
50 70 90 110 130 150 2011 2012 2013 20142015F2016F Crude oil Price, Brent Jet kerosene Price 0% 20% 40% 60% 80% 2016 2017 2018 2,50% 3,00% 3,50% 4,00% 4,50% 2011 2012 2013 2014 2015 2016F 2017F 2018F 2019F 2020F 2021F 0,00% 0,50% 1,00% 1,50% 2,00% 2,50% 3,00% 2010 2011 2012 2013 2014 2015 2016F 2017F 2018F 0,00% 0,50% 1,00% 1,50% 2,00% 2,50% 3,00% 3,50% 4,00% 2011 2012 2013 2014 2015 2016F 2017F 2018F 2019F 2020F 2021F Figure 8: World GDP Growth
Source: IMF
Figure 9: German GDP Growth Source: IMF
Figure 10: German Inflation rate
Source: OECD Data and PWC projections
Figure 11: Oil Prices Development ($/barrel) Source: IATA
Figure 12: Current Fuel Hedging Level Source: LHA Annual Report 2015
7
Airline companies are very dependent on Interest Rates, due to the fact that part of the fleet is financed by bank loans and credit. In the case of LHA, a vast majority of the aircraft fleet is unencumbered and wholly owned by the group, only 9.33% of the fleet is financed by operating and finance lease (figure 13).
In Euro-Area, short term interest rates (3 Months Euribor) and long term interest
rates (10 Years Bunds) have been declining (figure 14) as a result of the rate cuts by
the European Central Bank (ECB), in order to increase private spending, economic growth, investment and inflation. This drop means better results for the airline companies. It is expected that interest rates remain low for the coming years.
LHA uses Interest rate swaps and interest rate currency swaps to manage interest rate risks. The group aims to finance 85% of its financial liabilities at floating rates of interest. It is required, for the company, to reduce both long term interest expenses and earnings volatility. The Ratio of floating to fixed interest rates for long term borrowing can be seen in figure 15.
The main financing instruments used by LHA are Bonds, Liabilities to banks and Leasing liabilities (table 9).
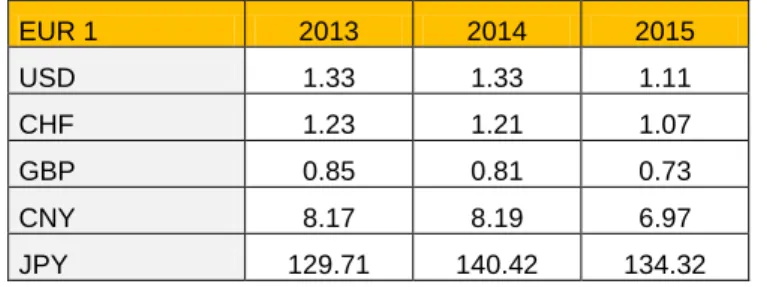
Since LHA has international operations through a global route network, it means that the company is exposed to exchange rate fluctuations. The Exchange Rates have a considerable impact on revenues. In 2015, the Euro depreciated against all the main currencies (table 10) as a result of the ECB’s quantitative easing program to purchase government bonds in order to reduce their yields, resulting in an increase in the money supply, and due to the cut rates, that pushed the interest rates to a record-low in order to fight the Eurozone’s deflation. For an airline company, favorable exchange rates means better results due to the great impact they have on the company’s accounts. In this case, a strong currency is preferred.
It is important to consider two situation: (i) LHA could be affected by the pound sterling devaluation due to the Britain’s exit from European Union (Brexit); (ii) Since the fuel is priced in US dollars, it may represent a large cost associated with the purchase of fuel depending on the US dollar appreciation against the euro.
Table 9: LHA financing structure Source: LHA Annual report 2015
in €m
Borrowings Non-Current Current Total
Bonds 998 € 751 € 1,749 €
Liabilities to banks 949 € 130 € 1,079 € Leasing Liabilities and other loans 3,084 € 458 € 3,542 €
Total 5,031 € 1,339 € 6,370 €
% of Total 78.98% 21.02% 100.00%
Table 10: Yearly average exchange rate Source: USForex EUR 1 2013 2014 2015 USD 1.33 1.33 1.11 CHF 1.23 1.21 1.07 GBP 0.85 0.81 0.73 CNY 8.17 8.19 6.97 JPY 129.71 140.42 134.32 -1,00% 0,00% 1,00% 2,00% 3,00%
Short Term Interest Rate Long Term Interest Rate
0% 20% 40% 60% 80% 100% 2016 2017 2018 2019 2020 9.33% Financed Fleet
Figure 13: Financed Fleet Source: LHA Annual report 2015
Figure 14: Interest Rates Source: Eurostat, OECD Data
Figure 15: Ratio of floating/fixed interest rates Source: LHA Annual report 2015
8
LHA is exposed to about 66 foreign currencies. The Group uses currency futures and currency options to hedge exchange rates exposure for 20 of the currencies, over a period of 24 months with a hedging level depending on the currency. Spread options and futures can also be used as hedging instruments. For 2016 the current hedging level is 87% (figure 16). In table 11 we can see the forecast of EUR/USD for the coming years.
Table 11: EUR/USD Forecast Source: Deutsche Bank
Year 2016F 2017F 2018F 2019F
EUR/USD 0.90 0.85 1.00 1.10
Airline Industry
The Airline Industry is a significant driver for the Worldwide Economy, either by creating jobs, providing capital or increasing connections that enables the flow of goods, people and technology. This industry is characterized by intense competition, large costs and reduced profit margins.
The bet on Low-Cost Carriers (LCC’s) proved to have a big impact on the Airline
Industry, with an actual worldwide Air Share of 25% (figure 17). The rise of the LCC’s is justified by the preference of a large part of consumers for competitive prices over some comfort, especially in emerging economies. These type of companies, usually do not provide some services such as inflight meals and drinks, generally own relatively newer aircraft of a single type and operate at smaller airports. Airline Companies like Easyjet and Ryanair, are some examples of LCC’s that had a considerable growth in recent years. These LCC’s focus on cost reductions and control, in order to offer competitive prices and low fares to costumers.
In contrast, Luxury Airline Companies like Emirates or Qatar Airways are also growing but with a lower impact than the LCC’s thanks to the niche of consumers who prefer to spend money in comfort and luxury. These companies must maintain a high service standard in order to add more value to the customer experience by having the best technology, authentic quality and excellence.
Between these two categories, we can highlight the Hub Airline Companies like Deutsche Lufthansa AG, Turkish Airlines and Air France-KLM, among others. These airline companies focus on the equilibrium price-quality. Due to the intense competition these companies face, it is necessary to reduce costs in order to have competitive prices without compromising quality of service.
In this Industry it is important to pay attention to yields, more precisely to Passenger and Cargo Yields. Passenger Yield is the average fare paid by customers to fly one mile. Cargo Yield is the average price paid by customers to transport one ton of freight and mail one mile. Both Yields dropped in 2015 (figure 18) due to the declining of prices and surcharges. The goal of airline companies is to stabilize these yields, preventing its descent.
Drivers of costs
Staff Cost is the biggest cost of an Airline Company. The staff cost is directly related
to the number of employees. Since the average number of employees in LHA has been growing in the last recent years, consequently, staff costs are rising too. Another huge cost are the Fees and Charges that Airline Companies must support such as Air Traffic Control Charges, Landing Fees, Handling Charges, Security Fees, Passenger Fees and Fees for Airport Infrastructure. In 2015, Fees and Charges went up by 7.3% due to volumes, prices and exchange rate movements. These two costs together with the cost of Fuel, are the main costs of an airline company (figure 19).
-60,00% -40,00% -20,00% 0,00% 20,00%
Passenger Yield Cargo Yield 0% 20% 40% 60% 80% 100% 2016 2017 2018 2019 2020 25% 75%
Low Cost Carriers (LCC's) Full Service Carriers (FSC's)
Figure 16: Current Exchange Rate Hedging Level
Source: LHA Annual report 2015
Figure 17: Air Share Source: Strategy&
Figure 18: Passenger and Cargo Yields Source: IATA 0 2000 4000 6000 8000 10000
Staff Cost Fuel Cost Fees and charges
Figure 19:LHA’s Main Costs (in €m) Source: LHA Annual report 2015
9
Demand and Supply
The passenger traffic has been growing for the past recent years, reaching a total of 3545 million Passenger Departures in 2015 (figure 20). Cargo business is also growing, but with a lower impact than the passenger traffic, reaching a total of 51.3 million of Freight Tones in 2015 (figure 21). The growth of the airline industry also increases indirectly the airline services MRO and Catering that are correlated with the Passenger Airlines and Cargo Segments growth.
One important feature of this sector is the Geographic Position. Some regions are more propitious than others due to economic context and local demand. North America Region performs the best followed by Europe Region (table 12).The weakest Region is Africa thanks to political and regional conflicts.
One way to analyze the Demand and supply is to looking at the variables: Revenue
Passenger Kilometers (RPK), measures the actual passenger traffic; Available Seat Kilometers (ASK), measures the available passenger capacity; and Passenger Load factor (PLF), measures the percentage of ASK used.
It is expected that passenger traffic (demand) will continue to grow steadily and passenger capacity (supply) to grow significantly (figure 22), which can mean more airplanes in the air or a better efficiency by upgrading airplane cabin layouts. The Percentage of ASK used has improved in recent years (figure 23) which means a better allocation of available seats for passenger. In the summer, demand usually increases due to leisure travelers.
LHA expects an increase in ASK of 6.6% and consequently in RPK, along with an increase in the number of flights by 2.3%, as a result of the planned capacity expansion of Swiss and Austrian Airlines by increasing the number of flights and operating larger aircrafts, as well as the growth of Eurowings, through the expansion and replacement of short and long-haul fleet.
Although the expected increase in the worldwide freight tones, we expect the Logistics Segment to decrease in the medium term mainly due to the challenging market and the large drop in cargo yields for 2016.
Table 12: Net Profit per Region Source: IATA
in $ billion
Region Net profit
North America 19.4 Europe 6.9 Asia-Pacific 5.8 Middle East 1.4 Latin America -0.3 Africa -0.3 46 48 50 52 54 2500 3000 3500 4000 0% 2% 4% 6% 8% 10% 2010 2011 2012 2013 2014 2015F 2016F RPK ASK 76,00% 77,00% 78,00% 79,00% 80,00% 81,00% Industry LHA
Figure 20: Worldwide Passenger Departures (millions)
Source: IATA
Figure 21: Worldwide Freight Tones (millions)
Source: IATA
Figure 22: Change of Demand and Supply Source: IATA
Figure 23: Change of PLF Source: IATA and Company data
10
Competitors Analysis
We can distinguish two types of competitors, the Direct Competitors like Hub Airline Companies and LCC’s and the Indirect Competitors like the Luxury Airline Companies. In figure 24 we can see the main competitors of LHA, by looking at the share of seats from Europe to all regions. We can see that LHA ranks first with 11% of seats share. Due to their dimension, Easyjet, Air France-KLM, IAG, Ryanair and LHA form the so-called Europe’s Big Five. In order to study in more detail the competition
of LHA, it is essential to look in detail the competition in each region.
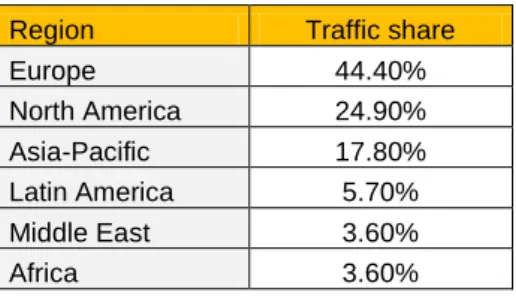
Europe is where LHA has the highest traffic share per region (table 13). In this region
the airline industry is highly fragmented, the five largest European Airline Groups accounts for less than 50% of total market capacity in terms of domestic European traffic. Hub Airline Companies like Air France-KLM, International Airline Group (IAG) (London) and Turkish Airlines, represent the main competitors together with the LCC’s Ryanair and Easyjet that compete directly with Eurowings (figure 25).
North America is the second region with highest Traffic share. Unlike Europe, in this
region, the airline industry is consolidated, the five largest North American Airline Groups accounts for 90% of total market capacity. Commercial joint ventures and alliances with United Airlines and Air Canada are vital to ensure a strong presence of LHA in this region. The main competitors to the flow of traffic between Europe and this region are IAG, Delta Air Lines, American Airlines and Air France-KLM (figure 26).
Asia-Pacific, with 17.8% of traffic share, represents an important region to LHA.
Commercial joint ventures and alliances with Air China, ANA Group (Japan) and Singapore Airlines, are crucial to maintain the traffic share in this region. The main competitors to the flow of traffic between Europe and this region are Aeroflot (Russia), Air France-KLM and Turkish Airlines (appendix 12).
Latin America accounts for only 5.7% of traffic share. The main competitors to the
flow of traffic between Europe and this region are Air France-KLM, IAG, TUI Group and TAP Portugal (appendix 12).
In the Middle East, LHA faces great competition from the Gulf Three (Emirates, Qatar Airways and Etihad) that focus on traffic between Middle East and Europe, together with the Hub Airline Company Turkish Airlines (appendix 12). Recently, Qatar Airways, bought 20% of IAG shares, taking advantage of the pound sterling devaluation after Britain’s exit from European Union (Brexit), in order to expand its presence in Europe. In the long run, Qatar Airways may act as a direct competitor to LHA in Europe.
Africa, due to the economic situation and political conflicts only represents 3.6% of
traffic revenue. The main competitors to the flow of traffic between Europe and this region are Air France-KLM, Royal Air Maroc, Air Algerie and Turkish Airlines (appendix 12).
A short resume of LHA competitors can be seen in appendix 13.
Table 13: Traffic share per Region of LHA Source: LHA Annual report 2015
Region Traffic share
Europe 44.40% North America 24.90% Asia-Pacific 17.80% Latin America 5.70% Middle East 3.60% Africa 3.60% 0% 5% 10% LHA Ryanair IAG Air France-KLM Easyjet Turkish Airlines 0% 5% 10% LHA Ryanair IAG Easyjet Air France-KLM Turkish Airlines 0% 5% 10% IAG
Delta Air Lines LHA American Airlines Air France-KLM
Figure 24:Share of Seats from Europe to all Regions
Source: CAPA, OAG
Figure 25: Share of Seats from Europe to Europe
Source: CAPA, OAG
Figure 26: Share of Seats from Europe to North America
11
Airline Alliances have an important role in the analysis of the competitive market.
These alliances bring many benefits to Airline Companies and customers. Airline
Companies, benefit from an extended route network, share of airport lounges, cost
savings, brand recognition and economies of scale, scope and traffic density.
Customers, benefit from frequent flyer programs, coordinated schedules, seamless
travels and lower ticket prices. These benefits can result in an increased market share and a stronger market position that lead to competitive advantages. The three major airline alliances are Oneworld Alliance, Star Alliance and SkyTeam Alliance (figure 27).
Competitive Position
Porter’s 5 Forces
Threat of New Entrants (Low)
The airline companies are largely dependent on bank loans and credit in order to invest in the fleet, the more accessible these loans and credits are for the companies, more easily they enter the market. For example, an Airbus A320 (medium-haul aircraft) costs 97 million dollars and a Boeing 747 (long-haul aircraft) costs 240 million dollars. However, customers tend to choose only companies with a known and reliable brands, making this a lower threat.
Bargaining Power of Suppliers (Low)
The airline industry is mainly dominated by two big airplane manufacturers, Boeing and Airbus. It is unlikely that new manufacturers enter the market due to the high costs. In LHA, Boeing and Airbus makes 80% of the fleet, with the remaining 20% consisted of smaller manufacturers such as Bombardier, Avro, Embraer and Fokker. Because the airline companies are the only income for this manufacturers, makes these companies have a low bargaining power.
Table 14: SWOT Analysis Source: Author
- Globally recognized and reliable brand; - One of the largest route network; - Multiple Hubs in Europe;
- Strong commercial joint Ventures, Partnerships and alliances;
- Well diversified business profile within the industry.
- One of the highest Cost per available seat kilometer between European Airlines;
- Germanwings has a cost base too high for a LCC.
- Investment on LCC’s (Eurowings); - Increasing demand for airline industry; - New aircraft technology to reduce costs; - Expansion of oil Production in North America.
- Strikes;
- Increase of Fuel Prices; - Exchange rates movements; - Increase of Interest rates; - terrorism; - Competition from LCC’s. 0 1 2 3 4 5 Competitiv e Rivalry Bargaining Power of Suppliers Bargaining Power of Buyers Threat of Substitute Products Threat of New Entrants 100 120 140 160 180 SkyTeam Alliance
Star Alliance Oneworld Alliance
Strengths Weaknesses
Opportunities Threats
Figure 27: Airline Alliances per Revenues (billions)
Source: Oneworld Alliance, Star Alliance and SkyTeam Alliance official page
Figure 28: Porter’s 5 Forces Source: Author, Company Data
12
Bargaining Power of Buyers (Medium-Low)
Buyers have a medium-low bargaining power due to the fact that they choose the flight according to their needs and there is no big difference between airplanes in the same segment. Switching cost aren’t very high in the same segment, however, when compared in different segments, for example, a luxury airline company with an LCC, switching costs become significant.
Threat of Substitute Products (Moderate)
The threat of substitutes vary according to preference and travel distance. Examples such as car, bus, train or boat, can be another way to travel if the distance, price or time is the most appropriate for the situation. Switching costs are significant when comparing different ways to travel.
Within Europe, Air Transport is the way that had the largest increase followed by the use of rail transport. In the opposite direction, the use of Passenger Cars and Buses decreased. Maritime Transport remained at a constant level over the years.
The evolution of the main means of transport within Europe can be seen in figures 29 to 33.
Competitive Rivalry (High)
This industry has an intense competition in all segments and between segments, there is always a great number of choices when deciding where to travel, which leads to high costs of competition. This intense competition affects both Hub and low cost airline companies in LHA.
Like any other player in the market, LHA has its Strengths, weaknesses, Opportunities and threats. In such a competitive industry as the airline industry, airline companies have to explore their strategies in order to be successful. The LHA management team is focused on continuing to reinforce its strengths by expanding the route network and upgrading the costumer experience by renewing the fleet and the cabin layouts; taking advantage of market opportunities by investing in the low cost segment by developing Eurowings; reducing their threats by implementing strong hedging strategies; and to overcoming their weaknesses by trying to increase their margins by implementing a solid financial strategy.
4200 4300 4400 4500 4600 4700 4800 2000 2004 2008 2012 500 510 520 530 540 550 560 2000 2004 2008 2012 340 360 380 400 420 440 2000 2004 2008 2012 35 37 39 41 43 45 2000 2004 2008 2012 400 450 500 550 600 2000 2004 2008 2012
Figure 29: Passenger Transport in Europe by Car (billions)
Source: Eurostat
Figure 30: Passenger Transport in Europe by Bus (billions)
Source: Eurostat
Figure 33: Passenger Transport in Europe by Railway (billions)
Source: Eurostat Figure 31: Passenger Transport in Europe by
Boat (billions) Source: Eurostat
Figure 32: Passenger Transport in Europe by Plane (billions)
13
With a price target of € 14.43 and an upside level of 37.51% at the end of 2016, using the Discounted Cash Flow Method, our recommendation stands for BUY. Relative valuation through Multiples supports our view with an average price target of € 16.60 and an upside potential of 58.26%. Both methods indicates that LHA is currently undervalued (table 15).
Company Valuation
In order to evaluate LHA, we used two different valuation methods, an absolute and a relative valuation model.For the absolute valuation model, we used the Discounted
Cash Flow (DCF) approach and for the relative valuation model, we used the Market Multiples approach.
In both methods, we evaluated LHA as a Group, mainly for three reasons: (i) LHA has a vertical structure in which the segments are very dependent and connected on the performance of the passenger airline group; (ii) we predict that the Logistics segment will have negative free cash flows until the end of the valuation period, which makes the valuation model more complex to implement; (iii) although the “Other Segment” represents 0.8% of group revenue, it accounts for almost 20% of EBIT due to the high costs that are supported by other segments, but because of lack of information, we were unable to evaluate at a segment level.
For the forecast period, we predict that Earnings per Share (EPS) will increase until the end of 2018, due to higher demand, favorable fuel prices and passenger yields. Later, in 2019, EPS will start to decrease until the end of the valuation period mainly due to the deceleration in revenues driven by the deceleration of German GDP and the rise of costs in general driven by the German inflation rate (figure 34).
Despite the Logistics segment is giving negative EBIT until the end of the valuation period (figure 35), we think that LHA must preserve it due to the competitive advantage that this service brings to the company by increasing the range of services available (creating synergies) and to the positive previsions in the long term for this segment.
Company Risks
In this industry, in particular, we have to pay close attention to some Investment Risks such as terrorism and accidents that although being impossible to predict, can strongly affect the company due to the possible damage to property and people together with the potential loss of costumers as a result of fear of traveling.
In order to compute the impact of the main investment Risks to the Price Target, we computed a sensitivity analysis and a Monte Carlo Simulation (figure 36). According to Monte Carlo simulation, Aircraft fuel and lubricants (81.93%) and Fees and charges
(48.40%) are the main risks to price target. The mean of the price target by this
simulation is € 14.37, representing an Upside Potential of 36.99%. Which is near the price target computed by the DCF valuation of € 14.43. There is a 54% probability of our BUY recommendation being accurate.
Table 16: Effects of change in Perpetuity WACC Source: Author, Company Data
5.
Investment Summary
Table 15: Valuation Summary Source: Author, Company DataDCF valuation
Enterprise Value 11,142.20 €
Target Price 14.43 €
Multiples valuation
EV/EBITDA Target Price 15.80 € P/E Target Price 17.40 €
Multiples Average 16.60 €
Difference
2.18 € 15.09%
Change in perpetuity WACC
14.43 € 5.40% 5.50% 5.60% 5.69% 5.80% 5.90% 6.00% Price 15.91 € 15.37 € 14.85 € 14.43 € 13.89 € 13.44 € 13.02 € Change (%) 10.31% 6.53% 2.93% -3.73% -6.82% -9.77% 3,30 3,40 3,50 3,60 3,70 3,80 2016F 2017F 2018F 2019F 2020F 2021F
Figure 34: LHA’s EPS Source: Author, Company Data
-500 -400 -300 -200 -100 0 100 200 300 2011 2012 2013 2014 2015 2016F 2017F 2018F 2019F 2020F 2021F Figure 35: Logistics EBIT
Source: Author, Company Data
0 2000 4000 6000 8000 € (2,65) €0,98 €4,61 €8,24 €11,87 €14,60 €18,23 €21,86 €25,49 €29,12 FCFF
Figure 36: Monte Carlo Price distribution Source: Author, Oracle crystal ball
14
As mentioned before, we used two different valuation methods to evaluate LHA, an absolute and a relative valuation model.
For the absolute valuation model, we used the Discounted Cash Flow (DCF) approach. This method is the most appropriate for this company due to the amount of information that we were able to get, which made it possible to reach the enterprise value of the group. The Dividend Discount Model is not suitable since LHA’s dividends distribution is uncertain. In order to reach the enterprise value of the company, it was computed the Free Cash Flow to the Firm (FCFF) of the group. The Free cash flow to Equity (FCFE) is not suitable since the company is changing its capital structure.
For the relative valuation model, we used the Market Multiples approach. In order to achieve the target price, a Peer group was selected from a large sample of airline groups that had to meet a number of criteria that were selected in order to create a group of comparable companies in terms of structure, dimension and risk. For this valuation we used the multiples Enterprise Value to EBITDA (EV/EBITDA) and Price to Earnings (P/E). More details about valuation methods can be seen in appendix 11.
Forecast Analysis
Total Revenue is the sum between Traffic Revenue and Other Revenue (figure 37).
We can see that Traffic revenue is the main driver of total revenue due to the great contribution that this type of revenue have in total.
Traffic Revenue is the sum between the passenger airline group and logistics traffic
revenue (figure 38).
In the case of passenger airline group, we expect an increase until the end of 2017, due to expected favorable passenger yields and fuel prices along with the investment in Eurowings. However, this increase will be slightly lower than the increase in 2015 due to the increased pricing pressure in 2016 caused by greater capacities on the market and intense competition due to lower overall costs for the industry. Afterwards, due to the deceleration of German GDP and the expected increase in fuel prices, we predict a deceleration in growth until the end of 2021.
For the Logistics segment, we expect a decrease in growth due to the sharp decrease in the yields, intense competition and weak market and demand. In the long run is expected to stabilize. The result of this combination is an overall increase in traffic revenue (figure 39).
Other Revenue is essentially the sum of MRO, Catering and Other segment external
revenue together with the PAG and logistics external revenue excluding traffic revenue. In the case of MRO, we predict a growth in revenues identical to the expected inflation rate. For the Catering segment, we assume a percentage of 8.68% of the passenger airline group revenues, due to the fact that there is a very strong correlation between catering revenues and PAG revenues. For the other segment, we assume a constant value equal to 2015 nominal value until the end of 2021. For the other external revenues excluding traffic revenue of PAG and logistics segment, we assume a growth identical to the expected inflation rate. The result of this combination is an overall
increase in other revenue (figure 40).
6.
Valuation
Figure 40: Other Revenue (millions) Source: Author, Company Data
0 10 000 20 000 30 000 40 000 2011 2012 2013 2014 2015 2016F 2017F 2018F 2019F 2020F 2021F
Traffic Revenue Other Revenue
Figure 37: Combination of Total revenue (millions)
Source: Author, Company Data
0 10000 20000 30000 40000 2016F 2017F 2018F 2019F 2020F 2021F Logistics Traffic Revenue
PAG Traffic Revenue
Figure 38: Combination of Traffic revenue (millions)
Source: Author, Company Data
15000 20000 25000 30000
2011 2012 2013 2014 2015 2016F 2017F 2018F 2019F 2020F 2021F Figure 39: Traffic Revenue (millions) Source: Author, Company Data
0 2 000 4 000 6 000 8 000 10 000 2011 2012 2013 2014 2015 2016F 2017F 2018F 2019F 2020F 2021F
15
Cost of materials and services (CMS)
In the last 5 years, CMS accounted for an average of 57.73% of Revenues. This cost is very important because it contains the costs with Aircraft Fuel and Fees and
charges. We predict that CMS will increase (figure 41) mainly due to inflation and
increased demand in the medium term. More details about the CMS can be seen in appendix 14.
Staff Cost
Staff is the largest cost in LHA, in the last 5 years accounted for an average of 23.95% of Revenues. We predict that Staff cost will increase (figure 42) mainly due to inflation and to the capacity that unions in Germany have in influencing the government. In recent years, total average wages have been increasing as a consequence of this influence and are expected to continue for the coming years. More details about the Staff cost can be seen in appendix 14.
Debt
We predict the issuance and retirement of debt in function of the Net Cash final balance. For this, we saw the amount of cash from operating and investing activities, along with the interest and dividend paid and the change in net cash in order to compute the amount of debt that LHA needs to issue/retire. With this strategy we are able to reach the target D/E ratio of 1.
Capital Expenditure (Capex)
The fleet strategy aims to continuously reduce the number of aircraft types in operation and to maintain a large unencumbered fleet. LHA expects to invest in the fleet, by replacing older aircraft with new ones in order to increase the seat capacity without increasing the total size of the fleet. Thanks to this investment together with the costs from the renewal program of cabin layouts and Eurowings expansion, we expect a large increase in the Capital expenditures in the short run, and then, in the medium term, to stabilize to values around 3000 million (figure 43). More details about Capex can be seen in appendix 14.
Depreciation and amortization (D&A)
Due to the fleet strategy and the renewal program of the cabin layouts, the Aircraft and reserve engines will increase in value due to the new models that are expensive because of the new layout and technology, so it is logical that the D&A will also increase (figure 44). More details about D&A can be seen in appendix 14.
Net Working Capital (NWC)
Since we predict that current liabilities will be higher than current assets, we predict a negative variation of NWC (table 17). This could be explain by the increase in Payables due to the investment in the new fleet and Eurowings, which requires more payment to suppliers. For each segment, we assume the percentage of the business share in group revenue.
Table 17
:
Net Working Capital Source: Author, Company Datain €m
Years 2015 2016F 2017F 2018F 2019F 2020F 2021F
Total ∆current assets -413.0 -14.9 -167.9 -139.8 -126.5 -114.8 -102.2 Total ∆current liabilities 537.0 102.1 128.0 106.6 96.5 87.6 78.0 Total ∆NWC 124.0 87.2 -39.8 -33.2 -30.0 -27.2 -24.2 10000 12000 14000 16000 18000 20000 22000 2011 2012 2013 2014 2015 2016F 2017F 2018F 2019F 2020F 2021F Figure 41
:
Cost of materials and services (millions)Source: Author, Company Data
3500 4500 5500 6500 7500 8500 9500 2011 2012 2013 2014 2015 2016F 2017F 2018F 2019F 2020F 2021F Figure 42: Staff Cost (millions)
Source: Author, Company Data
500 1 000 1 500 2 000 2 500 3 000 3 500 4 000 2011 2012 2013 2014 2015 2016F 2017F 2018F 2019F 2020F 2021F Figure 43: Capex (millions)
Source: Author, Company Data
0 500 1 000 1 500 2 000 2 500 3 000 2011 2012 2013 2014 2015 2016F 2017F 2018F 2019F 2020F 2021F Figure 44: D&A (millions)
16
DCF Valuation
The result of the DCF valuation was a target price of € 14.43 for the end of 2016 (table 18), representing an upside potential of 37.51%. In our perspective, LHA is currently
undervalued, so, our recommendation, based on the DCF valuation, is to BUY. More
details about the DCF Valuation can be seen in appendix 15.
As mentioned before, the DCF valuation was computed as a group. In order to acquire the consolidated EBIT, we estimated the income statement per segment to reach the consolidated income statement after the appropriate adjustments (table 19). More details about the income statement per segment can be seen in appendix 3.
Table 19:EBIT per segment Source: Author, Company Data
in €m Year 2015 2016F 2017F 2018F 2019F 2020F 2021F PAG 1,465 1,526 1,747 1,779 1,788 1,669 1,513 Logistics 3 -135 -280 -379 -438 -448 -395 MRO 448 893 834 782 743 702 673 Catering 85 151 168 167 162 146 125 Other -383 -18 -31 -44 -57 -70 -82
Although the logistics segment is giving negative EBIT by the end of the valuation period, we think that LHA must preserve it, due to the recognition that Lufthansa Cargo brings to the group for being the Europe’s leading freight airlines; for the significant competitive advantage that this service brings to the company by providing this service (creating synergies), and to the positive previsions in the long term for this segment.
We predict the Future Cash Flows to be positive by the end of the forecast period. From 2016 until 2019, we can see an increase in the future cash flows, then, in 2020, they start to decrease until the end of the valuation period (table 20).
Table 20:FCFF
Source: Author, Company Data
in €m
Years 2016F 2017F 2018F 2019F 2020F 2021F
EBIT (1- Corporate tax rate) 1,527.2 1,623.0 1,598.6 1,582.5 1,499.3 1,429.9 D&A 1,764.9 1,900.3 2,034.9 2,167.7 2,297.8 2,424.1 Net increase in NWC 87,2 -39,8 -33,2 -30,0 -27,2 -24,2 Capex 3,009.2 3,115.4 3,211.5 3,295.6 3,366.1 3,421.6
FCFF 195.7 447.7 455.1 484.6 458.3 456.7
The formula used to compute FCFF is the following:
Table 18: DCF output
Source: Author, Company Data
in €m DCF Output Enterprise Value 11,142.20 Net debt 4,417.90 Value of equity 6,724.29 # shares outstanding 466.15 Price at the end of 2016 14.43 €
Current price 10.49 €