M
ASTERS IN
F
INANCE
M
ASTERS
F
INAL
W
ORK
PROJECT
EQUITY RESEARCH: ELECTRONIC ARTS, INC.
J
OÃO
F
ILIPE
B
EJA
O
RRICO
H
ORTA
M
ASTERS IN
F
INANCE
M
ASTERS
F
INAL
W
ORK
PROJECT
EQUITY RESEARCH: ELECTRONIC ARTS, INC
J
OÃO
F
ILIPE
B
EJA
O
RRICO
H
ORTA
SUPERVISOR:
P
ROFESSORA
D
OUTORA
A
NA
I
SABEL
O
RTEGA
V
ENÂNCIO
iii ABSTRACT
This project aims to analyze and evaluate the company Electronic Arts, Inc. (EA). This work is part of the Final Work of the Master’s in Finance Program of the Instituto Superior de Economia e Gestão (ISEG), Universidade de Lisboa, prepared according to the format recommended by the Chartered Financial Analyst Institute.
In this context, this academic work aims, in a first phase, to present an overview of the company, including key aspects of the structure of EA and its main members and its corporate governance logic, followed by a sectoral appreciation. Subsequently, we proceeded to a macroeconomic analysis of the company in the context of the industry in which it operates, focusing on analytical dimensions that we consider of special relevance for the evaluation of the study presented here.
In terms of valuation, we have reviewed the company's finances and management over the past seven years and forecast its financial performance over the next five years. The research conducted is based on the bibliographic and documentary research available up to March 31, 2018, considered of major relevance to this study. No information, event or circumstance after this date has been considered. The valuation to determine the target price was achieved by averaging two valuation methods, using the discounted cash flow method, applying the perpetuity growth model and the multiple method over the terminal value. The assumptions considered to make the financial forecast were the result of the available data publicly disclosed by the company.
Given the study developed, we consider a buy recommendation over EA stocks, with a target price of USD $107.89 for 2019, representing an appreciation potential of 34% compared to the last closing price US $80.37 release on January 2, 2019.
Keywords: Equity Research, Video Game Industry, Electronic Arts, Inc., Business Valuation, Discounted Cash Flow Method.
RESUMO
Este projeto visa a analisar e avaliar a empresa Electronic Arts, Inc. (EA). Este trabalho enquadra-se no âmbito do Trabalho Final do Programa de Mestrado em Finanças, do Instituto Superior de Economia e Gestão (ISEG), Universidade de Lisboa, elaborado de acordo com o formato recomendado pelo Chartered Financial Analyst Institute.
Neste âmbito, este trabalho acadêmico pretende, numa primeira fase, apresentar uma visão geral da empresa, incluindo vertentes chave da estrutura da EA e dos seus principais membros e da sua lógica de governança corporativa, seguido de uma apreciação sectorial. Posteriormente, procedemos a uma análise macroeconômica da empresa no contexto da indústria em que se insere, focalizando-nos em dimensões analíticas que consideramos de especial pertinência para a avaliação do estudo aqui apresentado.
Em termos de avaliação, passamos a analisar as finanças e a administração da empresa, nos últimos sete anos, e prevemos o seu desempenho financeiro para os próximos cinco anos. A pesquisa realizada tem por base a investigação bibliográfica e documental disponíveis a 31 de março de 2018, consideradas da maior relevância para este estudo. Nenhuma informação, evento ou circunstância, posterior a esta data, foi considerada. A avaliação para determinar o preço-alvo foi conseguida por meio de uma média de dois métodos de avaliação, em particular pelo método do Fluxo de Caixa Descontado, usando o modelo de crescimento da perpetuidade e o método múltiplo sobre o valor terminal. As premissas consideradas para realizar a previsão financeira foram o resultado dos dados disponíveis divulgados publicamente pela empresa.
Após o estudo realizado, que aqui apresentamos, consideramos como recomendação a compra de ações da EA, com um preço alvo de USD $107.89 para o ano de 2019, representando um potencial de valorização de 34%, em comparação com o último preço de fecho divulgado, de USD $80.37, a 2 de janeiro de 2019.
Palavras-chave: Equity Research, Video Game Industry, Electronic Arts, Inc., Business Valuation, Discounted Cash Flow Method.
v
ACKNOWLEDGMENTS
This project represents the end of a journey that I began and that has given me new knowledge, new skills and a new way to look at life.
My special gratitude to Professor Ana Isabel Ortega Venâncio for her support and guidance, which has made possible for this project to come to an end. Also, my deep appreciation to Professor Clara Raposo, for the incentive and for creating the academic environment, for which I am very proud of. I am very honored to be a student of ISEG.
To my Mother, for being always there for me since the beginning of time. To my Father, for his perseverance, support and believe in me.
Nothing would be the same if we haven´t all row to the same side.
INDEX
ABSTRACT ... iii
RESUMO ... iv
ACKNOWLEDGMENTS ...v
INDEX OF FIGURES... viii
INDEX OF TABLES... x
1. RESEARCH SNAPSHOT ... 1
2. ELECTRONIC ARTS, INC ... 2
Overview ... 2
Ownership Structure ... 3
Dividends & Repurchase Program ... 3
Corporate Governance ... 3
Company´s Keys Members ... 4
Environmental Sustainability ... 5
3. BUSINESS STRATEGY... 6
Key Products ... 6
Business Segment ... 7
SWOT Analysis ... 8
4. MACROECONOMIC & INDUSTRY OUTLOOK ... 9
Macroeconomic Analysis ... 9
The Market ... 10
The Players ... 11
The Digital Business ... 11
The Future ... 12
Michael E. Porter´s Five Forces Model ... 13
Boston Consulting Group Matrix ... 14
Competitors ... 15
5. CONSOLIDATED FINANCIAL ANALYSIS... 16
Income Statement ... 16
Balance Sheet ... 17
6. FORECAST OF THE KEY VALUATION DRIVERS ... 19
Revenues ... 19
Cost of Revenue ... 19
vii
Operating Expenses ... 20
Net Working Capital (NWC)... 20
Capital Expenditures (CapEx) ... 20
7. VALUATION... 21
Market Return (Rm) ... 21
Risk-free rate (Rf) ... 21
Beta of the Invesment (β) ... 21
Cost of Equity (Re) ... 22
Cost of Debt (Rd) ... 22
Weighs ... 22
Corporate Tax (Tx) ... 23
Weighted Average Cost of Capital (WACC) ... 23
Terminal Value ... 23
Stock Target Price ... 24
Comparable Multiples Approach ... 24
8. INVESTMENT RISKS... 25
Sensitivity Analysis ... 25
Economic and Market Risks ... 26
Regulatory and Legal Risk... 27
Operational Risks... 28
9. APPENDICES ... 29
Appendix 1 – Consolidated Income Statement ... 29
Appendix 2 – Consolidated Balance Sheet ... 30
Appendix 3 – Assumptions for the Consolidated Balance Sheet ... 31
Appendix 4 – Net Working Capital ... 32
Appendix 5 – Consolidated Statements of Cash Flows ... 33
Appendix 6 – Perpetuity Growth Model ... 34
Appendix 7 – Multiple Method Model ... 34
Appendix 8 – Multiple Market Approach Peers ... 35
Appendix 9 – Free Cash Flow ... 35
Appendix 10 – Annual GDP Growth Rate of the United States of America and EA Annual
Shares Growth Rate in Logarithm Values ... 35
Appendix 11 – Number of Active Video Gamers Wordlwide (in millions). Source: Statista ... 35
INDEX OF FIGURES
Figure 1 | EA Stock Performance ... 1
Figure 2 | Net Revenue and Earnings ... 1
Figure 3 | Official Logo ... 2
Figure 4 | Electronic Arts Offices around the World ... 2
Figure 5 | Full-Time Employees ... 2
Figure 6 | Electronic Arts Net Revenue by Region and by Fiscal Year ... 2
Figure 7 | Ownership Structure by Type... 3
Figure 8 | Compensation Structure ... 3
Figure 9 |Supply Chain Management ... 5
Figure 10 | Microtransaction Screenshot... 6
Figure 11 | FIFA 19 Official Cover ... 6
Figure 12 | Battlefield 1 Official Cover ... 6
Figure 13 | The Sims 4 Official Cover ... 6
Figure 14 | Star Wars Battlefront II Official Cover ... 7
Figure 15 | Plant vs Zombies Propaganda ... 7
Figure 16 | Weights of Revenue by Type ... 7
Figure 17 | Digital Total Net Revenue ... 7
Figure 18 | Packaged Goods and Other Total Net Revenue ... 8
Figure 19 | Real GDP Growth Rate of the US and the World ... 9
Figure 20 | Relationship between GDP Annual Growth Rate of the World, US and EA Annual Shares Growth Rate ... 9
Figure 21 | Real GDP Growth Rate of Europe, Asia and Pacifick ... 9
Figure 22 | Federal Funds Target Range – Upper Limit ... 10
Figure 23 | Total Global Hardware Sales by Console in Total % ... 10
Figure 24 | Value of the Global Video Games Market from 2012 to 2021 ... 10
Figure 25 | PC and Console Games Revenue Worldwide, by type ... 11
Figure 26 | Video Game Players by Age ... 11
Figure 27 | Number of Video Game Players Worldwide by Region ... 11
Figure 28 | Video Game Consumer Market Value Worldwide from 2011 to 2020, by Distribution Type ... 12
Figure 29 | Expectations of the Sectors with the Most Investment of AR and VR Technology .. 12
Figure 30 | Michael E. Porter´s Five Forces ... 13
Figure 31 | BCG Matrix ... 14
Figure 32 | Activision Blizzard, Inc Logo ... 15
Figure 33 | Take-Two Interactive Software, Inc Logo ... 15
Figure 34 | Historical Changes (%) in Operating Expenses for Electronic Arts, Inc, Activision Blizzard, Inc and Take-Two Interactive Software, Inc ... 15
ix
Figure 35 | Historical Total Revenue, Cost of Revenue and Gross Profit ... 16
Figure 36 | EBITDA Bridge, FY 2018 ... 16
Figure 37 | Geographical Net Revenue ... 16
Figure 38 | Net Revenue by Platform ... 16
Figure 39 | Operating Expenses Evolution ... 17
Figure 40 | Operating Expenses Distribution, FY 2018 ... 17
Figure 41 | Money Market Funds Growth ... 17
Figure 42 | Debt/Equity Ratio Evolution ... 18
Figure 43 | Net Debt Evolution ... 18
Figure 44 | Forecast of Revenues by Segment ... 19
Figure 45 | Cost of Revenues Forecast by Segment ... 19
Figure 46 | Gross Profit and Gross Profit Margin Forecast ... 19
Figure 47 | Evolution of the NWC ... 20
Figure 48 | CapEx Forecast by Segment ... 20
INDEX OF TABLES
Table 1 | Risk Assessment ... 1
Table 2 | DCF Valuation ... 1
Table 3 | Key Statistics ... 1
Table 4 | Ownership Structure of Certain Beneficial Owners and Management... 3
Table 5 | EA Board of Directors ... 4
Table 6 | Digital Net Revenue by Type ... 7
Table 7 | SWOT Analysis ... 8
Table 8 | Historical Sales by Geographical Area ... 16
Table 9 | Historical Cost of Revenues Segmentation ... 17
Table 10 | Electronic Arts, Inc Senior Notes and Cost of Debt ... 22
Table 11 | Electronic Arts, Inc Total Commitments as of 31st March 2019 ... 22
Table 12 | Multiple Method Summary... 24
Table 13 | Stock Target Price ... 24
Table 14 | EV/R Output ... 24
Table 15 | Investment Analysis (Variables: Terminal Growth Rate (g) and WACC) ... 25
Table 16 | Changes in Terminal Growth Rate (g) and WACC ... 25
Table 17 | Investment Analysis (Variables: Terminal EV/EBITDA and WACC) ... 25
xi “O caos é uma ordem por decifrar”
0 1000 2000 3000 4000 5000 6000 7000 Net revenue Earnings Linear (Earnings) 0 20 40 60 80 100 120 140 160
Jan-16 Jul-16 Jan-17 Jul-17 Jan-18 Jul-18
Sto ck Pr ic e ( US D )
EA Adj Close Price Target Closing Price
Electronic Arts, Inc.
NASDAQ: EA:USBUY
1. RESEARCH SNAPSHOT Industry: Software | Sector: Technology
RECOMMENDATION
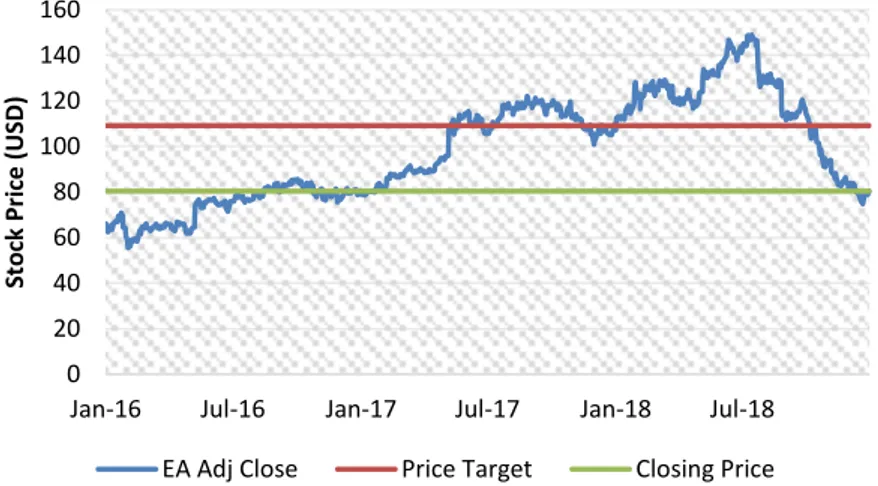
Our investment recommendation for Electronic Arts, Inc. stands for a Buy, at January 2nd, 2019, with a target price of USD 107.89 for 2019YE, using the discounted cash flow method. To determine this price, two different methods were applied to the terminal value, the perpetuity growth and the multiple method. There is an upside potential of +34% compared to its latest closing price of USD 80.37 on January 2nd, 2019. Regarding the risk assessment, we concluded that it has a high-risk profile for investment, considering the historical high degree of variation, of this trading price stock, along with the intense rivalry of this industry, and the level of exposure to international sales that this company experiences.
Figure 1 | EA Stock Performance | Source: finance.yahoo.com
Recent Events: Since September 2018, EA stock has fallen 46% from his all-time high on July, 2018, USD 148.93. The feature that had most impact on this decline was the delaying of the highly anticipated release of one of their most popular video game franchise, Battlefield V, which end up to sold 1 million less copies than the expected 7.3 million units. Moreover, their highest revenue driven video game, FIFA 19, didn´t generate the digital revenue that management was expecting for.
Long term perspective: We don´t expect that these recent events will impact the company business strategy. Considering EA historical performance, the video game industry growth, and the forecast accomplished in our analysis, we expect an increase in sales of 17% from USD 5,150 million in 2018 to USD 6,042 million in 2023F, which will drive an increase in the estimated net income, bringing a recover of EA stock price to the expected target price established for 2019YE.
Table 1 | Risk Assessment | Source: Author
Table 2 | DCF Valuation | Source: Author
DCF VALUATION
Terminal UFCF Growth Rate (g) 2.982%
WACC (r) 7.96%
Enterprise Value (Perpetuity
Growth Method) $30 401
Enterprise Value (Multiple
Method) $35 092
Diluted Shares Outstanding 306
Equity Value per Share
(Perpetuity Growth Method) $100.23
Equity Value per Share (Multiple
Method) $115.56
Average Equity Value per Share $107.89
Share Price at 02/01/2019 $80.37
Potential 34.24%
Table 3 | Key Statistics | Source: Author
KEY STATISTICS
Market Cap USD 24.6b
Adjusted Beta 0.96
52 Wk High 148.93
52 Wk Low 74.72
Dividend Yield N/A
Figure 2 | Net Revenue and Earnings (in millions of
U.S. Dollars) | Source: Author
2 Overview
Founded in 1982, headquartered in Redwood City, California, EA is a global leader in digital interactive entertainment with the mission to inspire the world to play. EA develops, market and sell games, content and services that can be played by consumers on a range of platforms, which include consoles, personal computers (PCs), mobile phones and tablets.
There are three core pillars to their strategy, “Players First”; “Commitment to Digital”; and “One EA”. They believe that the players are the foundation for their success, and they need to take them into account in everything that they do. This, consequently, also builds a deep, on-going and meaningful relationship with the players, aiming for their loyalty. Additionally, they also perceive the digital business as the future for the gaming industry, and their intention is to follow this trend, by capitalizing in this growing market. Finally, by harmonizing the company, by building their last pillar “One EA”, they gain operational flexibility, synergies and accelerate the pace of their development across franchises.
It all started with Mr. Trip Hawkins, an ex-employee of Apple Inc. who left the company in January, 1982, to open his own company on May of that same year, which was named Electronic Arts Inc. He personally funded it for the next six months, working by himself at his home. The company went public in September, 1989, in the American stock exchange (NASDAQ Global Select Market), under the symbol “EA”. After one year of being listed, EA registered a market capitalization of 79.5 billion dollars. As for now, it has 55 subsidiaries totally owned by the firm and 30 offices spread around the world (Figure 4). It also has approximately 9,300 regular, full-time employees (Figure 5), over 5,800 of whom are outside the United Stated.
EA derives their revenue mainly from the sales of interactive software games, and related content and services on game consoles, PCs, mobile phones and tablets. The difference between the two is that the first one to be mentioned is related to the revenue that is associated with the sale of software games or related product content or updates, whether delivered digitally (e.g. full-game downloads, extra-content) or via a physically disc (e.g. packaged goods). On the other hand, the service and other revenue is recognized by the inclusion of content that is accessed through hosting services (e.g. microtransactions) and subscriptions. Curiously, despite of North America registering the greater number of long-lived assets, in the fiscal year of 2018, most of the revenue did not come from North America, but instead it came from International sales (Figure 6).
Figure 3 | Official Logo | Source: Electronic Arts Inc.
Website
Figure 4 | Electronic Arts Offices around the World
| Source: Electronic Arts Inc. Website
Figure 5 | Full-Time Employees | Source:
Electronic Arts Inc. Website
Figure 6 | Electronic Arts Net Revenue by Region
and by Fiscal Year | Source: Form 10-K of Electronic Arts Inc
8 500 8 800 9 300 8 000 8 500 9 000 9 500 FY16 FY17 FY18 $1.907B $2.119B $2.09B $2.489B $2.726B $3.060B 0 2 4 6 FY16 FY17 FY18
North America International
74% 15%
2% 9%
Investment Advisor Hedge Fund Manager Bank
Others It´s also very important to share EA´s values, since they are the structure
on which this company was built. Creativity, pioneering, passion, determination, learning and teamwork, all together they form the vital foundations of their shared culture. Their purposes and beliefs motivate, unite and inspires them, and what they are today, started with these six fundamentals.
Ownership Structure
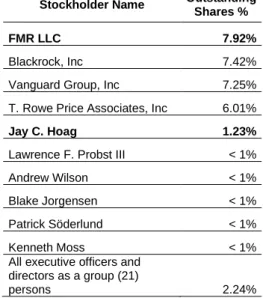
By August, 2018, the company had 306,111,943 shares outstanding. The number of shares held by directors, NEOs - Named Executive Officers, directors as a group, beneficial owners and other non-institutional beneficiaries, was around 5% of the common stock, leaving the remaining 95% to institutional ownership, being the investment advisory companies the ones with the highest share position, 74% (Figure 7), with one of the largest asset managers in the world, FMR LLC, leading the way with a total share position of 7.92% (Table 4).
Dividends & Repurchase Program
No cash dividends were ever paid, and EA does not anticipate paying any cash dividends in the foreseeable future. Instead, there is an alive Stock Repurchase Program that expects to repurchase up to USD 2.4 billion of EA common stock, authorized by the full Board of Directors. This program was approved in May 2017 and expires on May 31, 2020.
Corporate Governance
Electronic Arts, Inc governance system is operated by the existence of a Board of Directors, an Audit Committee, a Compensation Committee Charter, a Nominating and Governance Committee Charter and a Statutory Auditor (KPMG LLP), that served as EA auditor since 1987.
The Board of Directors is composed by nine members (Table 5), Lawrence Probst, and eight independent directors, their names Andrew Wilson, Heidi Ueberroth, Luis Ubiñas, Leonard Coleman, Jay Hoag, Jeffrey Huber, Talbott Roche and Richard Simonson. The Board serves as the ultimate decision-making body of EA and is elected annually by the stockholders at EA´s annual meeting, according with the rule of one-share, one-vote system, contemplating the recommendations of the Nominating and Governance Committee.
The Nominating and Governance Committee is composed by two independent directors, Luis Ubiñas, Leonard Coleman that are charged with aiding the Board membership election committee selection, evaluation of the overall effectiveness of the Board, and review and consideration of developments in corporate governance practices.
Figure 7 | Ownership Structure by Type | Source:
Bloomberg
Figure 8 | Compensation Structure (NEOs) |
Source: Annual Meeting of Stockholders 2018
Table 4 | Ownership Structure of Certain
Beneficial Owners and Management | Source: Annual Meeting of Stockholders 2018
Stockholder Name Outstanding
Shares %
FMR LLC 7.92%
Blackrock, Inc 7.42%
Vanguard Group, Inc 7.25%
T. Rowe Price Associates, Inc 6.01%
Jay C. Hoag 1.23%
Lawrence F. Probst III < 1%
Andrew Wilson < 1%
Blake Jorgensen < 1%
Patrick Söderlund < 1%
Kenneth Moss < 1%
All executive officers and directors as a group (21) persons 2.24% 9% 9% 41% 41% Base Salary
Performance Cash Bonus RSUs
4
The Compensation Committee is composed by three independent directors, Leonard Coleman, Jay Hoag, and Heidi Ueberroth. Their purpose is to assist the Board of Directors in discharging its responsibilities with respect to the compensation and benefits of EA´s employees, executive officers and directors.
The Audit Committee works as a supervising structure for the company. The members pointed out for this committee were Jeffrey Huber, Talbott Roche and Richard Simonson.
Company´s Keys Members
Mr. Lawrence F. Probst III has been the Chairman of the Board of Directors since July 1994, making him the oldest member of the Board. Mr. Probst holds a B.Sc. degree from the University of Delaware.
Mr. Jay C. Hoag, age 60, Director of EA, co-founded Technology Crossover Ventures, a leading provider of growth capital to technology companies and serves as its Founding General Partner. Has served on the board of directors of Netflix, Inc., TripAdvisor, Inc. and Zillow Group, Inc. and several private companies. He holds a B.A. from Northwestern University and an M.B.A. from the University of Michigan.
Mr. Andrew Wilson has served as EA´s Chief Executive Officer and as a director of EA since September 2013. Since he joined EA on May 2000, he held several positions, including Executive Vice President and Senior Vice President; both positions for EA Sports, a division of EA dedicated to developing and publish sports video games.
Mr. Luis A. Ubiñas is currently Lead Director and has served as President of the Ford Foundation. He also spent 18 years, prior to joining the Ford Foundation, with McKinsey & Company where he held various positions including Managing Director. He also serves on the boards of several non-profit organizations. He holds a B.A. degree from Harvard College and an M.B.A from Harvard Business School.
Mr. Blake Jorgensen has served as EA´s Chief Financial Officer since September 2012 and, in addition, became EA´s Chief Operating Officer in April 2018. Prior to joining EA, he served as Executive Vice President Chief Financial Officer of Levi Strauss & Co., and Yahoo! Inc. His M.B.A is from Harvard Business School and his undergraduate degree from Stanford University.
Table 5 | EA Board of Directors | Source: Annual
Meeting of Stockholders 2018
Name Current Position
Lawrence Probst Chairman of the Board
Andrew Wilson
Chief Executive Officer, Director
Luis Ubinas
Lead Independent Director
Heidi Ueberroth Independent Director
Leonard Coleman Independent Director
Jay Hoag Independent Director
Jeffrey Huber Independent Director
Talbott Roche Independent Director
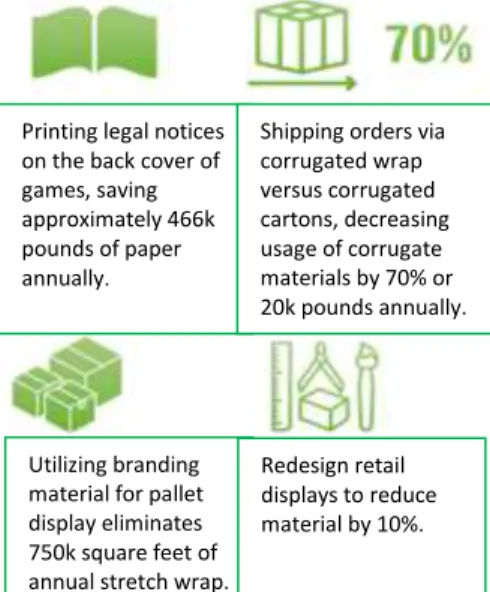
Utilizing branding material for pallet display eliminates 750k square feet of annual stretch wrap.
Redesign retail displays to reduce material by 10%. Environmental Sustainability
The world is becoming digital and EA is no exception, as they aim to integrate environmental responsibility and sustainability into their operational, product and supply chain strategies (Figure 9). They continue to reduce their carbon footprint and waste generated in their operations by shifting away from traditional models of manufacturing, packaging, and distributing physical discs. This reduction not only aligns with their business objectives but also contributes to actions needed to combat global climate change. In a more practical view, over the past five years, EA estimate that their digital transformations have saved 20.3 million pounds of plastic packaging, 4.1 million pounds of papers inserts and 53 million discs. No fines, penalties or levies were charged to EA as a result of environmental matters.
Figure 9 |Supply Chain Management | Source:
Electronic Arts Inc. Website
Printing legal notices on the back cover of games, saving approximately 466k pounds of paper annually.
Shipping orders via corrugated wrap versus corrugated cartons, decreasing usage of corrugate materials by 70% or 20k pounds annually.
6 Key Products
The source of revenue of EA derives by selling games and services related. These games can be acquired through digital distribution channels and through retail channels. EA uses brands that are wholly owned (such as Battlefield, Need for Speed, The Sims, and Plant v. Zombies) or licensed from others (such as FIFA, Madden, NFL and Star Wars). However, the games sold are not the end, they are only the beginning. Their digital business performance offers, within their games, live services, including microtransactions, Figure 10, and downloadable content that provide additional depth and engagement opportunities for the players. In terms of total net revenue, EA registered USD 5,150 million and all thanks to the below games, that we consider to be their key products for this success:
FIFA: Is a series of football video games (Figure 11), that is released annually to different platforms, being the latest releases to PS4, PC, Xbox One and Nintendo Switch. FIFA is one of the crown jewels of EA, being currently the largest and most popular game, with a thirty-year legacy and with an increasing demand since it was first released. It represents approximately 21% of the total net revenue for the fiscal year 2018. FIFA also has an online experience called Ultimate Team, played by millions all over the world every day and where players can build their own squad, by deciding on using, or not, real money purchases – microtransactions – to have their dream FIFA squad to compete with other players. This live service is the main generator of revenues in this franchise.
BATTLEFIELD: Is a series of first-person shooter video game that puts the player under a war theme (Figure 12). This series is mainly focused in online multiplayer. The Battlefield 1 game released in 2017 was, along with FIFA 18 and FIFA 17, the primarily product that drove the net revenue for fiscal year 2018.
THE SIMS: Is a series of life simulation video game that allows players to create a neighborhood of simulated people (Sims) and control their lives (Figure 13). This series is one of the best-selling video games of all-time despite their decrease in demand for the past years, particularly between 2016 and 2017 fiscal years.
STAR WARS: Is an action shooter video game based on the Star Wars franchise (Figure 14). It is very popular amongst gamers however very criticize as well. One of the major’s sources of income of EA is driven by their digital business – microtransactions – and this game had it in a way that the players who bought loot boxes, through the microtransactions,
Figure 10 | Microtransaction Screenshot | Source:
Call of Duty in Game Screenshot
Figure 11 | FIFA 19 Official Cover | Source:
Electronic Arts Inc. Website
Figure 12 | Battlefield 1 Official Cover | Source:
Electronic Arts Inc. Website
Figure 13 | The Sims 4Official Cover | Source:
Electronic Arts Inc. Website
0% 10% 20% 30% 40% 50% 60% 70% 80% 90% 100% 2017 2018
Packaged Goods and Other Mobile
Ful game downloads Live services 2 874 3 450 20% 500 1 000 1 500 2 000 2 500 3 000 3 500 4 000 2017 2018 would have a substantial gameplay advantage, if purchased with real
money. Even with all the criticism around the latest two games released for consoles and PC (Star Wars Battlefront II and Star Wars Battlefront), this game continues to be highly relevant in terms of revenue for EA.
OTHERS: There are several more games that are worth mentioning but don´t have the same impact in terms of visibility or even revenue that the ones announced earlier. For example, Plants vs Zombies received nominations in “Best Game Design”, “Innovation”, and “Best Download Game” (Figure 15) for the Game Developers Choice Awards. In the sports section, they have NHL franchise, which is a game series that simulates professional ice hockey from the National Hockey League. NBA, UFC and Madden series are also games that simulate professional basketball, the other professional mixed martial arts fighting and the remaining American football experience. All of them highly popular amongst players that enjoy sports games and competition.
Business Segment
Despite of EA only recognizing one reportable segment, they place a greater emphasis on assessing their business performance through a review of net revenue by type, (Figure 16).
Digital
Digital net revenue, which includes full game downloads, live services and mobile revenue, hit USD 3,450 million in 2018, representing a growth of 20%, as compared to fiscal year 2017 (Figure 17). This growth was driven by the increase in all three types of digital revenues (Table 6), particularly in the live services sector, which comprises extra content, subscriptions and advertising. It experienced an increase of USD 494 million (+31%), primarily driven by Ultimate Team (FIFA) and Battlefield 1. The full game downloads also registered an increase of USD 48 million (+7%), driven by FIFA 18 and Mass Effect: Andromeda. Finally, the mobile revenue increased 5%, hitting a growth of USD 34 million, thanks to Star Wars: Galaxy of Heroes and FIFA Mobile. This evolution is in line with the growth of the digital market industry worldwide.
Table 6 | Digital Net Revenue by Type (in millions of U.S. Dollars) | Source: Electronic Arts
From 10-K
Figure 14 | Star Wars Battlefront II Official Cover
| Source: Electronic Arts Inc. Website
Figure 15 | Plant vs Zombies Propaganda |
Source: CFO Presentation for FY17 EA Investor Day
Figure 16 | Weights of Revenue by Type | Source: Electronic Arts From 10-K
Figure 17 | Digital Total Net Revenue (in millions
of U.S. Dollars) | Source: Electronic Arts From 10-K
In millions except for % Change 2018 2017 $ Change % Change
Live services 2,083 1,589 494 31% Full game downloads 707 659 48 7% Mobile 660 626 34 5%
8 Packaged Goods and Other
Packaged Goods and Other include revenues from software that are distributed physically. The physical distribution is done through traditional channels such as brick and mortar retailers, or by software licensing from third parties, i.e. makers of console platforms such as Sony (PlayStation), which then include certain EA products for sale with their own products. For fiscal year 2018, this type of business hit a net revenue of USD 1,700 million (Figure 18) primarily driven by FIFA 18, FIFA 17, and Battlefield 1. However, as compared to fiscal year 2017, this net revenue decreased 14%, and mainly because consumers are increasingly purchasing EA digital games instead.
Figure 18 | Packaged Goods and Other Total Net Revenue (in millions of U.S. Dollars) | Source: Electronic Arts From 10-K and Author analysis
SWOT Analysis
Table 7 | SWOT Analysis | Source: J. Horta
analysis
Strengths
► Leader in the industry; ► Commitment to digital;
► Product innovation and diversity under the gaming industry; ► Global presense;
► High diversity of games in several platforms;
► Focus on the players by listening to their critics and adapting their products accordingly.
Opportunities
► Opening of new segments, as players are getting older and younger due to the reach of the digital era;
► Virtual Reality: large potential market that EA can benefit from, by adapting their games;
► Growing demand for online services.
Table 4 | SWOT Analysis | Source: J. Horta analysis
| Source: J. goodbye everybody
Weaknesses
► Limited products and success outside the core business; ► High production costs;
► Slow mobile revenue growth in comparison to the mobile market growth;
► Revenues driven by seasonality; ► EA business high dependence in
tri-party performance, i.e. Sony; ► Revenues highly dependence in
the success of specific titles.
Threats
► Unpredictable consumers/changes in the consumer buying behavior; ► High discretionary product
that could be affected by economic downturns;
► Software piracy and second-hand re-selling that could lead to profit losses. 1 971 1 700 -14% 1 550 1 600 1 650 1 700 1 750 1 800 1 850 1 900 1 950 2 000 2017 2018
0 0,2 0,4 0,6 0,8 1 1,2 1,4 1,6 2012 2013 2014 2015 2016 2017 2018 2019 Electronic Arts, Inc
United States World 0,0% 0,5% 1,0% 1,5% 2,0% 2,5% 3,0% 3,5% 4,0%
United States World
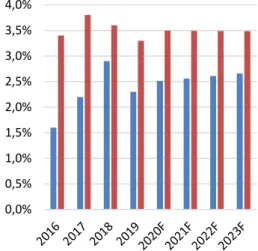
0% 1% 2% 3% 4% 5% 6% 7% 2012 2013 2014 2015 2016 2017 2018 2019 2020F 2021F 2022F 2023F Asia and Pacific Europe Macroeconomic Analysis
The World GDP growth rate is positive and is increasing between 3.30% to 3.80% by year, during the period analyzed (Figure 19). This suggests that the economy is expanding, and so will businesses, jobs and personal income. All these triggers can lead to an increase in private consumption, affecting positively the company´s performance. It is also noticeable that this trend is being followed by the United States of America (US), that similarly presents positive GDP growth rates, wavering between 1.6% and 2.9% by year.
The US economy has a vital role in the business of Electronic Arts, Inc. Aside from being the place where this company have their headquarters located, it is also the region where 41% of EA revenues came from, in the fiscal year 2018. Considering this connection between both, we then started to study if there was any kind of relationship between the real GDP annual growth rate of the World, the US and the EA annual shares growth rate. We begin by extracting the respective data for each one, for the period between 2012 and 2019. In order to put both data under the same scale, for analysis purpose, we applied the logarithm of the values that were obtained and reach to the conclusion that there is in fact a relationship between both real GDP annual growth rate and EA annual shares growth rate. As it can be seen in Figure 20, all movements in terms of GDP growth rate are replicated by EA – specially comparing between US GDP rate movements with EA´s - either it´s an increase in the growth rate, as it can be seen between 2013 and 2015 and again between 2016 and 2018, or a decrease, visible between 2012 and 2013, 2015 to 2016 and 2018 to 2019. This informs us that the state of the economy of the United States of America has a direct impact over the sales performance of the company. This is mainly explained by the fact that EA products are a highly discretionary item that rely on the consumers financial condition. That being so, when the economy starts to strengthen, the demand for consumer discretionary goods increase, improving sales and, consequently, the stock performance of consumer discretionary companies.
The highest concentration of video game players is in Asia and Pacific, being Europe the third region, after America. Asia economy is growing at an average of 5.5% a year, more than 4% for the same average in Europe (Figure 21). The forecast indicates that these values should remain in the same level for the next 4 years.
Figure 19 | Real GDP Growth Rate of the US and
the World | Source: IMF´s World Economic Outlook
Figure 20 | Relationship between GDP Annual
Growth Rate of the World, US and EA Annual Shares Growth Rate (in logarithm values) |
Source: IMF´s World Economic Outlook and finance.yahoo.com
Figure 21 | Real GDP Growth Rate of Europe,
Asia and Pacific | Source: IMF´s World Economic Outlook
10 Federal Reserve Funds (FED) Rate
In January 31st, 2019, the FED rate was 2.5%. Figure 22 presents the evolution of FED rate. The rate increased since 2015 by 2%, being the expectation for this rate to remain at this percentage level until 2021, unless the economic conditions worsened, which would consequently lower the FED rate.
Industry Outlook
The Market
When it all started, in the 1950s, video games were primarily used on an academic basis as training tools. Scientists would test the first forms of artificial intelligence on games like chess. The idea that video games could be played on a television set was conceived by engineer Ralph Baer in the 1960s. A decade later, by the 1970s, video games were ready to reach the shells for consumers to buy and use them as a form of virtual entertainment. They were made in a way to be extremely user friendly with tactile features, like joysticks, so that they could be accessible even to the most basic user. The evolution from here was rapid and only a few years later consoles were already utilizing microprocessors as well as ROM cartridge-based games, that allowed players to change games just by switching cartridges. By 1980s, Electronic Arts, Inc was founded, and improved video games graphics and the firsts 3D games started to be released.
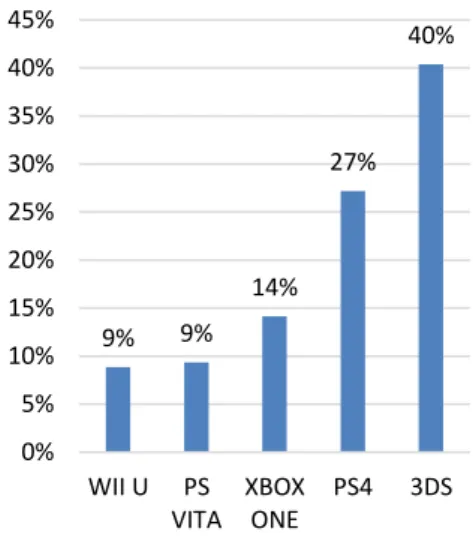
This business however relies on the success and availability of platforms developed by third parties and the ability for the manufactures of games to develop commercially successful products and services for those same platforms, which leads to the so-called “console wars”. As for now, we see that Nintendo 3DS, portable console, has the highest market share, followed by Playstation 4. The chart presented in Figure 23 is very relevant for all companies that develop and sell their games in a way that the platform for which these companies develop their products and services, may not succeed as expected. Also, new platforms, where the investment could be minor, may take market share, which could affect their revenues opportunities and consequently harm their financial performance. Additionally, exclusive licensing arrangements can be done that can highly affect their ability to deliver or market products or services on certain platforms where these agreements were not made.
Figure 22 | Federal Funds Target Range – Upper
Limit | Source: Bloomberg
Figure 23 | Total Global Hardware Sales by
Console in Total % | Source: Visual Capitalist
Figure 24 | Value of the Global Video Games
Market from 2012 to 2021 (in billion U.S. Dollars) | Source: Statista 0,25%0,25%0,25% 0,25% 0,5% 0,75% 1,50% 2,50% 0,00% 0,50% 1,00% 1,50% 2,00% 2,50% 3,00% 9% 9% 14% 27% 40% 0% 5% 10% 15% 20% 25% 30% 35% 40% 45% WII U PS VITA XBOX ONE PS4 3DS 5361 71 82 93 105 115124 131138 0 20 40 60 80 100 120 140 160 2012 2013 2014 2015 2016 2017 2018 2019* 2020* 2021*
27% 29% 18% 26% <18 18-35 36-49 50+ 4 4 5 5 5 6 6 6 7 8 8 8 9 10 0 2 4 6 8 10 12 14 16 18
Additional Content Full Game
1B
407M 337M
301M
Asia-Pacific Americas
Europe Middle East & Africa As regards to the evolution of the market value for this industry, an
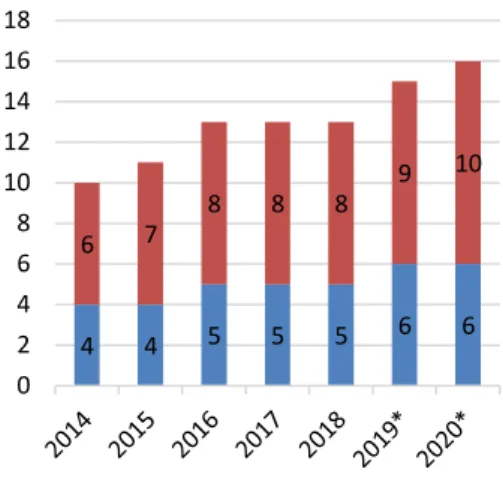
increase of 118% was accomplished between 2012 and 2018, reaching a market value of USD 115 billion (Figure 24). This trend goes in line with the growth of the global revenue of consoles and PC games that show us that in 2018, USD 13 billion dollars were spent, with a forecast for 2020 of USD 16 billion dollars being spent (Figure 25). Both growths can be justified by an improvement over the years of the quality of the graphics, along with a development of online gameplay capability, which makes it possible for people all over the world to be connect play at the same time.
Other factors that can contribute for success in the game industry are creativity, making games with a good premise/story, and a non-volatile price for the games, which don´t fluctuate over the years, being listed for around USD 60. This non-volatile price seems to exist in order to manage consumer expectations, as there is a strong possibility that if the prices increase, consumers will just go for an alternative investment. This price tag will then benefit the consumers by knowing that they will not spend more than a certain amount of money for a game. The same thing goes for companies that develop games, that know form start how much they can expect to get in return.
The Players
The average gamer is 34 years old and 73% are age 18 or older (Figure 26). Concerning the gender, males represent a slight greater portion of the video game-playing population, being distributed as 59% male and 41% female. Gamers also think video games offer best value for money than other traditional avenues of entertainment, such as music and movies. Among video game genres, the favorite ones are action, shooter and sport games. Worldwide, there are over 2 billion gamers, half of whom come from the Asia-Pacific region alone (Figure 27).
The Digital Business
The world is turning digital, and the gaming industry is no exception. Consumers are gradually swapping from physical games to digital ones, and this is a trend that EA is capitalizing on. Historically, a customer would simply buy the game and play it until he feels satisfied, then would buy another one. Currently, this digital trend allows the same customer to enter an almost infinite world, where the game is constantly being updated and expanded by the game´s makers, involving new scenarios to be discovered and played and a more intense interaction with a diverse online community of players. As a result, games last longer and are more profitable, as every add-on in the digital game is being considered in terms of revenue.
Figure 25 | PC and Console Games Revenue
Worldwide, by type (in billion U.S. Dollars) |
Source: Statista
Figure 26 | Video Game Players by Age | Source:
ESA
Figure 27 | Number of Video Game Players
12 5 7 7 9 9 10 13 16 17 20 22 18 16 13 12 11 11 12 12 12 Digital Market Physical Market Linear (Digital Market) Players are increasingly purchasing games as digital downloads, as
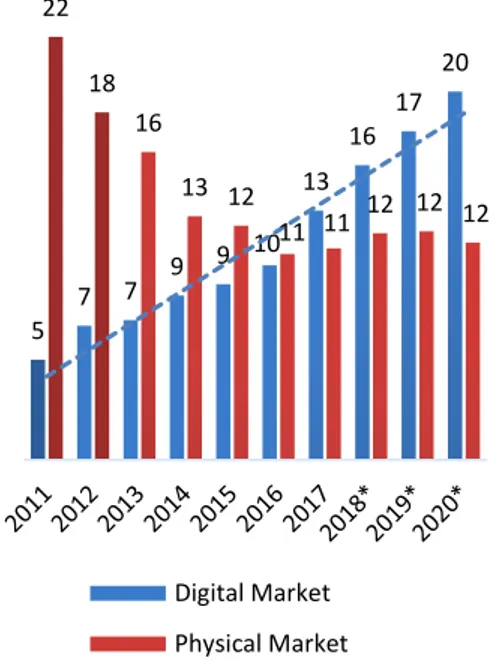
opposed to purchasing physical discs, and besides that, there are also the live services that are provided on an ongoing basis. These digital live services include microtransactions, subscriptions, mobile gaming and extra content. This change goes along with the market that reflects the evolution of the digital against the physical market, with an inverse relationship, as it is possible to see an increase of around 70%, from 2011 to 2020 (Figure 28).
Considering this notable growth in the digital industry, it´s still very hard to imagine the complete elimination of all physical games, for various reasons. There are still many people that cannot afford a high-speed internet connection and give a downloadable game as a gift is not yet seen as a viable alternative. There is also the issue of re-selling secondhand games in a digital format, as it is not yet possible to do, something that does not affect the physical games. All these factors together constitute the strength that the physical format still has in today´s date, and by analyzing the segment information of EA, we see that this format still represents 33% of their total net revenue in 2018 fiscal year, which is still a significant percentage, taking into account the digital evolution in the market that has been verified. Despite this, the digital market will be the future of this industry, however companies, such as EA, should not take off their agenda the physical format yet, as it still represents a considerable slice of their revenue.
The Future
The future of the video games industry may lie in the virtual reality (VR) and augmented reality (AR) as a genre, both are alternative realities that emulate real life. This technology can be used in several sectors such as therapy, by treating anxiety, taking people with fear of heights by transporting them to top floors where they must carry out a range of toe-tingling feats, health care, by simulating surgeries, education, by immersing students in experiences that are academically relevant, and for example real estate, by giving consumers, that don´t have the availability to see the pretended house, a showcase of the same house that they would like to buy before actually purchasing it. The sectors that are potentially most impacted by this new technology can be seen in the Figure 29, being the gaming content the one with more weight of them all. This global virtual reality market was valued as USD 3.13 billion in 2017 and is expected to reach USD 49.7 billion by 2023, according to Reuters analysis.
As for now, both AR and VR technology are still very expensive, but once new versions start to be released, is expected that the older ones will
Figure 28 | Video Game Consumer Market Value
Worldwide from 2011 to 2020, by Distribution Type (in billion U.S. Dollars) | Source: Statista
Figure 29 | Expectations of the Sectors with the
Most Investment of AR and VR Technology |
Source: Perkins Coie
17% 18% 18% 19% 19% 20% 21% 26% 26% 59% Manufacturing Retail Movies Military Live events Marketing Real Estate Healthcare Education Gaming
0 1 2 3 4 5 Industry Rivalry Threat of Substitutes Threat of New Entrants Bargaining Power of Suppliers Bargaining Power of Consumers become more affordable hence accessible to a greater number of people,
having the opportunity to, perhaps one day, become an integral part of player´s gaming experiences.
Michael E. Porter´s Five Forces Model
Industry Rivalry: Very High
Out of the Porter´s five forces, the industry rivalry represents the biggest threat to EA. The video game industry does not tend to have a high brand loyalty, unlike other industries. When people consume video games, they don´t tend to base their decision on who is the company that makes them, instead they rely on how entertainment the game is, which is one of the keys for success in this business. Considering this premise, EA does not have an edge over their competitors just because is one of the most valuable entertainment companies in the world, and this alone can allow a potentially easier success on the titles that are released by their rivals. The company must continue to develop and publish the most entertaining and visually outstanding games, while being creative, at the same time, with the products that are published.
Threats of Substitutes: Low
Substitute products do not represent a strong threat to EA. A substitute product can be an app-based game that is played in smartphones or tablets. These app-based games are in the market for lower prices that the ones charged by EA, yet, their gaming experience is not comparable to EA games.
Threats of New Entrants: High
Minimal government regulation allows new firms to easily enter in the video game industry. Considering that the brand loyalty is very low in this business, it only takes a brilliant idea and intellectual capacity to bring a video game to life. If achieved, this is all it takes for an unknown company to capture a portion of the video game industry.
Bargaining Power of Suppliers: Low
EA can easily find similar products, suppliers of graphic cards, software, hardware and even intellectual property in the form of software code, patented technology or audio-visual elements. EA has opted for diversification, having several suppliers under their scope, due to the range of materials and products that are needed to produce a game, this means that if a supplier raises the price, it will not affect EA total cost of doing business as they could easily find alternative suppliers.
Figure 30 | Michael E. Porter´s Five Forces |
14 Bargaining Power of Consumers: High
This Porter force constitutes a serious threat to EA. There are currently a considerably array of similar products in this industry, the offer is very high, and if a consumer is not pleased by an EA game they can quickly switch and change their mind set by spending their money in alternative games. It´s important to note that this is a highly discretionary purchase and consumers can be very selective on buying these non-essential products.
Boston Consulting Group Matrix
After examining the industry outlook and analyzing EA operational segment, with all its revenues by type, we can use a graphic to represent EA products and services, categorizing them into the BCG matrix (Figure 31). Digital and Packaged Goods and Other, are classified considering their relative market share and market growth.
The Digital is categorized as a “Star”, as this segment presents a high relative market share in the context of a rapidly growing industry. It can be seen in the Figure 24 as the golden bubble. The digital presented a remarkable growth, between 2011 and 2018, with a growth rate of 194%. EA is already considered a big-time player in the digital industry, by taking a high market share in comparison to its competitors. The Ultimate Team live service, from the game FIFA, is EA´s major success, from a revenue point a view, as it´s their most popular game/service. It´s clearly a market leader, in this fast-growing market, by generating alone USD 1 billion of revenues in fiscal year 2018. Nevertheless, it also has high expenses associated, considering all its advertising, marketing and promotional spending.
The Packaged Goods and Other segment type are categorized as “Dog”. This segment was the foundation of the company and is still generating income. In the fiscal year 2018, it represented one quarter of the total net revenue. The income that is derived from this source has been in decline since 2013, with a negative growth rate of 27%, due to the technological change in the gaming industry, that severely affected these financial figures. There is currently no expectation that this trend will change in the future. EA will probably gradually reduce this segment has it has little or non-potential to generate future cash flows.
Figure 31 | BCG Matrix | Source: Author analysis
Digital M arke t G rowt h
Relative Market Share
Packaged Goods and Other
-10% 0% 10% 20% 30% 40% 50% 60% 2015 2016 2017 2018
Electronic Arts, Inc Activision Blizzard, Inc
Take-Two Interactive Software, Inc Competitors
The video game industry is highly competitive. New entrants in this business are common as these new companies don´t necessarily need high investments to create succesfull games. A minor investment with an innovative and enterteining gameplay, is what it takes for a small company to join the league of the top video games producers in this business. EA has two main competitors in regards to video game software development and publishment, Activison Blizzard, Inc and Take-Two Interactive Software, Inc, both quoted in NASDAQ Composite Index, and one main competitor in regards to the digital distribution platforms, Steam. Steam is the most popular on-line digital distribution platform for games, there are currently 30,800 games ready to be bought and downloaded. This is an indicator of how vast and competitive this business is, having a daily on-line number of players between 10 million and 15 million. EA has its own on-line digital distribution platform called Origin, where only EA titles can be played, and already counts with over 50 million registered users, against over 150 million from Steam. By doing this, EA avoids to disburse a percentage of the sales from their games and at the same time is capable of gaining their own market share over the digital distributed games from Steam. However, this is not EA main concern, as this is not their core business
Activision Blizzard, Inc is a global leader of development and publishment of interactive software and entertainment content, currently EA´s main competitor. In 2017, Activision recorded a net revenue of USD 7 billion, 40% more than EA. Its key products include Call of Duty, Crash Bandicoot, World of Warcraft and Destiny franchises, all major hits in the gaming industry. This company, contrary to EA, paid cash dividends of USD 0.34 per common share on May 9, 2018, and has boosted their dividends annually for eight years straight. Interestingly, despite Activision higher amount of sales, they recorded a net income, in fiscal year 2017, of USD 273 million, 254% less than what EA announced for the same fiscal period, mainly due to the high costs and expenses for that year on the product development, which did not occurred on 2018, where Activision was capable to reduce operating expenses in 3%, contrary to EA and Take-Two Interactive Software, (Figure 34).
Take-Two Interactive Software, Inc, is a very appraised company in this industry for the community of gamers. They are the creators of one of the most critically-acclaimed and commercially succesfull video game of all time – Grand Theft Auto V– with over 95 milion units sold to date. This game was released in 2014 and they recorded, in that same fiscal year, the highest net revenue of all time, USD 2.3 billion, 50% less than EA´s revenue, recorderd in fiscal year 2018. Although they do not have the same size as EA or Activision, they still have a high market share in this market.
Figure 32 | Activision Blizzard, Inc Logo | Source:
Activision Website
Figure 33 | Take-Two Interactive Software, Inc
Logo | Source: Take-Two Website
Figure 34 | Historical Changes (%) in Operating
Expenses for Electronic Arts, Inc, Activision Blizzard, Inc and Take-Two Interactive Software, Inc | Source: Form 10-K and Author analysis
16
41% 59%
North America International
68% 16%
13%
Xbox One, Playstation 4, Switch PC / Browser
Mobile Income Statement
In 2018, EA revenues increased to USD 5,150 million (+6% from the previous year). This growth was primarily driven by FIFA 18, Battlefield 1, and FIFA 17, in the product segment, and by FIFA Ultimate Team, Star Wars: Galaxy of Heroes, and Battlefield 1 Premium, in the service segment. This growth tendency has also been verified along the last years (Figure 35). We also decomposed the net revenue by platform being the top three consoles, Xbox One, Playstation 4 and Switch (Figure 38).
Geographically, revenues have increased in North America and International (Table 8 and Figure 37). Furthermore, the revenues generated in the United States represented over 99% of their total North America net revenue and roughly 37% of the total net revenue. Note that there were no other countries with net revenue greater than 10%.
Table 8 | HistoricalSales by Geographical Area (in millions of U.S. Dollars) | Source:
Electronic Arts Form 10-K
Gross profit has increased by 74%, between the period of 2014 o 2018 (Figure 35). This trend is due to the increase in digital sales and the decrease in inventory costs.
Regarding the cost of revenue, it has decreased to USD 1,277 million (-2% from the previous year) due to the decrease in the cost of product that was achieved by the decrease in inventory costs, associated with Battlefield 1 and Titanfall 2, and warehouse operations costs, as a result of the closure of EA Switzerland distribution business. This along with a USD 25 million decrease in intangible amortization primarily due to the recognition of a USD 15 million impairment charge on an acquisition-related intangible asset, were the main factors that contributed to this result, however this tendency was not always verified, as for example, between 2014 and 2015, the cost of revenue increased by 6% (Table 9).
Figure 35 | Historical Total Revenue, Cost of
Revenue and Gross Profit (in millions of U.S. Dollars) | Source: Form 10-K
Figure 36 | EBITDA Bridge, FY 2018 (in millions of
U.S. Dollars) | Source: Form 10-K
Figure 37 | Geographical Net Revenue | Source:
Form 10-K
Figure 38| Net Revenue by Platform | Source:
Form 10-K 1 000 2 000 3 000 4 000 5 000 6 000 2014 2015 2016 2017 2018 Net revenue Cost of revenue Gross profit 1 434 2 439 3 873 1 277 5 150 EBIT Total operating expenses Gross profit Cost of revenue Net revenue
5. CONSOLIDATED FINANCIAL ANALYSIS
Sales by Geographical Area 2014 2015 2016 2017 2018
North America 1 510 1 956 1 907 2 119 2 090
405 1 876 0% 50% 100% 150% 200% 250% 300% 350% 400% 2017 2018
Money Market Funds % Change
Table 9 | Historical Cost of Revenues Segmentation (in millions of U.S. Dollars) | Source:
Electronic Arts Form 10-K
From an operating expenses standpoint (Figure 39 and Figure 40), Research and Development expenses rose by USD 115 million or 10% in fiscal year 2018, as compared to fiscal year 2017, to USD 1,320 million. This growth was due to the increase in personnel-related costs, recruitment of new employees, an increase in salary costs, an increase in stock-based compensation, and lastly an increase in facilities-related costs.
General and Administrative expenses also registered a growth of 7% to USD 469 million, as a result of the increase in contracted services, which led to a higher legal expense, and an increase in personnel-related costs.
In regards to Marketing and Sales,expenses decreased by USD 32 million, (or -5%) to USD 469 million in fiscal year 2018, compared to fiscal year 2017, mainly due to a decrease in advertising and promotional spending in Battlefield 1 and Titanfall 2, the same games that accounted for the decrease on inventory costs.
Balance Sheet
There are three main components that stand out, on the assets side, cash and cash equivalents, goodwill, and short-term investments, representing 50%, 22% and 13%, respectively of the total assets. The total assets side grew by 11% in fiscal year 2018 to USD 8,584 million, compared to fiscal year 2017, mainly due to the increase in cash and cash equivalents, more specifically on the money market funds growth (Figure 41). In contrary, the short-term investments diminished by 45% to USD 1,082 million (Appendix 2) in fiscal year 2018, primarily due to a reduction in the fair value of corporate bonds, U.S. Treasury securities, Commercial paper, U.S. agency securities and asset-backed securities. Goodwill, on the other hand, recorded a growth of 10%, which goes in line with the tendency of a rise in the number of active video gamers worldwide (Appendix 11).
Concerning the liabilities, the main components are the accrued and other current liabilities, senior notes and income tax obligations, representing 41%, 25% and 6%, respectively, out of the total liabilities The senior notes were issued as USD 600 million aggregate principal amount of 3.70% Senior Notes due March 1, 2021 and USD 400 million aggregate principal
Figure 39 | Operating Expenses Evolution (in
millions of U.S. Dollars) | Source: Form 10-K
Figure 40 | Operating Expenses Distribution, FY
2018 | Source: Form 10-K
Figure 41 | Money Market Funds Growth (in
millions of U.S. Dollars) | Source: Form 10-K and Author analysis
Cost of Revenues 2014 2015 2016 2017 2018
Product 1 032 1 028 938 893 822 Servi ce a nd other 315 401 416 405 455 Tota l Cos t of Revenue 1 347 1 429 1 354 1 298 1 277
1205 673 439 1320 641 469 0 200 400 600 800 1000 1200 1400 Research and development Marketing and sales General and administrative 2017 2018 54% 26% 19% 1%
Research and development Marketing and sales General and administrative Amortization of intangibles
18 1377 749 994 1092 -270 -400 -200 0 200 400 600 800 1000 1200 1400 1600 2014 2015 2016 2017 2018 amount of 4.80% Senior Notes due March 1, 2026 (Appendix 2).
Debt/Equity ratio equaled 0.87, a decrease of 4% due to the increase in retained earnings in 2018.
For the past years, EA was able to accomplish a decrease of 36% in the debt-to-equity ratio, between 2014 and 2018 (Figure 42). The fiscal year 2017 was the turning point, as at this time they held more cash and cash equivalents than debt, supporting their growth through equity instead of debt. The issue of the two long-term senior notes in 2016 was the exception. EA´s net debt also presented a strong reduction in 2018, hitting USD 270 million (Figure 43). This was driven by the increase of cash and cash equivalents by 66%, as a result of the sales of short-term investments (Appendix 5).
Figure 42 | Debt-to-Equity Ratio Evolution | Left
axis in millions of U.S. Dollars | Source: Form 10-K
Figure 43 | Net Debt Evolution | Left axis in millions
of U.S. Dollars | Source: Form 10-K
1.36 1.01 1.08 0.90 0.87 0,00 0,20 0,40 0,60 0,80 1,00 1,20 1,40 1,60 500 1 000 1 500 2 000 2 500 3 000 3 500 4 000 4 500 5 000 2014 2015 2016 2017 2018 Total Equity Equity/Debt Ratio
0 1000 2000 3000 4000 5000 6000 2012 2013 2014 2015 2016 2017 2018 2019F 2020F 2021F 2022F 2023F Digital Forecast Digital
Packaged goods and others Forecast Packaged goods and others For our forecast, we have gathered historical data from 2012 to 2018. We
observed that there was a trend and we assumed that this trend would extend into to the future. In most of the cases we used linear regression, except for specific financial data which were more accurately forecasted using alternative methods.
Revenues
We forecasted the revenues by two main segments, digital and packaged goods and others (Figure 44), using linear regression based on the historical values from 2012 to 2018. Our forecast in the digital segment predicts a slowdown, that can be seen between 2018 to 2023 (+149%) In contrast, the packaged goods segment forecast predicts a decline from 2018 to 2023 (-53%).
Cost of Revenue
For the cost of revenue, we computed the compounded annual growth from 2012 to 2018, which implied a rate of -8%. Applying this rate would bring us to a more accurate forecast, better yet when considering individually the two segments of cost, by product and by service and other (Figure 45). On the product side, considering the past values from 2012 to 2018 (-60%), and applying our growth rate of -8%, we reached a forecast change, between 2018 and 2023, of -65%. This decline in the costs of product, mainly explained by the rise of the digital content, is balanced by the increase in costs of service and other, that we forecasted, from 2018 to 2023, to be +180%.
Gross Profit Margin
For the gross profit margin (Figure 46), it exhibits a slight increase from 2018 to 2023 of +3%, going from 75% to 78%, respectively. Despite of the slow increase, the company is still retaining a high amount of revenues after incurring the direct costs, which puts it above the average for the entertainment industry (42.47%).
Figure 44 | Forecast of Revenues by Segment (in
millions of U.S. Dollars) | Source: Form 10-K
Figure 45 | Cost of Revenues Forecast by Segment
(in millions of U.S. Dollars) | Source: Form 10-K
Figure 46 | Gross Profit and Gross Profit Margin
Forecast (in millions of U.S. Dollars) | Source: Form 10-K 0 200 400 600 800 1000 1200 1400 1600 2012 2013 2014 2015 2016 2017 2018 2019F 2020F 2021F 2022F 2023F Product Forecast Product Service and other Forecast Service and other
0% 10% 20% 30% 40% 50% 60% 70% 80% 90% 0 500 1000 1500 2000 2500 3000 3500 4000 4500 5000 2012 2013 2014 2015 2016 2017 2018 2019F 2020F 2021F 2022F 2023F Gross Profit Gross Profit Margin
20 373 3463 -500 0 500 1000 1500 2000 2500 3000 3500 4000 2011 2012 2013 2014 2015 2016 2017 2018 2019F 2020F 2021F 2022F 2023F 172 106 97 95 93 123 107 99 91 8478 72 0 20 40 60 80 100 120 140 160 180 200 2012 2013 2014 2015 2016 2017 2018 2019F 2020F 2021F 2022F 2023F Operating Expenses
Considering the historical values since 2012, research and development, marketing, sales and general expenses, are a constant proportion over the total net revenue. We assume the same trend for the next five years and computed as percentage of the total forecasted revenues (Appendix 1). The only exception is the amortization of intangibles, which would present negative values if this trend method was adopted. The forecast for the amortization of intangibles was calculated using the compounded annual growth rate, where we reach a value of -23%, that was prior applied for the future years.
Net Working Capital (NWC)
Regarding the net working capital, we have done our forecast considering a percentage of the total revenues, that was then extended to the future using a linear regression forecast (Figure 47). There were some cases where this forecast didn´t follow an accurate constant pattern, and for those cases this method was not adopted. This can be seen, on the current assets side as cash, accounts receivable, inventory and other assets that are expected to be liquidated or convert into cash in less than one year. On the current liabilities side, in accounts payable. The method applied to NWC is presented in detail in Appendix 4, with the assumptions being presented in Appendix 3.
Capital Expenditures (CapEx)
To forecast CapEx we computed the compounded annual growth rate from the historical figures, between the period 2012 to 2018. The CapEx will follow this trend and will continue decreasing for the years forecasted (Figure 48).
Figure 47 | Evolution of the NWC (in millions of U.S.
Dollars) | Source: Form 10-K
Figure 48 | CapEx Forecast by Segment (in