Universidade de Lisboa
Faculdade de Ciências
Departamento de Biologia Vegetal
Dissecting the functional role of PTEN proteins from
Physcomitrella patens
Rita Matos Catarino
Dissertação de Mestrado em Biologia Celular e Biotecnologia 2013
Universidade de Lisboa
Faculdade de Ciências
Departamento de Biologia Vegetal
Dissecting the functional role of PTEN proteins from
Physcomitrella patens
Rita Matos Catarino
Dissertation supervised by:
Drª Laura Saavedra (BioFig, Departamento de Biologia Vegetal, FCUL) Professor Rui Malhó (Departamento de Biologia Vegetal, FCUL)
Acknowledgments
First I would thank to Professor Rui Malhó for allowing me to work in such a great lab, with excellent people and with all I needed to develop my work. For transmitted confidence the help and understanding in a difficult time.
To Laura Saavedra for all the knowledge you gave me, for the guidance you gave me throughout the whole work, the patience. Thank you.
I would like to thank Fernando Vaz Dias, Susana Serrazina and Margarida Fortes for companionship and friendship that has always shown.
To Prof. Cláudio Soares for all the support and guidance.
To Prof. Octávio Paulo and to Dr. Luis Eduardo Del Bem for the guidance and kindness.
To Jorge, Margarida, Inês (Sancha), Inês (Concha) and Nuno for being my friends, for all patience, it was a great pleasure to spend this time with you! Thank you all.
To Marta for so many things, for all the help you gave me but primarily for the great person you are. Thank you for let me be your friend.
To my family. To my father for all the valuable teachings, to my mother for the love, support and understanding. To my sister for being my greatest love. I love you a lot.
Abbreviations
ABA – Absisic acidCBR – Calcium binding region
CI_VSP – Ciona intestinales Voltage Sensonr Protein CLS – Cytoplasmic localization signal
CTAB – Cetrimonium bromide DSB – Double strand break
DSP –Dual Specificity Phosphatases gDNA – Genomic DNA
GFP - Green Fluorescence Protein GT – Gene Trageting
HR – Homologous Recombination Kin – Knock In
KIn – Knock In KO – Knock out
Mbp – Million base pairs
mGFP - modified Green Fluorescence Protein mTOR – modified target of Rampamycin MYA – Million Years Ago
NHEJ – Non homologous end joining NO35 – Native overlap 3.5Ȧ
PCR – Polymorphism chain reaction PDB – Phosphatidylinsitol binding domain PEG – Polyethylene glycol
PH – Pleckstrin homology domain PKB – Protein Kinase B
PTEN - Phosphatase and TENsin homolog, deleted on chromosome 10 PTP – Protein Tyrosine phosphatase
tKO – triple Knock out
Tris – HCl – Tris Hydrochloride UTR – Untranslated region VSD – Voltage Sensor Domain WT – Wild type
Abstract
PTEN (phosphate and tensin homolog) are dual specificity phosphatases with both protein and phosphoinositide phosphatase activity. In animal cells, they hydrolyze PtdIns(3,4,5)P3, a potent
second messenger that modulates signaling pathways controlling cell division, cell size, angiogenesis and apoptosis. In addition, PTEN is a relevant gene in animal cells that is often lost in late-stage human tumors, especially those of the brain, prostate and endometrium. Interestingly, PtdIns(3,4,5)P3 is the only known phosphoinositide so far not detected in any
plant system, and the enzymes that synthesizes PtdIns(3,4,5)P3 in animal cells do not exist in
plants.
In this thesis, I have studied PTEN genes in the moss Physcomitrella patens which has emerged as a model system in the last years due to its high frequency of homologous recombination allowing to study functional genomics by gene targeting. In additions, P. patens diverged from the lineage leading to flowering plants 450 million years ago, a feature that places mosses at an evolutionary position that is ideal for comparative studies of the evolution of biological processes in land plants.
P. patens genome contains four PTEN genes, named PpPTENA, PpPTENB, PpPTENC and PpPTEND. PpPTEN proteins present the typical organization of PTENs with an N-terminal PTP domain (Protein Tyrosine Phosphatase) and a C-terminal C2-domain.Through protein modeling studies I show that PpPTENA and PpPTEND share high degree of structure similarity with CI_VSP (Ciona intestinales voltage sensor protein) a protein that harbors a transmembrane voltage sensor domain and a cytoplasmic PTEN domain. PpPTENs PTP domain presents the typical catalytic loops seen in the majority of PTENs but their C2 domain is markedly different. In terms of sequence comparison several differences are observed between PpPTENs and HsPTEN, being of main interest differences in the catalytic domain.
I characterized a triple ptenb&c&d knockout line and results show that knockout moss plants produced more rhizoids and gametophytes, there is an earlier transition form the protonema juvenile stage to the gametophytic stage and interestingly chloronema and caulonemal cells have a higher growth rate compared to the WT.
By using a knock in approach, I have obtained a PpTENB-GFP line to study its localization, revealing that PpPTENB is mostly localized in young growing cells such as chloronema, caulonemal but was well as in the tip of rhizoids.
Resumo
As proteínas PTEN (‘Protein Tensin Homologue deleted from chromosome 10), identificada primeiramente em Humano são fosfatases com capacidade de desfosforilar outras proteínas mas também fosfolípidos. Estas proteínas estão envolvidas na modulação de vias de sinal que regulam vários processos celulares como o crescimento, metabolismo ou processos de apoptose estando implicadas no aparecimento de várias doenças humanas, como por exemplo o desenvolvimento de tumores. Neste trabalho fiz a caracterização preliminar de quatro isoformas desta proteína, denominadas PpPTENA, PpPTENB, PpPTENC e PpPTEND, identificadas em Physcomitrlle patens. PpPTENs apresentam a organização estrutural típica das PTEN, com um domínio PTP (‘Protein Tyrosine Phosphatase’) N-terminal e um domínio C-terminal denominado C2. Recorrendo à modelação de proteínas foi-me possível demontrar que as PpPTENA a PpPTEND partilham um elevado grau de semelhança estrutural com a preteína CI_VSP (C. intestinales Voltage Sensor Protein) que apresenta um domínio transmembranar ‘Voltage Sensing’ e um domínio PTEN citoplasmático
O mutante ‘knock out’ para PpPTENB,PpPTENC e PpPTEND (ptenb&c&d) revelou a produção de filamentos de caulonema mais longos, a produção de mais rizoides por gametófito e também uma taxa de crescimento das células do protonema marcadamente mais celerada, o que está de acordo com o demonstrado em células animais. Com a obtenção de um mutante ‘knock in’ para a proteína PpPTENB (PpPTENB_GFP) foi-me possível avaliar a sua localização ‘in vivo’ que revelou uma predominância desta proteína em células jovens do cloronema, caulonema e também dos rizoides.
Table of contents
Chapter 1. ... 3
Introduction ... 3
1.1 The moss Physcomitrella patens ... 3
1.1.1 Position of bryophytes in evolution ... 3
1.1.2 Physcomitrella patens life cycle. ... 4
1.1.3. Features of Physcomitrella patens for considering it a model organism ... 5
1.2 Phosphatase and TENsin homolog (PTEN) genes ... 9
1.2.1 PTEN in animal cells ... 9
1.2.2 PTEN in plant cells ... 11
Chapter 2. ... 13
Materials and Methods ... 13
2.1 Sequence analysis and phylogeny. ... 13
2.2 Plant material and growth conditions. ... 13
2.3 Generation of knock In constructs for P. patens transformation. ... 13
2.4 P. patens transformation by PEG mediated DNA delivery. ... 14
2.5 Genotyping of knock In mutants. ... 15
2.6 Phenotypical analysis of knock out mutants. ... 16
Chapter 3. ... 17
Results ... 17
3.1 Four PTEN genes are present in the P. patens genome ... 17
3.2 Protein Modeling ... 21
3.3 Triple pten b&c&d knock outs show enhanced rhizoid production and earlier gametophyte development. ... 24
3.4 Triple pten b&c&d knock outs have longer caulonemal filaments when grown in the darkness. ... 27
3.5 Triple pten b&c&d knock outs caulonemal and chloronemal cells grow faster. ... 29
Chapter 4. ... 33
Discussion ... 33
4.1 PpPTENs show several differences with animal PTENs. ... 33
4.2 A triple pten knock out line suggests PTEN as a suppressor of growth. ... 37
4.3 PpPTENB is distributed in the cytosol and the nucleous, being mainly expressed in caulonemal and rhizoids ... 38
4.5 A possible physiological role for PpPTEN ... 39 Chapter 5. ... 43 Future Perspectives ... 43 References ... 44 Appendix 1 ... 48 Appendix 2 ... 49
Chapter 1.
Introduction
1.1 The moss Physcomitrella patens
1.1.1 Position of bryophytes in evolution
Bryophytes were the first land plants to conquer the Gondwana continent, 475 MYA, during the Ordovician period, which might explain its broad distribution (Wellman et al., 2003). Bryophytes developed from an ancestor most closely related to modern green algae (Lewis and McCourt, 2004), and after making the transition onto land the early land plants diverged into lineages adapting to the different habitats of the terrestrial environment. Moving from the aquatic to the terrestrial environment led to many fundamental changes. Drought, UV-light exposure and changing temperatures are among the major environmental differences that required adaptations. Mosses and seed plants shared their last common ancestor at least 420 MYA (Raven et al., 2004; Clarke et al., 2011), making the evolutionary distance between Physcomitrella and Arabidopsis similar to that of fishes and humans (Hedges, 2002). Fossil records showed that the macro morphology of extant mosses appears unchanged since the earliest preserved fossil records from 320 MYA (Hubers and Kerp, 2012).Bryophytes are composed by three different phylus (Fig. 1), phylum Hepatophyta (liverworts), phylum Antocerophyta (Hornworts) and phylum Bryophyta (Mosses).
Figure 1. Phylogenetic relationships between green algae, bryophytes and vascular plants (Rensing et al.,
They most often grow in moist locations in temperate and tropical forests or along the edges of wetlands and steams, however they are not confined to these habitats, many species of mosses are found along the boreal forest or in relatively dry deserts. They have a broad geographical distribution which indicates repeated intercontinental dispersal, or ancient distributions (Clarke et al., 2011).
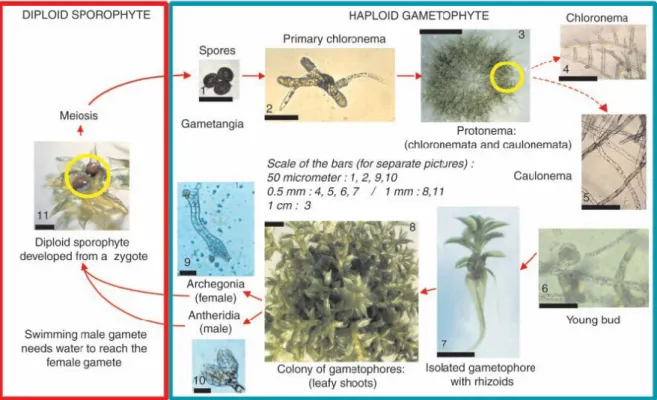
1.1.2 Physcomitrella patens life cycle.
Mosses are distributed among three classes: Sphagnidae, Andreidae and Bryidae. Physcomitrella patens (true mosses), the moss we have used as a model system in this thesis, belongs to the Bryidae class. Like other mosses, P. patens have a simple plant architecture, it has a haplodiplont life cycle with dominance of the haploid phase constituted by the vegetative gametophyte and a diploid sporophyte which is anatomically reduced and dependent on the gametophyte.
Once the haploid spores germinate, the first cells to develop are chloronema cells (Fig.2, 2 e 4) that have approximately 100 µM length with cross walls perpendicular to the axis of growth and contains several well developed chloroplasts. These cells have a growth rate around 5.85 µm/h and divide every 24 h, being arrested at the G2 state most of the time of the cell cycle (when grown in a photoperiod of 16 h light 8h dark those cells are at the G2 state during the day and divide around 2 – 4 a.m.) (Reski, 1998; Cove, 2000). Caulonema cells (Fig.2, 5) have between 200-250 µm length, have fewer chloroplasts and the cross walls are oblique to the cell axis. Their growth rate is about 20 µm/h and the cells divide every 7 h, being mostly in the G1 phase of the life cycle (Reski, 1998; Menand et al., 2007). The juvenile protonema is composed by chloronema and caulonema cells, both displaying a characteristic one-dimensional filamentous growth by apical growth (Fig.2) (Cove, 2005). Caulonema cells are able to produce the ‘three face cell’ bud (Fig.2, 6) that will differentiate into gametophores. The gametophore (Fig.2, 7) or leafy shoot develops in a three dimensional manner and is composed by a one cell layer thick leaves. The adult leaves present a midrid, a central structure composed by adaxial and abaxial cells, hydroids (water conducting cells) and leptoids (sieve conducting cells), which resembles an incipient vascular system, and by multicellular rhizoids. Those structures are not considered a real conducting system since they are not lignified, bryophytes do not produce lignin.
P. patens is a monoicious species, bearing both archegonia and antheridia (Fig.2, 9 and 10) on the same gametophyte and therefore, self-fertilization is a common occurrence. The zygote develops into the sporophyte, the structure that represents the diploid phase, and which depends on the haploid phase to survive. The sporophyte consist of a short seta bearing a spore capsule that when mature could contain around 4000 spores (Reski and Cove, 2004).
Figure 2. Physcomitrella patens life cycle. (Schaefer and Zryd, 2001).
1.1.3. Features of Physcomitrella patens for considering it a model organism
A major goal of modern biology is to understand the relationship between biological systems and the presence and activity of genes. Model systems of biology have provided both the experimental material and the biological context for framing questions that explore this relationship. The investigator’s ability to use several different model systems allows the function of related genes to be tested in a variety of biological and/or methodological contexts. Genomics, along with the conservation of gene structure and function found among diverse organisms, represents a “golden thread” that links model systems and allows the comparison between them. Several strategies have been applied to identify new genes and decipher protein function in plants. The most basic approach is sequence comparison of a gene or a protein with existing databases. Homology to another protein whose function has been previously established can provide important clues about cellular function and biochemical properties. However, this is a descriptive approach and don´t tell what function a gene performs in a cell or in an organism. The most widely used approach for performing functional genomics has been insertional mutagenesis. Insertional mutagenesis by transgenesis and the phenotypic and molecular characterization of tagged mutated lines has been used extensively to study plant gene function. Nonetheless, insertional mutagenesis has several conceptual
disadvantages: (a) It is based on random integration of tags in the genome and thus can only generate stochastically distributed allelic mutations in the genome; (b) it requires the generation of large numbers of transformants to saturate the genome with tags; (c) it only identifies detectable viable phenotypes and does not generate conditional mutations, which is a prerequisite for the identification and the characterization of essential genes; (d ) the identification of the tagged mutant or gene can be very difficult and time consuming because multiple insertion or major chromosomal rearrangements can be associated with the insertion of the tag; and (e) it does not enable the generation of specific point mutations in a gene, which is a prerequisite for detailed functional analysis and for generating an allelic series of mutations within a specific gene that allow a full range of possible phenotypes to be explored (Lodish et al., 2004). Those approaches and observations can be circumvent by using gene targeting (GT). GT is the generation of specific mutations in a genome by homologous recombination-mediated integration of foreign DNA sequences being a pre-requesite to reverse genetics, i.e. for gene disruption or allele replacement. With such approaches, virtually any gene, even with unknown function, can be specifically mutagenized in vitro and reintroduced to its own chromosomal location in order to study its function (Schaefer and Zryd, 1997; Aylon and Kupiec, 2004).
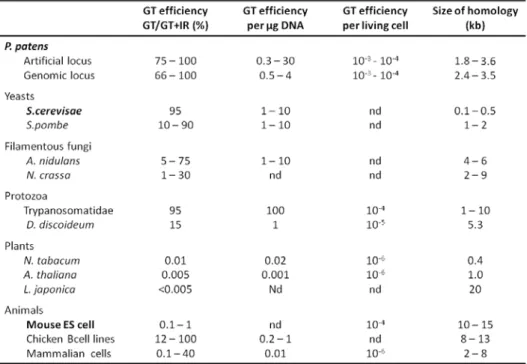
The moss Physcomitrella patens deserved particular attention from researchers, because besides the simplicity of its life cycle and morphology, the fact that very simple growth conditions are required for the completion of its life cycle, it is possible to perform gene targeting with a high efficiency (Table 1). In GT experiments, the transforming DNA carries a mutated allele of the gene of interest along with a selectable marker. The homologous fragment targets the transforming DNA to the corresponding chromosomal locus where it integrates by homologous recombination (HR), resulting in either gene knock-out by insertion or point mutations by gene conversion (Simon and Moore, 1987). Schaeffer and his coworkers (Schaefer et al., 1991; Schaefer and Zryd, 1997) observed through sequential transformation of P. patens that the resulting transformed plants almost always displayed a very close genetic linkage of the two resistance transgenes. These genetic data suggested that the second plasmid integrated at the previously generated artificial locus by HR, providing the first evidence for efficient GT in P. patens. Several research groups did transformation experiments using cloned P. patens genomic sequences which confirmed the hypothesis of GT leading to the conclusion that the integration of foreign DNA sequences into the genome occurs predominantly at targeted locations by HR (Schaefer et al., 1994; Kammerer and Cove, 1996). Although GT is the standard method for the study of functional genetics in microbiological systems such as bacteria, yeast and some filamentous fungi, it can be applied to higher eukaryotic model systems only rarely. This is because the frequency of integration at random locations by illegitimate recombination (IR) in higher eukaryotes is several orders of magnitude higher than that of targeted integration by HR (Table 1).
Within higher eukaryotes the notable exceptions are mouse embryonic stem cells in mammals and P. patens in whole plant kingdom (Muller et al., 1999; Vergunst and Hooykaas, 1999).
Table 1. Comparison of gene-targeting efficiencies in P. patens, yeast, fungi, plants and animals. Modified from
Schaeffer (Schaefer, 2001).
Integration of foreign DNA sequences in the genome by HR or IR seems to be tightly correlated with the dominant pathway used by the cells to repair DNA double-strand breaks (DSB). These processes were well characterized using Sacharomyces cerevisae (Simon and Moore, 1987; Langston and Symington, 2004). In S. cerevisae DSB repair by HR is the predominant mechanism whereas double-strand break repair by non homologous end joining (NHEJ) is a minor pathway (Simon and Moore, 1987). In the case of P. patens it was not clarified why HR is the predominant way of foreign DNA integration. Two hypotheses were proposed to explain the high frequency of GT by HR in P. patens. One hypothesis says that the high ratio of GT may be correlated with the predominance of the gametophytic haploid phase in the life cycle of Bryophytes (Schaefer, 2002). This hypothesis is based on the observation that a ratio of targeted to random integration events above 1% seems to be restricted to primitive and/or haploid eukaryotes, such as protozoa, yeast, some green algae and filamentous fungi. Yet this is not supported by S. cerevisae which is naturally diploid but is supported by the fact that in haploid organisms DSB repair has to be done by HR in order to maintain the integrity of the genome. The other hypothesis, proposed by Reski (Reski, 1998) is based on the observation that P. patens chloronemal cells, from which protoplasts are isolated for transformation experiments, divide synchronously every 24 hours and are arrested for most of the day at the G2→M
boundary. There are several data that argues against and in favor of this hypothesis but experiments conducted in S. cerevisiae have not shown any correlation between GT efficiency and cell cycle stages. For instance, in S. cerevisae DNA DSB repair by NHEJ in the G1 phase have an accentuated reduction (100-fold), which results in an increase in DSB repair by HR. In vertebrate cells, HR contributes to DSB repair predominantly during S→G2 interphase and NHEJ is the dominant pathway during G1/early S phase. The determination of a correlation between GT efficiency and cell cycle stages could be very important once the interveners in both NHEJ and HR are very similar between yeast, filamentous fungi, mammals and plants and could establish an approach that allows to obtain GT with higher efficiencies.
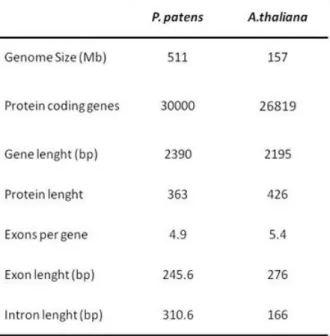
In addition to the high frequency of HR, there are other important features which allows to use P. patens as a model system. When P. patens gene sequences are compared with their homologues from higher plant they share between 48% and 75% of homology regardless whether the higher plant is a gymnosperm, a monocot or a dicot. Also the promoter usage and codon usage are very similar to those in higher plants (Reski, 1998). A. thaliana has been the most widely used model organism for biological studies in plants. Although P. patens exhibits a structural complexity that is apparently less than that of a flowering plant, it does not have a particularly small genome (Table 2).
Table 2. Genome comparison between P. patens and A. thaliana from TAIR database (www.arabidopsis.org).
P. patens genome size is 490 Mbp DNA, approximately three times bigger than that of A. thaliana. P. patens protein-encoding genes are ~30 000, being in the same range as those of morphologically more complex organisms. This observation indicates that the P. patens gametophytic transcriptome
is substantially similar to the A. thaliana genome and that there is a number of A. thaliana genes that has homologues in P. patens (Table2). Although the genome sequence has been largely determined, the functions of many of the predicted genes are still unknown. Because GT is feasible in P. patens, functional analyses of the homologues in P. patens should increase our understanding of gene function in flowering plants.
Despite the distance in evolution between higher plants and mosses, the perception and signal transduction mechanisms triggered by environmental signals such as the light, drought or salt stress and hormones such as abscisic acid (ABA) or auxin has been shown to be preserved. Phototropic responses, which are implicated in the light-associated signal transduction network, have also been reported to be conserved in mosses (Reski, 1998; Rolland et al., 2006).
1.2 Phosphatase and TENsin homolog (PTEN) genes
1.2.1 PTEN in animal cells
PTEN (Phosphatase and TENsin homolog, deleted on chromosome 10) was first identified as a tumor suppressor gene by mapping homozygous deletions on human chromosome 10q23.3 (Myers and Tonks, 1997). Mutation of the tumor suppressor PTEN is a common event in diverse human cancers, occurring in about 50% of glioblastoma, endometrial carcinoma, prostate carcinoma, and melanoma cases (Li et al., 1997; Teng et al., 1997). In addition, germline mutations in PTEN give rise to Cowden disease and with the dominantly inherited Bannayan–Zonana syndrome which are typified by the formation of multiple benign tumors and an increased susceptibility to malignant cancers (Liaw et al., 1997; Marsh et al., 1997; Nelen et al., 1997).
PTEN is classified as a member of the Dual-Specificity Phosphatases (DSP) enzymes, due to its ability to dephosphorylate serine/threonine and tyrosine residues (Myers and Tonks, 1997). PTEN protein structure is characterized by an N-terminal Protein Tyrosine Phosphatase (PTP) domain containing the highly conserved catalytic signature motif HCXXGXXR and a C2 domain at the C-terminal region, domain which is less conserved among the different PTEN members. The C2 domain is similar to the PLCδ or PKCδ C2 domain which can bind Ca2+ through three loops (CBR1, CBR2 and CBR3 loops) (Rizo
and Sudhof, 1998), and has been implicated in mediating and regulating PLC membrane association (Essen et al., 1997; Sutton and Sprang, 1998). The PTEN C2 domain differs from these C2 domains because it has only the CBR3 loop and it has been suggested that the absence of the other two CBR loops would probably prevent Ca2+ binding (Lee et al., 1999).
Due to the high sequence similarity to DSP’s, researchers believed that the preferred substrates of PTEN proteins were serine, threonine and tyrosine phosphorylated residues. However, it was
observed that PTEN is a poor catalyst towards both, phosphoproteins and peptide substrates, with the highest activity of PTEN observed towards the highly negatively charged, multiply phosphorylated polymer of (Glu-Tyr)n (Li et al., 1997; Myers et al., 1998) . In 1998, Maehama and his colleagues showed that the highest catalytic activity of PTEN was against phosphatidylinositol phosphates, particularly phosphatidylinositol 3,4,5 trisphosphate (PtdIns(3,4,5)P3) where
dephosphorylation occurs at the D3 position of the inositol ring producing phosphatidylinositol 4,5 bisphosphate PtdIns(4,5)P2 (Fig. 3) antagonizing the phosphatidylinositol 3-kinase (PI3K) signaling
pathway (Maehama and Dixon, 1998)
Phosphoinositides (PIs) are key second messengers for intracellular signaling involved in several crucial processes of the cell, like as cell growth and proliferation, cytoskeleton organization, vesicle trafficking, chemyotaxis and nuclear signalling pathways in eukaryotic cells (Balla et al., 2012). Their structure consists of a glycerol backbone esterified to two fatty acyl chains and a phosphate to which a cyclic myo-inositol head group with five free hydroxyl groups is attached (Fig. 3). There are seven combinations of PIs that can be generated through phosphorylation of one or more positions on the inositol head group: PtdIns3P, PtdIns4P, PtdIns5P, PtdIns(3,4)P2, PtdIns(3,5)P2, PtdIns(4,5)P2, and
PtdIns(3,4,5)P3. Thus far, all of these PI species have been observed in plants, with the exception of
PtdIns(3,4,5)P3 (Mueller-Roeber and Pical, 2002).
Figure 3. Substrates, products, and activities of identified phosphoinositide lipid kinases in animal and plant
cells. The kinases catalyzing each reaction are numbered with names indicated at top left of figure. Modified from (Gonzales and Anderson, 2006). Some of the acyl chains have been shortened to save space.
PIs constitute up to 4% of the total membrane phospholipids and are located at the inner leaflet of biological membranes (Okamura and Dixon, 2011).
Dephosphorylation of PtdIns(3,4,5)P3 by PTEN plays a critical role in the regulation of diverse
biological events in particular cell growth. PtdIns(3,4,5)P3 activates through phosphorylation PKB/Akt
promoting survival signals involved in the G1/S cell cycle transition (Radu et al., 2003). PTEN exerts its tumor suppressor function through the dephosphorylation of PtdIns(3,4,5)P3 diminishing the
amount of phosphorylated PKB/Akt which promotes cell cycle arrest at the G1 phase, the relation between PTEN and cell growth suppression was unequivocally demonstrated using carcinoma cell lines (Radu et al., 2003) .
1.2.2 PTEN in plant cells
PTEN genes have been studied in several organisms such as human, mouse, fruit fly and yeast but very little is known about PTEN in plant cells. The first PTEN genes described in plants were those of A. thaliana. A. thaliana has three PTEN isoforms: AtPTEN1, AtPTEN2a and AtPTEN2b (Gupta et al., 2002; Pribat et al., 2011). The three isoforms were partially studied and researchers shown that recombinant AtPTEN1 has activity towards PtdIns(3,4,5)P3 in vitro, similar to HsPTEN (Gupta et al.,
2002). Recombinant AtPTEN2a and AtPTEN2b dephosphorylates mainly PtdIns3P, PtdIns(3,4)P2 and
PtdIns(3,5)P2, being AtPTEN2a the most active isoform with highest activity towards PtdIns3P (Pribat
et al., 2011).
Regarding their physiological function in plant cells much less is known. Gupta and his colleagues (Gupta et al., 2002) have shown that AtPTEN1 strongly affects pollen viability when inactivated by RNAi silencing, and suggested that AtPTEN1 may not function in cell cycle regulation as PTEN does in animals since its activity is only detected in a late phase of pollen maturation (long after mitosis). In the P. patens genome four PTEN genes were identified using the Phytozome V9.0 (http://www.phytozome.net/) hereafter PpPTENA, PpPTENB, PpPTENC and PpPTEND. The protein sequences are very similar among them (see Results) and contain the conserved phosphatase and C2 domains characteristic of PTEN proteins. Although both Ser/Thr and Tyr phosphorylation play a crucial role in cellular regulation in animal systems, only Ser/Thr phosphorylation has been established as an important regulatory mechanism in plant cells. Indeed, a large number of Ser/Thr kinases and phosphatases have been identified and shown to be important in various processes of plant growth and development (Sugden et al., 1999; Huang et al., 2000). In plant cells, PtdIns(3,4,5)P3 was never detected and the enzyme responsible for its synthesis, class I PI3K, has not
been found in any plant genome. Therefore, the dual specific nature of PTEN and the absence of PI(3,4,5)P3 in plant cells raises the questions: which is the natural substrate of PTEN in plants? Which
are the processes regulated by this protein?
The objectives of this work were:
a) To obtain a protein model for PpPTENA and PpPTEND
b) To characterize phenotipically a P. patens pten triple knock-out mutant in order to contribute to address the functional role of PTEN in plants.
c) To generate a stable PpPTENB-GFP Knock In transformant line in P. patens to study PpPTENB subcelular localization and its localization in the different developmental stages of the moss life cycle.
Chapter 2.
Materials and Methods
2.1 Sequence analysis and phylogeny.
Coding sequences from the gene model databases of A. thaliana and P. patens were retrieved from Phytozome v8.0. Ascension numbers of are PpPTENA (Pp1s172_76V6.1), PpPTENB (Pp1s121_98V6.1), PpPTENC (Pp1s465_11V6.1) PpPTEND (Pp1s71_302V6). A. thaliana PTEN genes ascension numbers are At5g39400 (AtPTEN1), At3g19420 (AtPTEN2a) and At3g50110 (AtPTEN2b). Sequences were aligned using MEGA (v5.2) and Mafft (Mafft v7). The evolutionary history was inferred using the Neighbor-Joining (NJ) method and Maximum Likelihood (ML). The bootstrap consensus tree was inferred from 250 replicates in both cases. Support of internal nodes was assessed using bootstrap analysis of 250 replicates. r Joining. ML analysis was first conducted using MEGA (V5.2). The data matrix was analyzed with heuristic search and the default search options.2.2 Plant material and growth conditions.
The Gransden wild type strain of Physcomitrella patens was used for these studies. For phenotypical analysis the tissue was grown in 90 cm Petri dishes in minimal medium (ppNO3) containing 0.8 g/L CaNO3.4H2O, 0.25 g/LMgSO4.7H2O, 0.0125g/L FeSO4.7H2O, 0.055 mg/L CuSO4.5H2O, 0.055 mg/L ZnSO4.7H2O,0.614 mg/L H3BO3, 0.389
mg/L MnCl2.4H2O, 0.055 mg/L CoCl2.6H2O, 0.028 mg/L KI, 0.025 mg/L Na2MoO4.2H2O, 0.25 mg/L
KH2PO4 buffer pH 7 and agar 7 g/L. For weekly tissue propagation and generation of tissue for
transformation, tissue was grown in 90 cm Petri dishes over cellophane discs in ppNO3 medium supplemented with 0.5 g/L Di-ammonium tartrate (ppNH4 medium). Cultures were grown at 25ºC and with a photoperiod of 16 h light and 8 h dark and a quantum irradiance of 55 μE m–2 s–1.
For dark growth experiments, small pieces of 1mm moss tissue were grown in ppNH4 supplemented with 10% (m/v) sucrose at continuous light (55μE m–2 s–1) during 10 days and then grown for three
weeks in the dark.
In this study two stable triple pten knockout mutants lines for PpPTENB, PpPTENC and PpPTEND were used, tKO#34 and tKO#35 (Saavedra, L. unpublished data).
2.3 Generation of knock In constructs for P. patens transformation.
For the generation of knock in constructs the Multisite Gateway® (Invitrogen) technology was used. First, sequences of interest were amplified from P. patens genomic DNA. Entry vectors containing the 5´ and 3´ end genomic sequences for the four PTEN genes, vectors containing the enhanced green fluorescentprotein (eGFP) and the hygromycin resistance cassette, and destination vector for knock in of PpPTENB and PpPTENC were already performed (Saavedra, L. unpublished data). For the generation of knock in vectors for PpPTENB and PpPTENC the four entry vectors (1st position- 5gPTEN, 2nd
position-eGFP, 3rd position- hygromycin cassette and 4th position- 3gPTEN) were introduced into the
pGEM destination vector using Clonase II plus (Invitrogen) according to manufacturer instruction manual. A general scheme of this process is represented in Fig 4. The resulting plasmids for the knock in of PpPTENB and PpPTENC are represented in Fig.5. The resulting plasmids were sequenced to ensure that the four fragments were in the right position without sequencing mistakes resulting from the genes amplifications.
Figure 3. MultiSiteGateway®Pro. Schematic Representation of 4-Fragment Recombination
2.4 P. patens transformation by PEG mediated DNA delivery.
Protoplast transformation was performed according to (Schaefer and Zryd, 1997) protocol. Briefly, 6 day old tissue grown in ppNH4 media over cellophane was used for the generation of protoplasts. The tissue of two plates was incubated at 25ºC during 1 h at 50 rpm with 10 mM driselase and then washed three times with 8.5% mannitol. Protoplasts were then resuspended in MMM solution (Mannitol, MgCl2 and MES) to a final concentration of 1.6x10⁶ pp/mL. For each transformation reaction 300 µl of protoplasts were mixedwith 15-20 µg DNA which was previously linearized with SwaI (New England Biolabs) and 300 µl of PEGT solution was used to facilitate the DNA entry. Protoplasts were then plated in regeneration medium (ppNH4 with 8.5% (w/v) Mannitol) for five days and then transferred to selection media,
ppNH4 plus hygromycin (25 μg/mL) for 15 days. After this first round of selection, protoplasts were transferred to non selective media ppNH4 for 10-15 days, and then a second selection round was performed in hygromycin for additional 10-15 days.
2.5 Genotyping of knock In mutants.
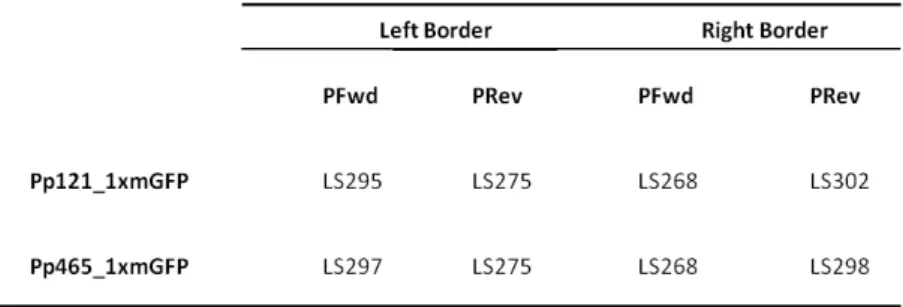
The putative transgenic moss lines growing on selection media after two rounds of selection were then used for PCR screening. Moss putative transformants were first frozen in liquid N2 and macerated. Then 300 µL CTAB buffer (2% CTAB, 100 mM Tris-HCl pH8.0, 20 mM EDTA, 1.4 M NaCl) were added and incubated for 30 min at 65ºC. After, 300 µL of chloroform were added and the mixture was vortex and centrifuged at maximum speed (13.200 rpm) for 2 minutes. The upper water soluble phase was then mixture with 300 µL isopropanol to precipitate the DNA and left for 30 minutes at -20ºC. A new centrifugation step at maximum speed (13200 rpm) for 15 minutes was then performed. The pellet was washed with 70 %(v/v) ethanol and resuspended in 30 µL of TE buffer (10 mM Tris, 1 mM EDTA pH 8.0 ). Transgenic plants were then genotyped by PCR using ‘outward-pointing’ primers specific to the reporter gene GFP (LS275) and to the Hygromycin selection cassette (LS268) in combination with ‘inward-pointing’ 5’- and 3’-gene specific primers corresponding to sequences external to the targeting construct as illustrated in Fig. 5. All different transgenic plants were genotyped through this approach. The primers used for genotyping the different transgenic plants are is shown in Table 3 and the sequences of those primers as shown in Table 4.
Figure 5. Schematic representation of KnockIn constructs. Grey boxes represents genomic sequences, white
boxes with black lines represent the sequence homolog to gDNA of our construct, black box represents the sequence of our resistance cassette (hygromicyn) and the white box represents the sequence of our reporter gene (mGFP – modified Green Fluorescence Protein). gDNA genomic DNA; ATG – start codon; TAA – stop codon; UTR – untranslated region.
Table 4. Primers used for genotyping Knock In mutants. Pp121_1xmGFP (PpPTENB_GFP); Pp465_1xmGFP
(PpPTENC_GFP).
2.6 Phenotypical analysis of knock out mutants.
For phenotypical analysis tissue was grown in ppNO3 medium under a photoperiod of 16 h light and 8h dark as already described. To determine rhizoid number, gametophytes of 15-day old tissue with 3,4, 5, 6 and 7 leaves were used. Rhizoid length measurements were done in gametophytes of the same age. To determine gametophyte number, protonema pieces of approximately 1 mm were grown in ppNO3 media and weekly gametophyte counting was performed during a period of three weeks. The above mentioned measurements were done using a stereoscope (Nikon SMZ645) and pictures were taken with an Olympus camera (Olympus Camedia c-5050). Rhizoid cell length determinations were done using 15-day old gametophytes collected from colonies grown under the conditions described above. For these observations we used Olympus IX70 microscope and images were captured with Sensicam QE. For dark growth experiments, 1 mm pieces of moss tissue were cultured for 10 days in ppNH4 plus 2%(m/v) sucrose at continuous light. Plates were then grown in darkness positioned vertically for 3 weeks.For cell growth rate measurements protonema tissue was diluted 1/20 in water and was grown on ppNO3 media. Tissue of 4 to 7 days old was used for measurements. The growth of single apical protonema cells (chloronema and caulonema) was followed during 2 h and 30 minutes by taking pictures every 30 minutes using an Olympus IX70 microscope and a CCD camera (Sensicam QE). Cell length measurements were performed on three-first subapical cells of 6 day-old protonema grown in ppNO3 under a photoperiod of 16 h light 8 h dark. Pieces of tissue were stained with 10 µg/ml fluorescence brightener 28 (Sigma) in an eppendorf tube for 10 minutes and then washed twice with water. Tissue was then observed under UV light and images were taken using a Olympus BX60 microscope and. a Olympus DP50 camera.
All images were analyzed using the ImageJ software (http://rsbweb.nih.gov/ij/) and Microsoft Excel™ was used for statistical analysis; statistical significance tests were calculated by t-test.
Chapter 3.
Results
3.1 Four PTEN genes are present in the P. patens genome
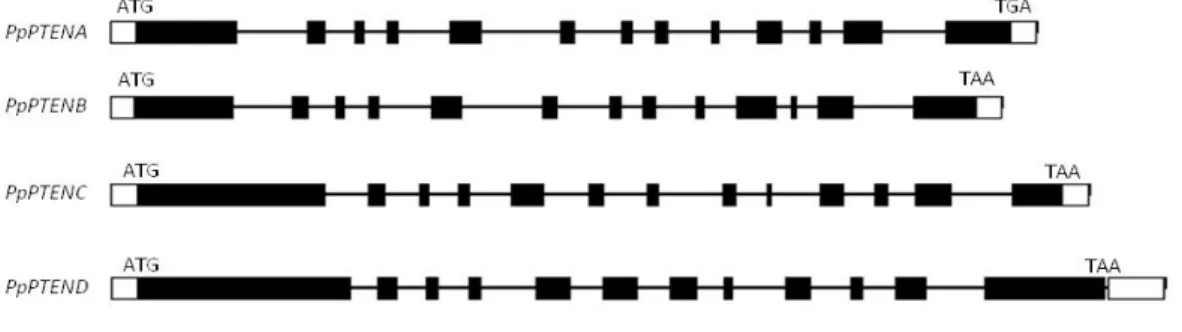
Using human PTEN (HsPTEN) as query, four PTEN homologues were identified in the P. patens genome (http://www.phytozome.net). PpPTENA, PpPTENB, PpPTENC and PpPTEND genes are composed of 13 exons and 12 introns with the exception of PpPTEND gene which is composed of 12 exons and 11 introns (Fig. 6). PpPTENA, PpPTENB, PpPTENC and PpPTEND genes encode putative proteins of 662, 658, 756 and 902 aa respectively, which are larger than all PTENs previously described. The comparison between PpPTEN and AtPTEN genomic sequences revealed that PpPTENs are very similar to AtPTEN2a and AtPTEN2b, being AtPTEN1 less related (Appendix 1). Particularly, AtPTEN2a and AtPTEN2b encode proteins with 611 and 632 aa, respectively, which places it within the range of PpPTENA and PpPTENB.
Figure 6. Organization of PpPTENA, PpPTENB, PpPTENC and PpPTEND. Boxes indicate exons, in black the coding
sequence is represented and in white the untranslated region is represented. Lines represent introns. The translation start codon (ATG) and stop codon (TGA) are indicated.
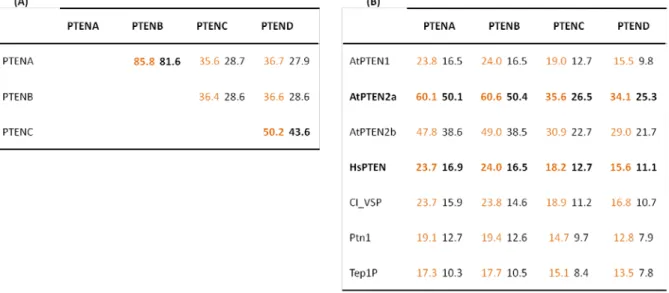
For a more accurate analysis of the protein sequences of PpPTENs a matrix of similarity and identity was built (Table 5). As shown in Table 5 (A), PpPTENA and PpTENB present high homology, with an identity of 81.6%. When compared with PpPTENC and PpPTEND the percentage of identity decreases markedly being only 28.7% between PpPTENA and PpPTENC and 27.9% between PpPTENA and PpPTEND. The percentage of identity between PpPTENC and PpPTEND is of 43.6%. To further analyze these sequences a matrix of similarity and identity was built comparing PpPTENs with PTENs from other organisms (Table 5B). Not surprisingly the highest values of similarity and identity were
obtained among PpPTENs and AtPTENs. AtPTEN2a presents an identity of 50.1% with PpPTENA and 50.4% with PpPTENB. These values are higher than the identity values obtained between PpPTENA and PpPTENC or PpPTEND, or between PpPTENB and PpPTEND (Table 5 A).
Table 5. Sequence comparison between (A) PpPTENs and (B) between PTEN homologues. Orange - % similarity;
Black - % identity.
From the comparison of P. patens PTENs with HsPTEN similarity values obtained were 23.7% and 24% for PpPTENA and PpPTENB, respectively, and 18.2% and 15.2% for PpPTENC and PpPTEND respectively. These results indicate that this protein suffered a considerable evolution besides its apparent central role in metabolic regulation.
In order to get more insights into the evolutionary relationship between PTEN proteins, a phylogenetic analysis was performed using the Maximum Parsimony Method with PAUP (Fig. 7). In this study sequences from S. moellendorffii and P. patens as examples of bryophytes were used. From Traqueophytes, sequences representing Angiosperms were selected from O. sativa and S. bicolor as Monocotiledons, and from A. thaliana, P. trichocarpa and V. vinifera as Dicotiledons. Sequences from C. reinhardtii and V. carteriwere were also used. From animalia we used sequences from D. melanogaster, C. intestinals and H. sapiens. It is possible to observe the significant difference between PTEN from animals and plants. The plant PTENs are clustered into three distint groups: one harbors PTEN sequences from green algae and S. moellendorffii, the other group harbors P. patens sequences, most of the S.moellendorffii PTEN sequences and also O. sativa and S. bicolor. The majority PTEN sequences from dicotiledons are grouped together composing the third group of plant
PTENs. In the case of P. patens, the four PTEN sequences are grouped in two different clusters, one composed by PpPTENA and PpPTENB and other composed by PpPTENC and PpPTEND, the proximity of those clusters are in agreement with a recent duplication of the P. patens genome (Rensing et al., 2008).
Figure 7. Evolutionary relationships of taxa The evolutionary history was inferred using the Neighbor-Joining
method. The bootstrap consensus tree inferred from 250 replicates is taken to represent the evolutionary history of the taxa analyzed. Branches corresponding to partitions reproduced in less than 50% bootstrap replicates are collapsed. The percentage of replicate trees in which the associated taxa clustered together in the bootstrap test (250 replicates) are shown next to the branches. The evolutionary distances were computed using the p-distance method and are in the units of the number of amino acid differences per site. The analysis involved 38 amino acid sequences. All ambiguous positions were removed for each sequence pair. There were a total of 2979 positions in the final dataset. Evolutionary analyses were conducted in MEGA5.
As described above, PTENs harbor two highly conserved domains, the PTP (Protein Tyrosine Phosphatase) domain that harbors the highly conserved catalytic motif (HCXXGXXR) and the C-terminal C2 domain. In addition, two other domains are described in HsPTEN, a 16 aa N-C-terminal domain called the PBD from PtdIns(4,5)P2 Binding Domain (Iijima et al., 2004) and the CLS from
Cytoplasmic Localization Signal (Denning et al., 2007). PpPTENs present the conserved PTP domain with the conserved catalytic motif. The catalytic cystein (Cys124 in HsPTEN) is conserved in all PpPTENs as the majority of the residues in the catalytic motif with the exception of Lysine (Lys 128) and Glycine (Gly 129). These two residues are substituted by a Methionine (Met) and Alanine (Ala) in PpPTEN A, B and C, and in the case of PpPTEND the Gly129 is substituted by a Glutamate (Glu) (Fig. 8) The C2 domain is the most variable region of this protein, presenting the lowest degree of homology.
Figure 8. Multiple Alignment Highlighting the catalytic motif of HsPTEN and P. patens PTENs. The catalytic
cysteine is underlined in yellow and the residues underlined in red represents the residues changed in P. patens PTENs.
HsPTEN harbors a 16 aa N-terminal polybasic (PDB) motif that was characterized as the responsible for the binding of PtdIns(4,5)P2 present in the membrane (Iijima et al., 2004). In PpPTENs this motif
does not occupy the same N-terminal position being inside of the sequence (Fig.9) which, considering its function in HsPTEN is a major difference.
Figure 9. Multiple alignment of PDB (green) and CLS (pink) motifs from HsPTEN and P. patens PTENs. The red
underlined residues represents the basic residues of the polybasic PDB domain; the residues underlined in green are the different residues between P. patens PTENs and HsPTEN.
From the full length sequence alignment of PpPTENs with HsPTEN it was possible to identify a sequence that presents significant degree of conservation with the PDB motif of HsPTEN. However, PpPTENs PDB motif shows some differences from the one of HsPTEN. The basic character of this motif is crucial for its function; the HsPTEN PDB motif presents five basic residues, Lys 6, Arg 11, Lys 13, Arg 14 and Arg 15 (Fig. 9). P. patens PTENs PDB motif presents some differences to the HsPTEN PDB motif but also among them. PpPTENA and PpPTENB PDB motif also present five basic residues, two lysines and three arginines although at different positions (Fig.9 highlighted in green), but PpPTENC and PpPTEND have only three basic residues, two lysines and one arginine and in both one arginine is substituted by a tryptophan a very big and rare aa, which probably has some effect at the structure level do to its dimension. Differences in the basic character of this sequence may have an important effection on the domain´s function. Furthermore, the HsPTEN glutamic acid (Glu 7) is substituted in all PpPTENs for a histidine.
The CLS motif was identified in HsPTEN (Denning et al., 2007) as a sequence responsible for the cytoplasmic localization of HsPTEN. PpPTENs also presents a motif with high homology with HsPTEN CLS motif despite some differences (Fig.9 sequence underlined in pink). The human CLS motif is situated near the N-terminal PIP2 binding motif as observed in PpPTENs (Fig. 9) and is composed of only seven aa (DGFDLDL). In PpPTENA and B the aspartic acid (Asp 19 in HsPTEN) is replaced by a Glycine (Gly) and the Leucine (Leu 25) is replaced by a Methionine (Met), all the other aa are identical. In the case of both PpPTENC and D the differences are greater, the only aa identical to the ones of human CLS are the Leucine (Leu 23) and aspartic acid (Asp 24) (Fig.9), all the other aa are substituted without maintaining the electrochemical properties of the sequence (Fig. 9).
Additional to the two characteristic domains of PTENs, the PTP and C2 domains, PpPTEND presents at its N-terminal a conserved domain of unknown function called DUF 936, according with NCBI (http://www.ncbi.nlm.nih.gov)
3.2 Protein Modeling
In order to provide additional information on the relationship between P. patens PTEN structure and function, the different models of PpPTENA and PpPTEND proteins were built.
The structure of PpPTEN proteins was obtained by comparative modeling using the web server ModWeb, the front end of Modeller. Five models were obtained for both proteins (PpPTENA and PpPTEND) being chosen for further investigation the lowest-energy conformers (Fig. 10). The most reliable models were obtained by overlapping both PpPTENA and PpPTEND with CI_VSP (PDB:3V0D chain:A). CI_VSP is a Voltage Sensor Protein from Ciona intestinales, which harbors a
transmembrane voltage sensor domain (VSD) and a cytoplasmic PTEN domain (Liu et al., 2012). CI_VSP at the N-terminal presents two β-sheets corresponding to the linker region and a PTP domain similar to the PTP domain of Protein Tyrosine Phosphatase 1B (HsPTP1B) composed of five β-sheets and six α-strands. The PTP domain of PTENs consists of three loops with catalytic relevance which are: the D331 loop corresponding to the HsPTEN WPD loop, the catalytic P-loop (that harbors the conserved catalytic domain HCXXGXXR), and the Gating loop that corresponds to the TI loop from HsPTEN (Fig. 10).
Figure 10. Superimposition of the model of (A) PpPTENA on the X-ray structure of CI_VSP (PDB code: 3V0D;A);
P-loop of PpPTENA (light pink) with catalytic cysteine (red); Gating loop in green; D331 loop in pink; 522loop in orange (B) superimposition of the model of PpPTEND on the X-ray structure of CI_VSP (code PDB: 3V0D;A); P-loop of PpPTEND (orange) harboring the catalytic cysteine (cyan); Gating P-loop (Dark Blue); D331 P-loop (Pink); 522 loop (Blue); Unstructured sequence (Red) that harbors a ‘PEST domain’.
Figure 11. Schematic drawing of β-strand topologies in ‘C2-domains, Structure and Function of a Universal Ca2+
The C2 domain reveals a type I topology, while HsPTEN presents a type II topology of the C2 domain (Figure 11). In PpPTENs this domain is composed of nine β-sheets harboring the 522 loop (equivalent to the CBR3 loop from HsPTEN) between β-sheets 6 and 7.
PpPTENA model has a NO35 value (Native Overlap – Defined as the fraction of C-alpha atoms in a model that are within 3.5Ȧ of the corresponding atoms in a model after rigid body superimposition of the model to the native structure) of 0.792 which indicates that the model is reliable (Sanchez et al., 2000). The target region of PpPTENA (the modeled region) comprises residues 179-490 and the template region of CI_VSP comprises residues 251-569, which means that both PDB and CSL domains are not present in the model. PpPTENA model consists of a 215-residue N-terminal domain (residues 149-364) and a 125-residue C-terminal domain (residues 365-490).
Superimposition of the two models (PpPTENA and CI_VSP) revealed weak differences in the structure of the phosphatase domain, which is composed by a central five-stranded β-sheet that packs with two α-helices at one side and four on the other. It is possible to identify the P-loop, harboring the catalytic signature motif (Fig. 10 light pink structure whereas the catalytic cystein is marked in red) as well as the regions corresponding to the Gating loop (following the CI_VSP nomenclature) (Fig. 10 green structure), and to the D331 loop (Fig. 10 pink structure). These loops are responsible to coordinate the phosphate groups of the phosphatidylinositol phosphates in the binding pocket. The predicted D331 loop of PpPTENA corresponds to residues 266-269 with the sequence DDHN, exactly the same of CI_VSP (Appendix 2). The Gating loop in PpPTENA is five residues shorter than the one of CI_VSP. The C2 domain is the most divergent region of PTENs and is at this level that similarity between different sequences is lower. This domain is composed of eight β-sheets and in PTENs has a topology identical to the type II topology (Fig. 11) (Nalefski and Falke, 1996). The C2-domain harbors the CBR3 (calcium binding region) loop in HsPTEN which corresponds to the 522 loop in CI_VSP differing in orientation and position once CBR3 loop is between β-sheets 5 and 6, whereas the 522 loop is between β-sheets 6 and 7. In PpPTENA, the C2 domain is composed by eight β-sheets and the predicted loop corresponding to the 522 loop, despite some structural differences, is between β-sheets 6 and 7.
The protein model obtained for PpPTEND has a lower NO35 value of 0.768 than the one obtained for PpPTENA but still is reliable. PpPTEND was also modeled using CI_VSP chain A (PDB: 3V0D) as template. From PpPTEND the target region comprises residues 348-659 and the template region from CI_VSP comprises residues 251-574. Also in this case the PDB and CLS motifs are not modeled and in addiction the DUF 936 domain (residues 23-259) are also absent from the model. PpPTEND model consists of a 184-residue N-terminal domain (residues 348-532) and a 126-residue C-terminal domain (residues 533-659). The N-terminal domain presents the P-loop, harboring the catalytic motif
(residues 466-474, catalytic cystein is the residue 467) (Fig. 8 orange loop; the catalytic cystein is in cyan), the D331 loop (Fig. 8. Pink loop) between residues 266-269 with the sequence RGNN (different from the DDHN of PpPTENA) and the Gating loop (residues 398-413 in CI_VSP) corresponds to residues 502-512, being five residues shorter than the gating loop from CI_VSP, similarly to what observed in PpPTENA and HsPTEN (Liu et al., 2012). The 522 loop, corresponding to the CBR3 loop in HsPTEN, is at the C2 domain which presents the lowest degree of similarity among these proteins. In the case of PpPTEND the C2-domain presents only seven β-sheets. The putative 522 loop is between β-sheets 4 and 5 and is composed by residues 612-621 (Fig. 8 in blue). The 522 loop of CI_VSP harbors a short α-strand that is not observed in PpPTENA, PpPTEND or in HsPTEN CBR3 loop. In addition, PpPTEND C2 domain presents a big unstructured region between residues 589-599 (Fig. 8 in red) that has no equivalent in CI_VSP, HsPTEN or even in the PpPTENA model. These residues correspond to the sequence SGVYVLELPED, which harbors the residues characteristic of a PEST (Proline, Glutamate, Serine and Tyrosine – rich) domain. Could this region function as a regulatory domain, similarly with what happens with HsPTEN C-terminal region?
The analysis of both PpPTENs protein models evidences a major difference within the C2 domains, particularly in the number of residues that compose this domain.
3.3 Triple pten b&c&d knock outs show enhanced rhizoid production and earlier
gametophyte development.
To first characterize the triple pten b&c&d knock out (KO) mutants, two different lines named #34 and #35 and wild type (WT) were grown in minimal media (ppNO3) and observed weekly during 4-6 weeks. What first noticed was a difference in terms of density of rhizoids between the triple KO lines and WT. The WT had apparently less rhizoids than the triple KOs (Fig. 12). To further characterize this phenotype we proceeded with measurements of rhizoid length and rhizoid number per gametophyte. To determine rhizoid length 15 day old gametophytes grown in ppNO3 media were picked and placed on a glass slide, pictures were taken and rhizoid length was measured. The results of these measurements are shown in Figure 13. Whereas WT rhizoid length has mean values of 2.1 (± 0.25) cm, values for triple #34 and #35 KOs were 2.82 (± 0.28) cm and 2.96 (± 0.46), respectively, with p values lower than 0.05, meaning that these values are statistically significantly different from WT.
Figure 12. P. patens grown in glass tubes under 16h/8h photoperiod. Triple knockout mutants present a higher
density of rhizoids than the Wt strain.
Figure 13. Total length of the rhizoid (n=12). P values were obtained by using a paired, two tail t- test.
In order to measure the number of rhizoids per gametophyte, we collected 15 day old gametophytes grown in ppNO3 media, at different stages of development. For this experiment gametophytes with 3, 4, 5, 6 and 7 leaves were used, in this way young gametophytes (with 3, 4 and 5 leaves) and adult gametophytes (with 6 and 7 leaves) were analyzed (Fig. 14A). At the stage of 3 leaves WT has an average of 6.8 (± 0.44) rhizoids per gametophyte whereas the triple #34 and #35 KOs have 9.5 (± 1.41) and 8.9 (± 0.97) rhizoids/gametophyte, respectively. These results means that the triple KO lines have between 45%, in the case of KO #34, and 36%, in the case of KO #35, more rhizoids per gametophyte than the WT. The difference between KOs and WT is similar along development with the exception of the stage of 7 leaves in which this difference is smaller and the mutant lines have both 24% more gametophytes than the WT (Fig. 14A).
Figure 14. (A) Total number of rhizoids per gametophyte (n=30). Gametophytes at different stages of
development were used. (B) Number of gametophytes per moss colony (n=12); measurements were done at 1week (1w), 2 weeks (2w) and 3 weeks (3w). The P values were obtained by using a paired, two tail t-test.
The number of gametophytes was also determined. For this experiment, small pieces of moss tissue of approximately 1 mm were grown during three weeks in minimal ppNO3 medium, as in the experiments described above, and gametophyte counting was done weekly. As a result, the difference between the number of gametophytes among the triple KO lines was higher in the first week. At this time, WT colonies had approximately 5.8 (± 1.54) gametophytes per colony (Fig. 14B) whereas the triple #34 and #35 KOs have 9.2 (±1.2) and 8.7 (±2.9) gametophytes per colony, respectively, a difference of 59% and 50% more gametophytes in KO mutants. At the second week this difference markedly decreases, WT has 20.0 (±2.8) gametophytes per colony whereas the triple #34 and #35 KOs have 21.7 (±3.0) and 21.8 (±3.9) gametophytes per colony, respectively. A difference of only 8% more gametophytes per colony than the WT. In the first two weeks (first two measurements) the p value was lower than 0.05, which indicates that the differences are statistically significant. Surprisingly, at the third week WT has more gametophytes (34 (±5.4)) per colony than triple KOs #34 (32.2 (±4.1)) and #35 (30.2 (±4.5)) (Fig. 14B) but at the third week p values were higher than 0.05 which indicates that this differences are not significant.
3.4 Triple pten b&c&d knock outs have longer caulonemal filaments when grown in the
darkness.
Since differences in rhizoids and gametophytes, which are differentiated from caulonemal cells, were observed between the WT and the triple KO lines, we further analyzed this cell type. In order to grow specifically caulonema cells, small pieces of tissue were grown in ppNH4 medium supplemented with 2% sucrose under continuous light during ten days, and then the tissue was kept four weeks in the dark due to the ability of caulonemal, but not of chloronemal cells, to grow in the dark (Cove et al., 1978). During the experiment, the length of caulonema filaments was measured weekly for three weeks.
Figure 15. (A) Total length of the caulonema filament (n=12) . (B) Length of caulonema cells (n=15). The P
values were obtained by using a paired, two tail t-test.
As shown in Figure 15, after 2 weeks of dark growth, caulonema filaments of WT have 0.9 (±0.06) cm, whereas filaments of triple #34 and #35 KOs have 2.2 (±0.03) cm and 2.3 (±0.03) cm, respectively. Caulonema filaments of the KO lines were two times longer than WT filaments. After 3 weeks of dark growth, differences in length of caulonema filaments among the three moss lines was smaller; WT caulonema filaments have 2.1 (±0.18) cm whereas caulonema filaments of triple #34 and #35 KOs have 3.6 (±0.08) cm and 3.5 (±0.13) cm, respectively. After four weeks of growth in the dark, WT caulonemal filament length was 2.56 (± 0.09) cm whereas the triple #34 and #35 KOs have 4.24 (± 0.05) cm and 4.20 (± 0.07) cm, respectively. In the two last measurements caulonema filaments of triple KOs were 65% longer than the ones of WT.
We hypothesized that the difference in length exhibited by caulonemal filaments in the triple KOs could be as a result of longer caulonema cells or because an increment in the number of cells per filament. Therefore, caulonema cell length was determined in caulonemal cells from the dark experiment. Surprisingly, triple KOs caulonema cells exhibited a statistically significant shorter length when compared to WT (Fig. 15B). Caulonemal cell length was 311.6 (±20.8) µm in the WT, and 272.5 (±39.02) µm and 279.3 (±35.1) µm in the triple #34 and #35 KOs, respectively. In addition, chloronema and caulonema cell length was determined in tissue grown in minimal medium (ppNO3), in 16h/8h light/dark regime during one week (standard growth conditions). As shown in Figure 16A chloronema cells have an average length of 100 µm in WT as in the triple KOs, whereas caulonema cell length has an average value of 247.8 (±34.6) µm in the WT and 231.4 (±37) µm and 236.2 (±35.1) µm in the triple #34 and #35 KOs, respectively. These values were confirmed by three independent experiments.
Figure16. (A) Cell length of chloronema and caulonema cells (n=30). (B) Cell length of rhizoid cells (n=30). The P
values were obtained by using a paired, two tail t-test.
Rhizoid cell length was also determined. For that purpose, 15 day-old gametophytes, grown under the conditions described above, were collected and the length of the second and third cell of the rhizoid filament was measured (Fig. 16B). WT rhizoid cell length was 287 (±35.1) µm whereas triple #34 and #35 KOs was 240 (±35.1) µm and 238 (±30.3) µm, respectively, thus rhizoid cells from KOs were approximately 20% smaller than the ones of WT. These values were confirmed by three independent experiments.
3.5 Triple pten b&c&d knock outs caulonemal and chloronemal cells grow faster.
Due to the differences previously described, growth rate of protonemal cells was determined. WT chloronema cells growth rate was 6.3 (±1.9 ) µm.h-1, confirming data previously reported (Menand et
al., 2007). For triple #34 and #35 KOs values for chloronema growth rate were higher, 8.6 (±3.0) µm.h-1 and 8.4 (±2.5) µm.h-1, respectively (Fig. 17A). This implies that chloronema cells of triple #34
and #35 KOs grow 37% and 33% faster than WT chloronema cells. The differences in caulonema cell growth rates were even higher than in chloronema, as illustrated in Fig. 17B. WT caulonema cells grew at a rate of 19.4 (±4.6) µm.h-1, accordingly with previous reports (Menand et al., 2007), whereas
triple #34 and #35 KOs grew at a rate of 27.1 (±4.6) µm.h-1and 29.5 (±7.1) µm.h-1, respectively, which
means that these cells grew 40% and 51% faster than the WT. Therefore, it is possible to conclude that the longer caulonemal filaments exhibited in the triple KOs from the dark growth experiment were a result of a faster cell growth rate.
Figure 17. (A) Growth rate of chloronema cells (n=20) and (B) caulonema cells (n=35) (p<0.05 from t-test).
3.6 PpPTENB is mainly localized at the tip of caulonemal cells and rhizoids.
In order to study PpPTENB subcellular localization and its distribution in the different developmental stages of the moss life cycle, a stable “Knock In” line was generated where the PpPTENB gene is fused to mGFP (modified Green Fluorescence Protein). After transformation in moss protoplasts, putative moss colonies growing after two rounds of selection were further analyzed by PCR. The correct insertion of the Knock In construct was confirmed by PCR using a combination of primers in order to
amplify the right border (PFwA vs PRevA) and left border (PFwA vs PRevA) of the insertion as shown in Table 4 (Materials and Methods section) and in Figure 18.
As result of the PCR analysis several positive lines were obtained (Fig. 19), and line #6 was then used for further analysis.
Figure 18. Schematic representation of PpPTEN locus after transformation. The grey boxes represent genomic
sequences, the white boxes with black lines represent the 5´end gDNA and the 3´UTR sequences, respectively cloned in the Knock In construct. The white box represents the sequence of the reporter gene, the black box represents the hygromycin resistance cassette. gDNA, genomic DNA; ATG, start codon; TAA, stop codon, mGFP modified Green Fluorescent Protein, HygroR Hygromycin resistance, UTR, untranslated region.
Figure 19. Genotyping Knock In PpPTENB-mGFP by PCR. Twenty lines were genotyped (1 to 20); WT was used
as negative control. LB: Left Border; RB: Right Border.
Moss tissue was grown in minimal media ppNO3 and 16h/8h light/dark photoperiod, and PpPTENB-mGFP fluorescence was observed under a stereoscope or by confocal microscopy. At protonemal stage (one week of growth), fluorescence is observed in both chloronema and caulonemal cells, but a more intense signal is always observed at the tip cell of the caulonema filaments, with a cytosolic and
nuclear distribution. A high fluorescence signal was observed within the first week of protonemal growth (Fig. 20A) decreasing in the second week probably due to further development from the protonemal stage to a gametophytic stage (Fig. 21). After 15 days of growth, the fluorescence signal was mainly observed in the cells located at the base of the gametophytes and in rhizoids (Fig.21), being more intense at the tip cell of those filaments. Buds and juvenile and adult gametophores showed staining restricted to the emerging rhizoids and to distinct spots in the apex, which could represent axillary hair primordial.
Figure 21. In vivo localization of
PpPTENB_GFP.
A) and B) Caulonema cells; C) and D) Chloronema cellg. The asterisk indicates new branching; E) and F) Apical caulonema cell, the asterisk indicates a new bud; G) and H) Apical chloronema cell, the asterisk indicates a bud; I) and J) Young Gametophyte, the cardinal indicates a chloronema apical cell and the asterisk indicates a new rhizoid; K) and L) a Rhizoid cell.
Chapter 4.
Discussion
In human cells the signaling chain involving PI3K/PTEN/Akt is relatively well characterized, and there’s a consensus that the central role in this signaling pathway is played by PtdIns(3,4,5)P3. Much
less is known about this pathway in plant cells, specially due to the fact that plant cells lack PtdIns(3,4,5)P3 and the PI3K class I which synthesizes it. However, plants have PI3K and PTEN genes
and providing new insights about the possible role of PTEN in plant cells using P. patens as model organism was the objective of this work.
4.1 PpPTENs show several differences with animal PTENs.
P. patens contains four PTEN genes, named PpPTENA, PpPTENB, PpPTENC and PpPTEND. PpPTENs have 11 introns and 12 exons with the particular exception of PpPTEND, which presents an extra intron and an extra exon (Fig. 6). PpPTENs gene structure is very similar to the genomic structure of AtPTEN2a (At3g19420). PpPTENs are larger proteins compared to their animal counterparts (HsPTEN 403 aa; DdPTEN 639 aa; CI_VSP 576 aa), PpPTENA and PpPTENB have 662 and 658 aa, respectively, similar to AtPTEN2a (611aa) and AtPTEN2b (632aa). PpPTEN C and PpPTEND have a higher size with 756 aa and 902 aa, respectively.
The modular structure of PTEN proteins consist of the N-terminal phosphatase (PTP) domain, which harbors the catalytic core signature motif of protein tyrosine phosphatases (I/V)HCXAGXXR, and the C-terminal C2 domain. In addition PTENs also present a short N-terminal PI(4,5)P2 binding domain
(PDB domain) (Lee et al., 1999) which is crucial for the binding of PTEN to membrane lipids and a cytoplasmic localization signal (CLS) crucial for its cytoplasmic localization (Denning et al., 2007). PpPTENs display the canonical PTP domain, harboring the catalytic motif, the C2 domain as the PDB and CLS domains (Appendix 1).
Structurally PTENs present some features that are common to all PTENs; from the crystal structure of HsPTEN it was possible to determine that the PTP domain is composed of a central five-stranded β-sheet that packs with two α-helices at one side and four on the other (Lee et al., 1999) . The PTEN (I/V)HCXAGXXR signature motif forms a loop, denominated P-Loop, located at the bottom of the active site pocket. Two more loops are identified at the PTP domain, the WPD loop and the TI loop following HsPTEN denomination, (Lee et al., 1999) that together with the side chains of the residues at the P-loop compose the walls of the active site pocket. The binding pocket of PTENs is deeper and