PHYSIOLOGICAL RESEARCH
ISSN 0862-8408
2004 Institute of Physiology, Academy of Sciences of the Czech Republic, Prague, Czech Republic Fax +420 241 062 164E-mail: physres@biomed.cas.cz http://www.biomed.cas.cz/physiolres
Physiol. Res. 53: 19-26, 2004
Pattern of Right Ventricular Pressure Fall and Its Modulation
by Afterload
J. CORREIA-PINTO, T. HENRIQUES-COELHO, S. MAGALHÃES,
A. F. LEITE-MOREIRA
Department of Physiology, Faculty of Medicine, University of Porto, Portugal
Received August 30, 2002 Accepted February 25, 2003
Summary
Pattern of right ventricular pressure (RVP) fall and its afterload dependence were examined by analyzing ventricular pressure curves and corresponding pressure-dP/dt phase planes obtained in both ventricles in the rat heart in situ. Time and value of dP/dtmin, and the time constant τ were measured at baseline and during variable RV afterload elevations, induced by beat-to-beat pulmonary trunk constrictions. RVP and left ventricular pressure (LVP) decays were divided into initial accelerative and subsequent decelerative phases separated by corresponding dP/dtmin. At baseline, LVP fall was decelerative during 4/5 of its course, whereas only 1/3 of RVP decay occurred in a decelerative fashion. During RV afterload elevations, the absolute value of RV-dP/dtmin and RV-τ increased, whilst time to RV-dP/dtmin decreased. Concomitantly, the proportion of RVP decay following a decelerative course increased, so that in highly RV afterloaded heartbeats RVP fall became more similar to LVP fall. In conclusion, RVP and LVP decline have distinct patterns, their major portion being decelerative in the LV and accelerative in the RV. In the RV, dP/dtmin, τ and the proportional contribution of accelerative and decelerative phases for ventricular pressure fall are afterload-dependent. Consequently,
τ evaluates a relatively much shorter segment of RVP than LVP fall.
Key words
Right ventricle • Ventricular pressure fall • Relaxation time constant • Rat
Introduction
Owing to the recognition of the importance of diastolic function for an adequate cardiac function (Vasan and Benjamin 2001), many studies in the last two decades have focused their attention on the diastolic phase of the cardiac cycle and particularly on its determinants (Shintani and Glantz 1994). Myocardial relaxation is one of the determinants of diastolic function, the importance of which has been recognized both for early and late diastolic filling (Leite-Moreira et al. 1999a, 2001, Leite-Moreira and Correia-Pinto 2001).
intermediate phase corresponds to the isovolumetric relaxation, whilst the terminal phase occurs during early LV diastolic filling. Analysis of LV pressure fall commonly includes indices for evaluating either time of onset or rate of the intermediate phase of pressure decline (Gillebert et al. 1997). Time of onset may be evaluated through ejection duration and time from end-diastole to aortic valve closure or to peak rate of LV pressure fall (dP/dtmin). The most commonly used indices that evaluate rate of pressure decline are dP/dtmin, isovolumetric relaxation time, and time constant τ. Note that the later two indices, by definition, evaluate only the rate of intermediate LV pressure fall.
Even if most authors evaluate RV pressure fall with the above described indices for LV pressure fall (Chen et al. 1998, Leeuwenburgh et al. 2002), based on the assumption that pressure fall follows a similar course in both ventricles, the adequacy of this approach remains to be investigated. This question attains particular relevance if we take into account that application of LV systolic indices to the RV has to be done cautiously (Dell'Italia and Santamore 1998).
In the LV, the identification of the different phases of ventricular pressure fall and, therefore, the description of its pattern was based on analysis of pressure-dP/dt phase-planes (Leite-Moreira and Gillebert 1994, Eucker et al. 2001) of variably afterloaded heartbeats (Leite-Moreira and Gillebert 1994).
In the present study, we describe the pattern of RV pressure fall and analyze which portion of RV pressure fall is evaluated by the indices commonly used for LV pressure fall, as well as, their modulation by afterload in the in situ rat heart.
Methods
The present investigation conforms to the Guide for the Care and Use of Laboratory Animals published by the US National Institutes of Heath (NIH Publication No. 85-23, revised 1996). The study was carried out in ten male Wistar rats (7 weeks old, Criffa, S.A., Barcelona).
The animals were anesthetized with pentobarbital (6 mg/100 g, ip) and their trachea was cannulated with the external sheath of an Abocath® 16G. Through the tracheostomy, mechanical ventilation was initiated (Harvard Small Animal Ventilator, Model 683) delivering oxygen-enriched air at 60 cpm with a tidal volume of 1 ml/100 g. Respiratory rate and tidal volume were adjusted to keep arterial blood gases and pH within physiological limits. Under binocular surgical microscopy (Leica, Wild M651.MS-D, Herbrugg,
Switzerland) the right jugular vein was cannulated with the external sheath of an Abocath® 24G, through which a prewarmed solution (20 mM KCl and 40 mM of NaHCO3 in 500 ml of 0.9 % NaCl) was administered to compensate for perioperative fluid losses. The heart was then exposed through a median sternotomy and the pericardium was widely opened. The pulmonary artery was dissected to allow its external occlusion during the experimental protocol. A 2F high-fidelity micromano-meter (SPR-407, Millar Instruments, Houston, Texas), inserted through the RV free wall into the RV cavity, and a 3F high-fidelity micromanometer (SPR-407, Millar Instruments, Houston, Texas) inserted through an apical puncture into the LV cavity, were used to measure the RVP and the LVP, respectively. Both manometers were calibrated against a mercury column and zeroed after stabilization for 30 min in a water bath at body temperature. A limb ECG (DII) was recorded during the entire experiment. Throughout the experimental protocol, intraperitoneal sodium pentobarbital was given in bolus regimen (2 mg/100 g) when needed to maintain an adequate depth of anesthesia. At the end of the experiment, the animals were sacrificed with an overdose of the anesthetics and the position of micromanometers was verified at necropsy.
Experimental protocol
Complete instrumentation took around 40 min, after that the animal preparation was allowed to stabilize for 15 min before the beginning of the experimental protocol. Multiple graded pulmonary artery constrictions were then performed by abruptly narrowing or occluding the pulmonary trunk during the diastole separating two heartbeats. The first heartbeat following constriction of the pulmonary artery, test heartbeat, was compared to the preceding control heartbeat. These beat-to-beat interventions allowed a selective alteration of afterload without changes of preload or long-term load history. Systolic RVP of the test heartbeat varied as a function of the extent of pulmonary constriction. After each intervention, the pulmonary artery constriction was released and the animal was stabilized for several beats before another intervention was performed. At each afterload level, two beats were selected for further analysis.
The animals were not paced, but heart rate did not vary during the experimental protocol (284±21 bpm).
Data acquisition and analysis
converted on line to digital data with a sampling frequency of 1000 Hz. To distinguish between end-diastole at the beginning and at the end of the analyzed cardiac cycle, they were referred to as ED(pre) and ED(post), respectively. Peak rates of the right (RV-dP/dtmax) and left (LV-dP/dtmax) ventricular pressure rise, as well as peak rates of right (RV-dP/dtmin) and left (LV-dP/dtmin) ventricular pressure fall were measured. RVP was measured at the beginning of the cardiac cycle
(RVPED(pre)), at peak-systole (RVPmax), at the moment of
RV-dP/dtmin, at its protodiastolic nadir (RVPmin), and at the end of the cardiac cycle (RVPED(post)). LVP was measured at the beginning of the cardiac cycle
(LVPED(pre)), at peak-systole (LVPmax), at the moment of
LV-dP/dtmin, at its protodiastolic nadir (LVPmin), and at the end of the cardiac cycle (LVPED(post)). Time to the onset of pressure fall was measured as the time interval from end-diastole to the moment of the correspondent dP/dtmin. Rate of ventricular pressure fall was evaluated with the corresponding dP/dtmin and time constant τ. For calculating τ, the portion of the pressure time course between dP/dtmin and the point where ventricular pressure fell below its value at ED(post) was selected. The curve was fitted to a monoexponential model (τ) (Weisfeldt et al. 1978, De Mey et al. 2001, Langer and Schmidt 1998, Langer 2002) with the non-zero asymptote, given by the following equation:
P(t) = P0 e -t/τ +P∞
where P∞ is a non-zero asymptote (mm Hg), P0 is an amplitude constant (mm Hg), t is time (ms) and τ is the time constant of the exponent (ms). The r2 yielded values > 0.96.
Statistical analysis
Group data are presented as mean values ± S.E.M. To compare the control and three levels of afterload elevations, we selected the nonparametric Friedman repeated-measures analysis of variance on ranks, once several data sets failed in the Kolmogorov-Smirnov test for normality. When treatments were significantly different, the Tukey test was selected to perform pair-wise multiple comparisons. Statistical significance was set at p<0.05.
Results
In addition to the control cycle, we selected for further analysis heartbeats with low, moderate and high afterload elevations defined as an increase from control
peak systolic RVP as follows: (i) 5.1±0.8 mmHg; (ii) 10.3±1.2 mmHg and (iii) 21.8±3.2 mm Hg. Control RVPmax was 24.1±1.6 mm Hg. Hemodynamic parameters of both ventricles were measured during the beat-to-beat constrictions of the pulmonary trunk.
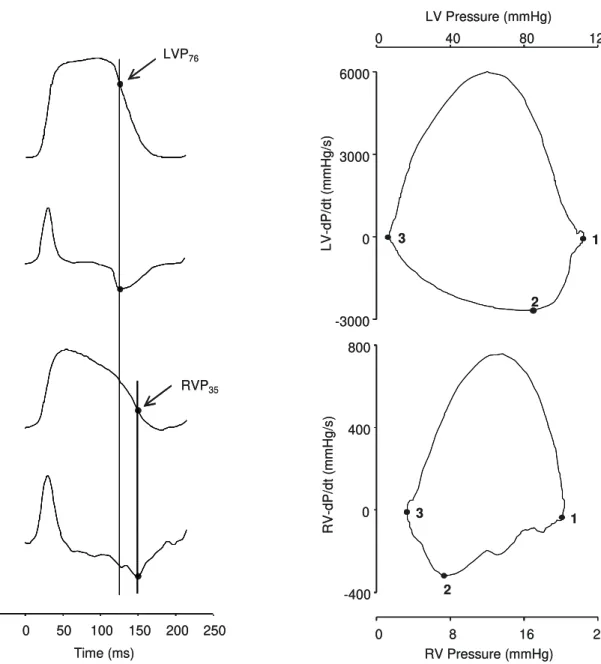
Right and left ventricular pressure fall in control cycles In Figures 1 and 2, a representative example of a baseline cardiac cycle is represented as right and left ventricular pressure and dP/dt time courses and pressure-dP/dt phase planes. In these figures, the pattern and rate of RV pressure fall can be compared with those of LV pressure fall.
Both ventricles exhibit two distinct phases of pressure fall, an initial accelerative phase and a subsequent decelerative phase separated by the corresponding dP/dtmin. In the LV, the initial accelerative phase (until LV-dP/dtmin) encompasses 21±3%, while the major part (~80%) of LV pressure fall occurs during the subsequent phase (after LV-dP/dtmin) in a decelerative fashion. In contrast, the negative portion of RV-dP/dt is accelerative in approximately two thirds (67±4 %) of its course.
The negative portion of RV-dP/dt often presented, in control beats, a double peaked pattern with the precocious negative peak occurring simultaneously with LV-dP/dtmin as exemplified in Figure 1. When this occurred, the time to first RV-dP/dt negative peak and LV-dP/dtmin was 128±6 ms and 127±7 ms, respectively. The second negative peak always corresponded to RV-dP/dtmin and occurred 19±3 ms later than LV-dP/dtmin.
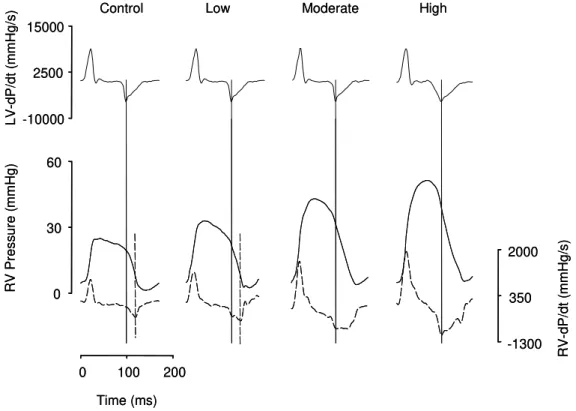
Effects of RV afterload elevations on right and left ventricular pressure fall
predominantly accelerative course that, as outlined above, commonly presents a precocious negative peak coincident with LV-dP/dtmin. At moderate afterload elevations, the negative course of RV dP/dt acquires a broad peaked shape that is often horizontal during more than half of its course, indicating a constant rate of decline of RV pressure. Finally, highly afterloaded beats presented an initial accelerative course of RV-dP/dt
corresponding to 43±10% of RV pressure fall, followed by a decelerative course thereafter. In these heartbeats, the pattern of RV pressure fall becomes more similar to that of LV pressure fall.
With regard to RV time constant τ and
RVPED(post), both increased regularly and significantly
with RV afterload elevations.
Fig. 1. Representative example of baseline time courses of left ventricular (LV) pressure, left ventricular dP/dt (LV-dP/dt), right ventricular (RV) pressure, right ventricular dP/dt (RV-dP/dt).
Vertical solid line marks LV-dP/dtmin, which occurs when LV
pressure fell to 76% (LVP76) of its peak-systolic value. Dashed
vertical line marks RV-dP/dtmin, which occurs when RV pressure
fell to 35 % (RVP35) of its peak-systolic value. Note that vertical
solid line, which marks LV-dP/dtmin, intercepts the accelerative
segment of negative RV-dP/dt at the moment of its first negative peak.
Fig. 2. Representative example of left (LV, upper panel) and right (RV, lower panel) pressure-dP/dt phase plane plots recorded at baseline. In both graphs, the points 1, 2 and 3
correspond to peak-systolic pressure, dP/dtmin and minimal
ventricular pressure, respectively. Note that in LV, the major part of pressure decline occurs in the subsequent and decelerative phase (segment between points 2 and 3), whilst in the RV, it occurs during the initial and accelerative phase (segment between points 1 and 2).
0 40 80 120 -4000 0 4000 8000 0 8 16 24 Time (ms)
-50 0 50 100 150 200 250 -400 0 400 800 LV Pres sur e (m mH g) LV-dP/dt (m mH g/s) R V Press u re ( m m H g) R V -dP/dt ( mmH g/ s) LVP76 RVP35 0 40 80 120 -4000 0 4000 8000 0 8 16 24 Time (ms)
-50 0 50 100 150 200 250 -400 0 400 800 LV Pres sur e (m mH g) LV-dP/dt (m mH g/s) R V Press u re ( m m H g) R V -dP/dt ( mmH g/ s) LVP76 RVP35
LV Pressure (mmHg)
0 40 80 120
-3000 0 3000 6000
RV Pressure (mmHg)
0 8 16 24
-400 0 400 800 1 2 3 1 2 3 LV-dP/dt (m mH g/s) R V -dP/dt ( mmH g/ s)
LV Pressure (mmHg)
0 40 80 120
-3000 0 3000 6000
RV Pressure (mmHg)
0 8 16 24
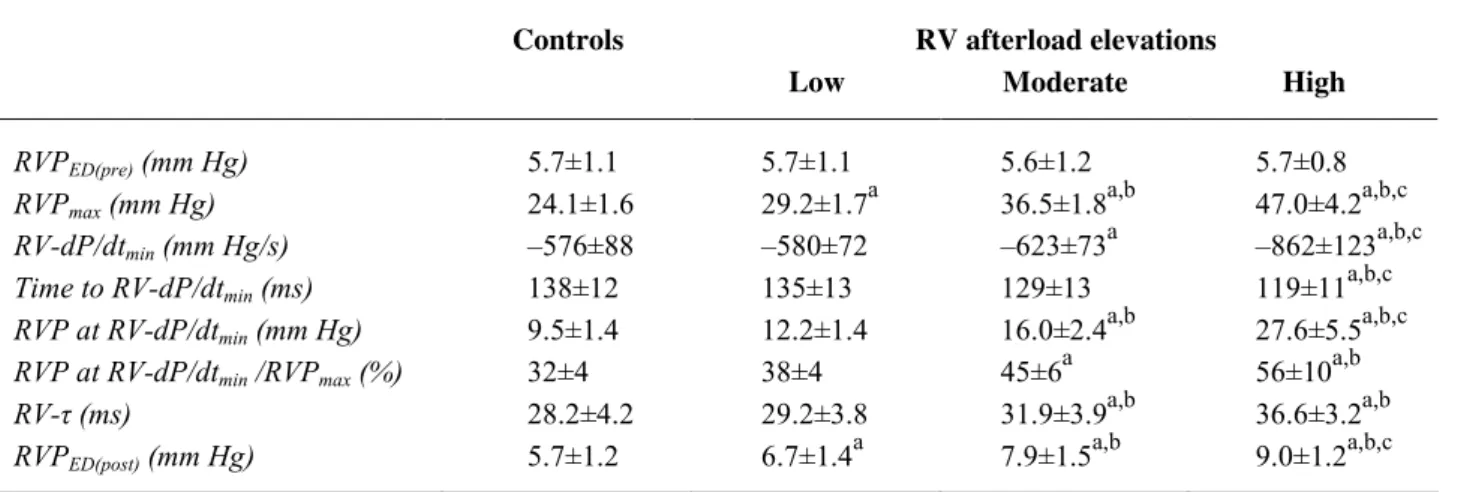
Table 1. Effects of RV afterload elevations on right ventricular pressure fall.
Controls RV afterload elevations
Low Moderate High
RVPED(pre) (mm Hg) 5.7±1.1 5.7±1.1 5.6±1.2 5.7±0.8
RVPmax (mm Hg) 24.1±1.6 29.2±1.7
a
36.5±1.8a,b 47.0±4.2a,b,c RV-dP/dtmin (mm Hg/s) –576±88 –580±72 –623±73
a
–862±123a,b,c
Time to RV-dP/dtmin (ms) 138±12 135±13 129±13 119±11
a,b,c
RVP at RV-dP/dtmin (mm Hg) 9.5±1.4 12.2±1.4 16.0±2.4
a,b
27.6±5.5a,b,c RVP at RV-dP/dtmin /RVPmax (%) 32±4 38±4 45±6
a
56±10a,b
RV-τ (ms) 28.2±4.2 29.2±3.8 31.9±3.9a,b 36.6±3.2a,b
RVPED(post) (mm Hg) 5.7±1.2 6.7±1.4
a
7.9±1.5a,b 9.0±1.2a,b,c
Data are presented as means ± S.E.M., n=10. RVPED(pre) and RVPED(post) right ventricular end diastolic pressures at the beginning and at
the end of the cardiac cycle, respectively; RVPmax peak right ventricular pressure; RV-dP/dtmin right peak fall of dP/dt; RV-τ right
ventricular time constant τ. P<0.05 indicate significance: a
vs. control; b
vs. low; c
vs. moderate.
Table 2. Effects of RV afterload elevations on left ventricular pressure fall.
Controls RV afterload elevations
Low Moderate High
LVPED(pre) (mm Hg) 11.2±1.6 11.1±1.6 11.3±1.6 11.5±1.5
LVPmax (mm Hg) 101.8±9.0 100.7±8.8 100.4±8.8 103.6±9.2
LV-dP/dtmin (mm Hg/s) –3353±712 –3255±644 –3219±611 –3099±518
a,b,c
Time to LV-dP/dtmin (ms) 120±10 117±10 118±10 119±11
LVP at LV-dP/dtmin (mm Hg) 74.4±8.2 76.4±8.7 72.2±8.1 73.7±9.1
LVP at RV-dP/dtmin /LVPmax (%) 79±7 79±7 80±7 80±7
time constant for LV, τ (ms) 15.3±1.4 15.8±1.1 15.4±0.9 16.7±0.9
LVPED(post) (mm Hg) 11.4±1.2 11.8±1.3 11.8±1.2 11.9±1.4
Data are presented as means ± S.E.M; n=10. LVPED(pre) and LVPED(post) left ventricular end diastolic pressures at the beginning and at the
end of the cardiac cycle, respectively; LVPmax peak left ventricular pressure; LV-dP/dtmin left peak fall of dP/dt; LV-τ left ventricular time
constant τ. P<0.05 indicated significance: a
vs. control; b
vs. low; c
vs. moderate.
Discussion
The present study describes the basal pattern of RV pressure fall as well as its modulation by afterload. It demonstrates that the time constant τ evaluates a relatively much shorter segment of the right than left ventricular pressure fall.
Investigation of load dependence on the relaxation rate and diastolic function, in the in situ intact heart, must be performed with beat-to-beat load manipulations in the presence of a widely opened pericardium as in the present study, in order to exclude several interfering factors, such as neurohumoral activation, pericardial constraint, preload changes and
long-term load history (Shintani and Glantz 1994, Gillebert et al. 1997).
Similarly to what we had previously described for the LV, the present study has shown that RV pressure fall is non-uniform, encompassing two consecutive distinct phases, an initial accelerative and a subsequent decelerative, separated by LV-dP/dtmin (Leite-Moreira and Gillebert 1994).
on positive RV dP/dt during the ventricular pressure rise. They observed that the positive RV-dP/dt curve is commonly wide or double peaked, with one of the peaks corresponding in time to the LV-dP/dtmax. This suggests that one component could be directly related to RV contraction, whereas the other could be related to LV contraction. The association of our data with these findings led us to propose that ventricular interaction may
also occur during the RV pressure fall as has also been suggested by others (Brown et al. 1993). The first negative peak, temporally related with LV pressure decline (LV-dP/dtmin), could be secondary to ventricular interaction, whereas the second negative peak (always coincident with RV-dP/dtmin) might be related to RV relaxation.
Fig. 3. Effects of right ventricular afterload elevations on pressure fall. Left ventricular dP/dt (LV-dP/dt, upper panels), right ventricular (RV) pressure (bottom panels, solid lines) and RV-dP/dt (bottom panels, dashed lines) are displayed for the control, low, moderate and
high afterloaded heartbeats. Solid vertical lines are placed at LV-dP/dtmin. Note the changes in the morphology of RV-dP/dt during RVP
fall and in the time interval between LV-dP/dtmin and RV-dP/dtmin (dashed vertical line) as RV afterload is increased.
The analysis of pressure-dP/dt phase planes (Fig. 2) establishes another significant difference between right and left ventricular pressure fall. In the RV, pressure decline occurs essentially during the initial and accelerative phase, while in the LV it occurs predominantly during the subsequent and decelerative phase. In fact, about two thirds of the RV pressure fall occurs during the initial accelerative phase, whereas less than 1/3 of LV pressure falls during this phase. This has obvious implications for analysis and interpretation of indices used for evaluating the rate of ventricular pressure fall. In the LV, the moment at which LV-dP/dtmin occurs is commonly used for assessing the onset of ventricular pressure fall, while the time constant τ is considered the
best standard for estimating the rate of LV pressure fall (Gillebert et al. 1997). In the RV, dP/dtmin is not a reliable reference point for evaluating the onset of RV pressure fall because it appears when the major portion of ventricular pressure decline has already occurred. On the other hand, relatively minor contribution of the decelerative phase for the RV pressure decline at normal pulmonary pressures, may compromise the assumption that time constant τ evaluates a significant portion of ventricular pressure fall in the RV.
The afterload has already been identified as an important modulator of LV pressure fall. The LV afterload elevations change both the time of onset (time
R
V
-dP/dt (
mmH
g/
s)
-1300 350 2000
R
V
Press
u
re (
mmH
g)
0 30 60
LV-dP/dt
(
m
mH
g/s)
-10000 2500 15000
Control Low Moderate High
Time (ms) 0 100 200
R
V
-dP/dt (
mmH
g/
s)
-1300 350 2000
R
V
Press
u
re (
mmH
g)
0 30 60
LV-dP/dt
(
m
mH
g/s)
-10000 2500 15000
Control Low Moderate High
to dP/dtmin) and the rate (time constant τ) of the LV pressure fall (Leite-Moreira and Gillebert 1994).
In the current study, we showed that RV afterload elevation significantly modifies the pattern and rate of RV pressure fall. For instance, time to RV-dP/dtmin decreases with RV afterload elevations, so that RV- and LV-dP/dtmin occur simultaneously in the RV highly afterloaded heartbeats. This afterload dependence of the time to RV-dP/dtmin might help to explain some controversy about the exact moment of its occurrence (Pouleur et al. 1980, Morris et al. 1986). The decrease of the time to RV-dP/dtmin during afterload elevations is accomplished by a progressive shortening of the duration of initial RV pressure fall and a concomitant prolongation of the subsequent decelerative phase. Thus, in highly afterloaded heartbeats about two thirds of the RV pressure fall occurs during the decelerative phase resembling that usually occurring in the LV.
As far as evaluation of RV myocardial relaxation rate is concerned, acute beat-to-beat RV afterload elevations increased the absolute value of RV-dP/dtmin as well as RV-τ. An increase of RV-τ traduces a decrease of the rate of RV pressure fall during the decelerative phase and simultaneously increases RVPED(post). In the LV, acute beat-to-beat afterload-induced elevation of end-diastolic pressures could be related with afterload-induced changes of the time constant τ(Leite-Moreira et al. 1999a, Moreira and Correia-Pinto 2001, Leite-Moreira et al. 2001). On the other hand, RV diastolic dysfunction secondary to chronic pulmonary artery
banding was also associated with increase of RV-τ
(Leeuwenburgh et al. 2002). Therefore, although RV-τ
evaluates a different portion of pressure fall than LV-τ, the concomitant increase of RV-τ and RVPED(Post) induced by afterload elevations might suggest that it keeps the potential of predicting afterload-induced changes in ventricular filling pressures.
Such distinct patterns of right and left ventricular pressure fall might be related with the significantly lower impedance against which the RV ejects. This results in a longer duration of RV ejection, with pulmonary valve closure occurring when a major portion of the RV pressure fall had already occurred (Redington 2002).
In conclusion, RV and LV pressure fall follow distinct time courses, the initial accelerative phase being relatively longer in the RV and the subsequent decelerative phase being relatively longer in the LV. As afterload increases, the course of RV pressure fall becomes progressively more similar to that of LV pressure fall. We should, therefore, be aware that with normal pulmonary systolic pressures, RV-τ only evaluates a minor portion of the RV pressure fall.
Acknowledgements
Supported by Portuguese grants from Calouste Gulbenkian Foundation and Fundação para a Ciência e Tecnologia (POCTI/CBO/47519/02; partially funded by FEDER), through Cardiovascular R&D Unit (51/94-FCT, Portugal).
References
BROWN CD, CHOW E, FARRAR DJ: Left ventricular unloading decreases rate of isovolumic right ventricular pressure decline. Am J Physiol265: H1663-H1669, 1993.
CHEN EP, CRAIG DM, BITTNER HB, DAVIS RD, VAN TRIGT P: Pharmacological strategies for improving diastolic dysfunction in the setting of chronic pulmonary hypertension. Circulation97: 1606-1612, 1998. DE MEY S, THOMAS JD, GREENBERG NL, VANDERVOORT PM, VERDONCK PR. Assessment of the time
constant of relaxation: insights from simulations and hemodynamic measurements. Am J Physiol 280: H2936-2943, 2001.
DELL’ITALIA LJ, SANTAMORE WP: Can indices of left ventricular function be applied to the right ventricle? Prog Cardiovasc Dis40: 309-324. 1998.
EUCKER SA, LISAUSKAS JB, SINGH J, KOVACS SJ: Phase plane analysis of left ventricular hemodynamics. J Appl Physiol90: 2238-2244, 2001.
GILLEBERT TC, LEITE-MOREIRA AF, DEHERT SG: The hemodynamic manifestation of normal myocardial relaxation - a framework for experimental and clinical evaluation. Acta Cardiol52: 223-246, 1997.
LEEUWENBURGH BPJ, STEENDIJK P, HELBING WA, BAAN J: Indexes of diastolic RV function: load dependence and changes after chronic RV pressure overload in lambs. Am J Physiol 282: H1350-H1358, 2002. LEITE-MOREIRA AF, CORREIA-PINTO J: Load as an acute determinant of end-diastolic pressure-volume relation.
Am J Physiol Heart Circ Physiol280: H51-H59, 2001.
LEITE-MOREIRA AF, GILLEBERT TC: Non-uniform course of left ventricular pressure fall and its regulation by load and contractile state. Circulation90: 2481-2491, 1994.
LEITE-MOREIRA AF, CORREIA-PINTO J, GILLEBERT TC: Afterload induced changes in myocardial relaxation: a mechanism for diastolic dysfunction. Cardiovasc Res43: 344-353, 1999a.
LEITE-MOREIRA AF, CORREIA-PINTO J, GILLEBERT TC: Load dependence of left ventricular contraction and relaxation. Effects of caffeine. Bas Res Cardiol94: 284-293, 1999b.
LEITE-MOREIRA AF, CORREIA-PINTO J, GILLEBERT TC: Diastolic dysfunction and hypertension. N Engl J Med
344: 1401-1402, 2001.
MORRIS JJ 3rd, PELLOM GL, HAMM DP, EVERSON CT, WECHSLER AS: Dynamic right ventricular dimension. Relation to chamber volume during the cardiac cycle. J Thorac Cardiovasc Surg91: 879-887, 1986.
POULEUR H, LEFEVRE J, VAN MECHELEN H, CHARLIER AA: Free-wall shortening and relaxation during ejection in the canine right ventricle. Am J Physiol239: H601-H613, 1980.
REDINGTON AN: Right ventricular function. Cardiol Clin20: 341-349, 2002.
SANTAMORE WP, DELL’ITALIA LJ: Ventricular interdependence: significant left ventricular contributions to right ventricular systolic function. Prog Cardiovasc Dis40: 289-308, 1998.
SHINTANI H, GLANTZ SA: The left ventricular pressure-volume relation, relaxation and filling. In: Left Ventricular Diastolic Function and Heart Failure. WH GAASCH, MM LEWINTER (eds). Lea & Febiger, Philadelphia, PA, 1994, pp 57-88.
VASAN RS, BENJAMIN EJ: Diastolic heart failure - no time to relax. N Engl J Med344: 56-59, 2001.
WEISFELDT ML, FREDERIKSEN JW, YIN FCP, WEISS JL: Evidence of incomplete left ventricular relaxation in the dog. J Clin Invest62: 1296-1302, 1978.
Reprint requests