M
ASTER OF
S
CIENCE
F
INANCE
M
ASTER
F
INAL
W
ORK
D
ISSERTATION
E
ARNINGS
M
ANAGEMENT AND
A
CQUIRERS
P
RECEDING
A
CQUISITIONS IN
E
UROPE
M
ASTER OF
S
CIENCE
F
INANCE
M
ASTER
F
INAL
W
ORK
D
ISSERTATION
E
ARNINGS
M
ANAGEMENT AND
A
CQUIRERS
P
RECEDING
A
CQUISITIONS IN
E
UROPE
G
ONÇALO
J
OSÉ DE
A
MARAL
C
ARDOSO
C
HARNECA
C
OELHO
SUPERVISOR:
Resumo
O presente estudo analisa o comportamento por parte de empresas europeias
cotadas e não cotadas quanto à prática de gestão de resultados. A amostra é constituída
por 409 empresas adquirentes que anunciaram e completaram negócios de fusões e
aquisições entre 2009 e 2016. Das 409 transações completadas, 29% dizem respeito a
pagamentos em ações, enquanto 71% configuram pagamentos em dinheiro. Os accruals
foram estimados através da versão modificada do modelo de Jones, de forma a poder ser
obtida a componente de accruals discricionários como medida de gestão de resultados. A
amostra testada englobou 400 empresas adquirentes, e 400 empresas match que não
participaram em negócios de fusões e aquisições durante o período da amostra. Os
resultados obtidos mostram uma fraca evidência quanto ao facto de os gestores
manipularem os resultados no sentido ascendente, durante o período anterior à data do
anúncio da transação. Estes resultados parecem estar em linha com os obtidos por
Erickson & Wang (1999) e Koumanakos et al. (2005) em que não houve uma antecipada
gestão de resultados por parte das empresas adquirentes que pagaram fusões e aquisições
em dinheiro.
Abstract
This study examines the behavior of European listed and non-listed firms in terms
of earnings management practices. The sample is composed by 409 acquirers which have
announced and completed M&A deals between 2009 and 2016. From the 409 completed
transactions, 29% of them concern stock payments, while 71% of them concern cash
payments. The accruals were estimated via the modified version of Jones model in order
to obtain the component of discretionary accruals, the main proxy for earnings
management. The tested sample considered 400 acquirers combined with the respective
400 matching firms that have not participated in M&A deals during the sample period.
The results provide weak evidence that managers manipulate earnings upwards in the
period prior to their M&A announcements. These findings seem to approach those of
Erickson & Wang (1999) and Koumanakos et al. (2005) for which pre-merger earnings
were not managed by cash acquirers.
Acknowledgements
I would like to address my first words to Professor Tiago Gonçalves for his
unconditional support and permanent availability throughout this period. I must refer that
when I started elaborating this masters’ dissertation, I had no knowledge of the subject I
was about to work at. However, due to his skills, patience, resilience, ability to provide
worthwhile solutions and extraordinary guidance, I could feel more confident and
motivated to finish this dissertation with success. For all these reasons, I would like to
thank him.
My second acknowledgement could not be addressed to any other person than
Cristina, my girlfriend. She always helped me in the critical stages of my Masters, and
also delivered the necessary confidence for the next steps I had to take. She was absolutely
essential in this path, always providing me with love, confidence, positivism and energy.
For that, I would like to thank her.
My third acknowledgement goes to my family, in particular to my parents and
sister. Their love, patience and willingness to make me successful have been key factors
during my academic and professional progress. For them, I must give my special thank
you words.
My fourth acknowledgement goes to my childhood friends, Marta and Fábio, for
their never ending support and confidence. It also goes to my other close friends that have
accompanied me in this journey.
Lastly, I would like to give a special acknowledgement to my job colleagues from
Index
Resumo ... i
Abstract ... ii
Acknowledgements ... iii
List of tables ... vi
Abbreviations and acronyms ... vii
1. Introduction ... 1
2. Literature Review ... 4
2.1. Earnings management literature ... 4
2.2. Motives behind earnings management ... 5
2.3. Earnings management on mergers and acquisitions ... 6
2.4. M&A methods of payment ... 7
3. Model Determinants ... 9
3.1. Firm Size ... 10
3.2. Firm Performance (ROA)... 10
3.3. Firm Sales Growth ... 11
3.4. Firm Leverage ... 12
3.5. Firm Country Gross Domestic Product Growth ... 13
3.6. Publicly Listed Firm ... 13
3.7. Firm Audit Quality (Big4) ... 14
4. Research Question ... 15
5. Earnings Management ... 16
5.1. Earnings measure and total accruals ... 16
5.2. Detecting earnings management ... 16
6. Research Methodology and Data ... 17
6.1. Sample ... 17
6.2. Methodology ... 19
6.2.1. Application of Modified Jones Model ... 19
6.2.2. Variables description ... 20
6.2.3. Empirical models ... 21
6.3. Data ... 24
6.3.1. Descriptive statistics ... 24
6.3.2. Correlation matrix ... 25
7. Results ... 25
8.1. Conclusions ... 28
8.2. Limitations ... 30
8.3. Suggestions for future researches ... 31
References ... 32
List of tables
Table 1 - Empirical relationship between the determinants and earnings management .. 9
Table 2 - Sample of acquirers ... 19
Table 3 - Determinant variables (measured 1 year before the deal announcement) ... 20
Table 4 - Model equations (RDA and ADA) ... 22
Table 5 - Summary of variables ... 24
Table 6 - Pearson (Spearman) correlation matrix ... 40
Table 7 - Summary measures of discretionary accruals (scaled by lagged total assets) 41 Table 8 - Regression of real discretionary accruals on the pool of acquirers and matches ... 42
Table 9 - Regression of absolute discretionary accruals on the pool of acquirers and matches ... 44
Abbreviations and acronyms
ADA – Absolute Discretionary Accruals
Big4 – The 4 most reputable auditing firms: Deloitte, EY, KPMG and PwC
BvD – Bureau Van Dijk, a business information provider
CFO – Chief Financial Officer
EU28 – European Union at 28 countries
IAS – International Accounting Standards
IFRS – International Financial Reporting Standards
M&A – Mergers and Acquisitions
NACE – “ Nomenclature statistique des activités économiques dans la Communauté
européenne ”
OLS – Ordinary Least Squares, a statistical regression method
RDA – Real Discretionary Accruals
ROA – Return on Assets
ROE – Return on Equity
UK – United Kingdom
1. Introduction
Mergers and acquisitions are corporate action events which determine the
restructuring and concentration of firms with the purpose of broadening their activities
and, by extension, their market position (Vazirani, 2015). The goal of this type of
operations is to increase the corporations’ influence, hence helping them to be powerful,
profitable, competitive, and wealthy to shareholders as much as possible (Petmezas et al.,
2010). Concretely, M&A transactions impact the market structure, in particular if they
drive or tend to a formation of monopolies, oligopolies, or to an equivalent situation of
market power (Andrade et al., 2001). In turn, managers can find in M&A a worthwhile
chance to obtain potential efficiencies, wider market visibility and more competitive
strategies for their firms, as well as it constitutes an opportunity to build managers’
personal empire (Terjesen, 2009).
By a simple definition, a merger occurs when a firm agrees on becoming part of
another firm through the incorporation of all their assets and liabilities, all vested into a
single entity (Terjesen, 2009; Vazirani, 2015). To do so, the board of directors from both
the merging and the merged firm agree on a price, giving the target shareholders the
voting decision to approve or decline the merger proposal (Offenberg & Pirinsky, 2014).
If the proposal is approved, the merged firm consequently ceases to exist and only the
merging one remains on the market with the same name and entity (Hillier et. al, 2013).
A consolidation is an alternative way of combining two or more firms and their
respective activities. It is nearly the same concept of merger, with the difference that the
involved firms get dissolved in order to allow the creation of a brand new one (Gaughan,
An acquisition (also commonly called a “takeover”) is defined by Vazirani (2015,
pp. 4) as “a corporate action in which a firm buys most, if not all, of the target firm’s
ownership stakes in order to assume control of the target firm”. Bidders (i.e.: acquirers)
can either opt to acquire the targets’ assets or shares, depending on the takeover objective
(Hillier et. al, 2013). If the bidder is about to acquire the target’s assets, a proxy formal
vote from the target shareholders is required (Hillier et. al, 2013). Otherwise, if the goal
is to take control of the target firm via equity, the target shareholders are requested to
respond to the corporate action on the market, launched by the bidder, by sending
voluntary instructions on their eligible stock positions to the correspondent custodian, up
to a specific deadline, whose options are either accept (i.e.: tender) or decline (i.e.: ignore)
the offer. Rather than participating in the offer, the shareholder may opt to sell his position
on the open market during the offer period (Groves, 2008). The offer is as well succeeded
as the quantity of tendered positions fulfilled and satisfies the initial bidder’s intention,
usually described in the prospectus (i.e.: the offer document). The bidder might assume
the commitment to purchase a certain percentage of outstanding shares, and, additionally,
that it will only accept the tendered shares if a minimum tendered stock positions have
been reached (Hillier et al., 2013).
It is notorious that M&A have been largely approached by a variety of academics,
economists, financiers, regulators and accountants worldwide, who relate it to different
contexts. In this paper, M&A deals are contextualized with earnings management because
of the close relationship they seem to have, as vastly demonstrated in the literature.
Due to a considerable number of financial scandals that have occurred over recent
years, mostly in Europe and US, the role of capital markets has been seriously questioned
earnings management practices and to the quality of earnings reported. With this, earnings
management has been applied to important areas of accounting and finance due to an
increased importance in explaining managerial choice associated to market phenomena.
This paper investigates the market trend upon M&A deals in Europe and aims to
relate it to the level of accruals reported by acquirers after the subprime crisis. Even
though the most remarkable studies which combine M&A and earnings management take
place in US (Erickson & Wang, 1999; Heron & Lie, 2002; Louis, 2004) and UK (Botsari
& Meeks, 2008; Vasilescu & Millo, 2016), there are no studies applied to the EU28 as a
whole. For that reason, this paper provides an additional contribute to the extant literature,
as well as a suggestion for further investigations.
In the research methodology, I analyzed a sample of 409 deals in order to test
whether earnings management was ahead of M&A announcements. My findings were not
consistent with this prediction, suggesting that acquirers have not anticipated their deals.
The body of this paper is segmented in seven parts. In the next chapter, the
literature review introduces the subject to be studied henceforth. In the third chapter are
described the model determinants which support this study. The fourth chapter provides
the hypothesis of study to be tested. The fifth chapter defines the earnings management
measures and its method of estimation. The sixth chapter describes the research
methodology and used data. The seventh chapter presents the results and the inherent
analysis. Finally, the eighth chapter enunciates the main conclusions, limitations and
2. Literature Review
2.1. Earnings management literature
A gentle definition of earnings management is suggested by Pungaliya & Vijh
(2009). In their exact words, earnings management consists in “inflating or deflating
accruals and charges within generally accepted accounting principles”(pp. 2). Healy &
Wahlen (1999) and Lo (2008) are more assertive at describing this concept, who define
earnings management as the deliberated willingness to skew the stakeholder’s perception
about the reported statements. Even assuming that managers who engage in earnings
management do not have an actual willingness to provoke losses to shareholders, it is
difficult to foresee that such will not occur. In order to mitigate misinformation, financial
experts are nowadays more demanded to detect earnings quality on behalf of most
investors. Since it is expected that financiers have the necessary skills to analyze the
accuracy of statements and to detect imprecisions, they should therefore contribute in a
positive way to a better and fairer market (Dechow & Schrand, 2004).
Teoh et al. (1998) believe that managers will find high incentives to manage
earnings if their firms intend to sell shares on the market in the near future. Given this,
the earnings quality decreases because the reported earnings do not reflect the actual firm
performance. This issue is notorious because mainly shrewd investors are able to detect
earnings quality, which causes information asymmetry for the rest of investors. It is then
perceived that when firms present a high quality of earnings, the interested parties take
informed decisions and thus the market becomes more efficient (Dechow et al., 2010).
Nevertheless, De Jong et al. (2014) found evidence that financial analysts and CFOs are
in agreement for considering that earnings have to be managed in order to make firms
credibility in the market in order to sustain or inflate the stock valuation of firms (Graham
et al., 2005).
2.2. Motives behind earnings management
Lo (2008) is relentless in stating that managers are not naive when they manage
earnings because they always have an intention to obtain a personal profit or an intention
to mitigate losses their firm may have had. Throughout the years, researchers have
investigated and largely discussed the motives that possibly explain managers’ behavior.
Some of the most common motives are presented below.
- Capital market expectations
Once managers are influenced by the expectation that investors create on their
firms, they are likely to manage earnings in order to raise the stock price and so to
maintain the necessary confidence from investors (Healy & Wahlen, 1999). Nonetheless,
managers will be extra-motivated to manage earnings if stock prices and compensation
incentives are strongly correlated, as evidenced by Bergstresser & Phillipon (2006).
- Contractual incentives
Burgstahler & Dichev (1997) argue that firms which show great performances
attract stakeholders at many levels. Firstly, if the firm demonstrates a prosperous guise, it
is likely that customers will not bother to pay higher for goods. In the same way, great
performers have the advantage that suppliers or lenders can ease and extend the payment
dates due to giving the impression that managers are able to accomplish with the
celebrated commitments.
- Bonuses plans
Rahman et al. (2013) attains that managers tend to manipulate earnings due to
the firm. Gaver et al. (1995) and Holthausen et al. (1995) found evidence that managers
often use accounting techniques to diminish or enhance earnings, depending on the
bonuses they might receive. The main idea is, if the firm’s income surpasses the
maximum (minimum) limit of bonuses attributable, managers will then reduce (raise) that
income because they find it worthless to report their earnings higher (lower) without
receiving any further compensation for that. Nonetheless, in order to misguide
opportunism, it is recommended that firms, namely through their board of directors, adopt
plans that promote a long-term performance, rather than a short-term one, since it best
suits the shareholders’ interests. As proven in former studies, a long-term policy seems
effective in reducing the managers’ incentive to manipulate earnings (Richardson &
Waegelein, 2002).
2.3. Earnings management on mergers and acquisitions
When firms trace corporate strategies to enhance their value, many interests arise.
In M&A deals, an acquirer has special interest in issuing stock when the current stock
price is above the fair value (Erickson & Wang, 1999; Botsari & Meeks, 2008). Managers
perceive that the higher the stock price of their firm, the lower the costs of financing a
merger (because a less number of shares will have to be issued to the target). Being the
case, there is a wide incentive in paying stock and small incentive in paying cash when
the stock prices are overvalued.
From their complete sample of 119 US firms amongst 1985-1990, Erickson &
Wang (1999) evidenced that 55 stock acquirers showed abnormal accruals before M&A,
which indicates earnings management practices. On the other hand, no evidence of
earnings management practices for the remaining 64 cash acquirers was found. After that,
sample of 120 deals in Malaysia, Rahman & Baka (2003) found that stock acquirers
manage earnings upwards between 1991 and 2000. One year later, Louis (2004) took the
same conclusions for a sample of 373 deals in US during 1992 and 2000, suggesting that
stock payments reflect earnings manipulation, contrarily to cash payments. Similarly,
Botsari & Meeks (2008) are able to find the same evidence on 176 UK firms during 1997
and 2001, posing that stock swap deals suggest earnings manipulation before the M&A
year of announcement. More recently, Higgins (2013) demonstrates that 125 Japanese
stock-acquirers also anticipate M&A deals in about 1 year through earnings manipulation.
Regarding the market performance, Louis (2004) argues that there is no advantage
for acquirers to manage pre-merger earnings since it is negatively correlated with
post-merger performance, being that acquirers who choose stock to finance the M&A deal do
experience a negative performance in the long-run. That is, assuming a rational situation
in which the market anticipates potential earnings manipulation, being real or not, it is
expected that investors will naturally discount this factor to the firm’s value. So, even if
managers effectively manage earnings upwards, there will be no correlation. From Louis’
(2004) perspective, this is evident except for cases that investors can assess the extent of
earnings management and thus are able to make accurate judgments.
2.4. M&A methods of payment
In M&A transactions, the bidder must propose the method of payment to be used
into the offer prospectus, whose document is always subject to approval by the market
authorities. Huang et al. (2016) assumes that the deal is commonly financed via cash,
stock (through a specific exchange ratio), or through a combination of both. However, the
underlying implications of choosing one of these means of payment are evaluated by
concerns for target shareholders is the tax influence in their tender decisions. If the bid is
on equity, target shareholders can defer taxes on time, in the sense that they are not
required to declare any potential capital gains until the moment they decide to sell their
position (Franks et al., 1988). If the bid is on cash, capital gains have to be promptly
declared to the due fiscal authority upon the receipt of proceeds (Franks et al., 1988).
Even assuming that tax benefits may arise with stock payments, indeed cash payments
provide an immediate liquidity, as well as eliminate moral hazard problems if the bidder
has its voting control highly concentrated. As such, target shareholders may prefer cash
in order to avoid becoming minority shareholders of the new firm (Faccio & Masulis,
2005). On the other hand, the referred authors indicate that the bidder is more reluctant to
distribute stock when the target firm is composed by highly concentrated ownerships. In
that case, the acquirer’s voting control is threatened as it will have to be shared with
target’s shareholders when the merger becomes effective.
Another point to take into consideration is the possible asymmetric information
amongst the involved parties. Franks et al. (1988) believe that when one firm is more
informed than the other, opportunist acts might happen. On this, the authors enunciate
two distinct visions. Firstly, acquirer and target firms are especially interested to
participate in the acquisition when the market quotation from both is overvalued at the
time. Secondly, assuming that the operation is financed in stock, the acquirer will be bided
down by the target, in special if the target firm has issued shares very recently. Myers &
Majluf (1984) and Heron & Lie (2002) explain that the takeover will be preferably paid
3. Model Determinants
In this chapter, the seven model determinants which have already been tested in
previous research works are described, relatively to the empirical relationship with
earnings management. Table 1 provides a summary of each variable and its positive or
negative association with earnings management.
Table 1 - Empirical relationship between the determinants and earnings management
Negative association with
Earnings Management
Positive association with Earnings Management
Firm Size
Peasnell et al. (2000); Banderlipe (2009); Gerayli et al. (2011); Alzoubi (2016)
Chen et al. (2007); Gulzar & Wang (2012); Alves (2013)
Firm Performance
Louis (2004); Gulzar & Wang (2012); Gill et al. (2013); Higgins (2013); Alves (2013)
Firm Sales Growth
McNichols (2000); Pungaliya & Vijh (2009); Higgins (2013)
Firm Leverage
Peasnell et al. (2000); Park & Shin (2004); Alzoubi (2016)
Sweeney (1994); Gerayli et al. (2011); Gulzar & Wang (2012); Alves (2013); Higgins (2013)
Firm GDP Growth Higgins (2013)
Firm Listed on the Stock Exchange
Burgstahler et al. (2006);
Hope et al. (2013) Liu & Lu (2007)
Firm Audit Quality
Kinney & Martin (1994); Francis et al. (1999); Davidson et al. (2005); Botsari & Goh (2014); Alzoubi (2016)
3.1. Firm Size
In light of the positive theory, Watts & Zimmerman (1986) underline the role that
firms play on the managerial accounting choice. For this effect, the authors enunciate the
firm size hypothesis, which, in their words, means that “ceteris paribus, the larger the
firm, the more likely the manager is to choose accounting procedures that defer reported
earnings from current to future periods” (pp. 235).
Regarding an M&A transaction, when acquirer and target firms are very different
in terms of size, acquirers do not feel a strong incentive to manage earnings, because the
economic benefit would be quite insignificant. In contrast, it would be of interest for the
acquirer to manage earnings in case that the target size is closer to acquirer’s (Erickson
& Wang, 1999; Higgins, 2013).
Even though certain literature has found a negative association between large
firms and the level of discretionary accruals (Peasnell, 2000; Banderlipe, 2009),
alternative literature (Chen et al., 2007; Alves, 2013) have found an inverse evidence. The
positive correlation might possibly be explained by the fact that highly sized firms tend
to alter their reports upward when pressured to satisfy the investors’ expectations. On the
other hand, highly sized firms are more likely to be kept under vigilance, hence being less
flexible to manage earnings (Higgins, 2013). Because there is an apparent contrast in the
literature and given the above explained arguments, SIZE can either assume a positive or
a negative coefficient. This variable is calculated through the natural logarithm of firm’s
total assets in the year preceding the M&A announcement.
3.2. Firm Performance (ROA)
It is perceived that a considerable number of investors (mainly the “buy-and-hold”
In financial terms, the most attractive firms are those which do generate better returns.
For the effect, ROA is used to evaluate the firm’s performance. Like Kothari et al. (2005)
explains, ROA serves as an important financial indicator to compare the effectiveness of
performance matching within an industry. Former studies find a negative association
between performance and discretionary accruals (Higgins, 2013; Alves, 2013), which
demonstrate that firms with positive returns are less tempted to manage earnings due to
having fewer pressure than other firms with negative returns. For this reason, a negative
sign is expected in the model’s coefficient. ROA is measured as the net income scaled by
the total assets in the year preceding the M&A announcement.
3.3. Firm Sales Growth
Once executed, sales are immediately recognized in the income statement, more
concretely on the operating revenue. However, it may happen that some of the sold
products may not be wholly profitable to the firm because of unpredicted circumstances
over time (e.g.: lack of payment from the counter-party, devolution of the product and
(or) incurred costs in warranties). In such cases, a difference in value is expected between
the recorded sales and the recorded receivables. Thus, sales are sometimes viewed as a
doubtful parameter in terms of quality for the presented facts, as it only takes into
consideration the sold value at the time and hides other potential associated costs. The
literature found evidence that overoptimistic stock-for-stock acquirers increase their
inventory levels, which result in positive earnings management around M&A. This
pattern leads to a situation in which managers expect a paced growth, even if the operating
capability is not aligned with the growth expectation (Louis, 2004). Hence, it is likely that
the higher the sales growth expectations, the higher the incentive to manage earnings
predictably positive. SALESGR is measured as the 2-years compounded annual sales
growth rate in the year preceding the M&A announcement.
3.4. Firm Leverage
The leverage is a crucial topic to evaluate how much debt a firm is consuming
from its assets and how this issue is perceived by investors. Debt indicators take a major
importance not only to the firm itself, but also to the counter-parties involved in debt
contracts (e.g.: lenders, suppliers and other debt facilitators). Former studies suggest that
leveraged firms pretend to boost their financial outcomes in order to continue being
attractive to creditors, as well as to smooth the pressure relatively to the contracts that
were celebrated until then (Burgstahler & Dichev, 1997; Ali et al., 2008; Alves, 2013).
Another aspect to be considered is the target’s leverage and potential conflicts
during and after the acquisition process. In this sense, the acquirers must manage the risk
of buying stake from highly leveraged target firms, as the target creditors have claiming
rights with the target firm (which will be transferred to the acquirer once the deal is
effective). For the acquirer, it is important not only to mitigate conflicts with creditors,
but also to understand if total assets and total liabilities of the target firm are stable and
under control. Thus, if the target is in a bad financial situation, the acquirer’s willingness
to manage earnings will be higher in order to buffer potential losses in the future (Higgins,
2013).
Despite the above arguments, the literature seems to lodge controversial facts.
While recent studies from Alves (2013) and Higgins (2013) proved that leverage was
positively associated to earnings management, alternative studies from Peasnell et al.
(2000) and Park & Shin (2004) found leverage as negatively signed. For all the above
tests. The debt-to-asset ratio is used as a proxy for this variable in the year preceding the
M&A announcement.
3.5. Firm Country Gross Domestic Product Growth
The macro-economic situation in which an acquirer is inserted may also take
influence on its investment decisions. In Europe, it is known that upon its creation, the
European Central Bank has been conducting a monetary policy around the price stability,
namely by shielding inflation rates up to 2% for all the countries which adopted and
maintain the common currency. Even under a same monetary policy, countries are not
equal in terms of GDP growth nor in internal policies which drive their own economy. In
turn, firms may feel an incentive to manage earnings during growth environments
(especially during “booms”) because managers believe they need to reach adjusted
performances, so to follow business goals and market trends (Wang et al., 2010; Higgins,
2013). Accordingly, the expected association between this variable and earnings
management is positive. GDPGR is measured as the growth rate in EU28’s real seasonally
adjusted GDP in the year preceding the M&A announcement.
3.6. Publicly Listed Firm
Healy & Wahlen (1999) highlight that managers are motivated to manage
earnings upward in order to correspond to investors’ market expectations. As investors
create expectations based on fundamentals – although the technical analysis is very
important too – these wish to have access to reliable financial information in order to
evaluate an investment with a relative degree of certainty. Listed firms are pressured to
exhibit even more accurate and detailed reports than non-listed firms, mainly due to their
market reputation, but also due to audit questions and subsequent requirements to meet
(2006) and Hope et al. (2013) suggest a disincentive to manage earnings and corroborate
with the above argument, Liu & Lu (2007), on the other hand, shows a different
perspective about China’s environment. In there, the motives that favor earnings
management practices are mainly linked to market requirements, where there is a heavy
pressure on listed firms to achieve very specific goals. According to the authors, China’s
listed firms must maintain ROE at a minimum percentage of 6% for three consecutive
years in order to continue listed, besides the fact that listed firms get de-listed once they
report net losses for three consecutive years.
Excluding the China’s case where the incentives to manage earnings are
motivated by a higher pressure, the LIST’s sign is predictably negative. This variable is
represented by a dummy, assuming a value of 1 if the firm is listed on the stock market
and 0 if otherwise.
3.7. Firm Audit Quality (Big4)
In their study, Kinney & Martin (1994) enunciated that good audit practices
reduce bias reporting and, in extent, the likelihood of earnings manipulation is lessened.
However, as not all auditing is of high quality, investors are likely to trust more in a firm
whose financial statement is assured by a reputable auditor, such as by one of the Big4
auditors. Because of their size, expertise and independency, these are recognized across
the market as being very important agents on the goal of promoting accurate accounting
reports. The reasons which make Big4 auditors be more recommended than non-Big4
auditors are the strong and sophisticated techniques to find out misinformation. In
comparison, it is predicted that they have more and better internal resources, such as
higher qualified human capital and better technological means than their competitors
and embrace valuable projects, which allow them to have an easier access to funds and
solidify their market power (Alzoubi, 2016). Reasonably, if discretionary acts are more
likely to be detected and prevented by a Big4 auditor, then a negative relationship between
them is expected. Represented by a dummy variable, BIG4 will assume a value of 1 if the
acquiring firm is audited by a Big4 auditor and 0 if otherwise.
4. Research Question
When an acquirer decides to move on with an M&A transaction, it has to decide
which mean of payment will sustain the bid. Even though some firms may be relatively
liquid, they may decide not to limit their treasury resources – instead, they may opt to use
alternatives in order to accomplish with their investment desires. As previously
demonstrated in the literature, cash transactions do not denunciate earnings management
practices and so far do not represent an incentive for acquirers like stock swaps do
(Erickson & Wang, 1999; Botsari & Meeks, 2008; Higgins, 2013). Having said that, it is
predicted that an acquirer is likely to propose stock as a possible mean of payment,
especially when its share price is overvalued. Furthermore, if the acquirer has incurred in
earnings management practices over time, it will feel an extra incentive to finance the
deal via stock, presumably to benefit of a more favorable exchange ratio and, thus, a less
costly operation.
H1.It is predicted that acquirers manage earnings upward one fiscal year before the deal
5. Earnings Management
5.1. Earnings measure and total accruals
By definition, earnings are no more than the sum of accruals and operating cash
flows for a relative period of time. In general, the literature concludes that the quality of
earnings rely directly on the accruals’ measurement, more concretely whether accruals
are reported with a high level of accuracy. Dechow & Schrand (2004) understand that
since cash movements can be observed and reported as a result of the normal business
activity, they are harder to be manipulated. On the other hand, as accruals are based on
estimations, they are more uncertain and presumably less reliable than cash flows.
According to the literature, accruals are divided in non-discretionary and discretionary
ones. The difference between both accrual types is that non-discretionary accruals can be
verified and measured by reflecting business conditions. Contrarily, discretionary
accruals are hardly measured and reflects the possibility that managers have to make
accounting choices with a relative degree of freedom. For those reasons, discretionary
accruals are often linked to earnings management practices due to raising more suspicions
than non-discretionary accruals.
5.2. Detecting earnings management
Both the original and the modified Jones model are commonly used in the
literature as the main metrics to detect earnings management practices in firms. The
modified model is seen as more complete and powerful than the original one because it
includes the receivables variance in the calculation of accruals (Dechow et al., 1995).1 In
1TA
it /Ait-1 = ⍺ (1 / Ait-1) + β1(∆REVit - ∆RECit / Ait-1) + β2 (PPEit / Ait-1) + εit , where: TAit = total accruals of firm i
in year t, scaled by lagged total assets (Ait-1);⍺, β1, β2= OLS estimated parameters; ∆REVit = change in operating
revenues, scaled by lagged total assets (Ait-1); ∆RECit = change in receivables, scaled by lagged total assets (Ait-1);
accordance, the modified version will be used in the present study, similarly to other
studies (Pungaliya & Vijh, 2009; Linck et al., 2013). The total accruals scaled by the
lagged total assets is the dependent variable of the model. All independent variables
represent the non-discretionary accruals, whereas the regression’s residuals (ε) represent
the discretionary component, which is assumed as a proxy for earnings management
(Dechow et al., 1995, following Jones, 1991).
6. Research Methodology and Data
6.1. Sample
The data of the sample was downloaded in September of 2016 through the
combination of two databases, Amadeus and Zephyr, both belonging to BvD, a business
information provider. I used Amadeus database to search for all firms from EU28 that
were involved in mergers and acquisitions from 2009 until the last available year, 2016.
The searched firms are all consolidated ones, in order to analyze accounts ruled by the
same reporting standards. As commonly done in previous research, all firms related to
NACE Sector K (Financial and Insurance Activities) and NACE Sector O (Public
Administration and Defense; Compulsory Social Security) were excluded of the sample,
mainly because of reporting differences relatively to firms from other sectors, higher
complexity in their accounting standards and other intrinsic particularities that make them
peculiar. The resulting firms were crossed with Zephyr database, wherein was collected
the list of completed deals during 2009 and 2016, referring both acquirer and target firms
in the process. From this list were only considered transactions paid via cash, stock, a
combination of both, or by at least one of these means of payment. Consistent with
Higgins (2013), all cross-border deals were excluded, a situation in which a target firm is
Amadeus and Zephyr software are owned by the same provider, the filter used to meet the
respective acquirers simultaneously in both databases was “BvD ID” (Bureau Van Dijk’s
Identifier), as it is assumed that this identifier is presumably not subject to changes,
contrarily to other possible matching criteria such as firm’s name (due to possible name
changes during the sample period), ISIN code or ticker (because not all firms of the
sample are, or were, listed). Moreover, because there were acquirers with more than one
completed deal, only the deal with the earliest announcement was included in the sample.
The objective is to assess the acquirer’s behavior in its very first acquisition intention,
hence eliminating possible retroactive effects that any of the subsequent announcements
could embed (Botsari & Meeks, 2008).Still, firms with lack of available information to
fulfil the key variables for the study were excluded too. The final sample is then composed
by 409 acquiring firms, which are spread by 17 principal industries and 8 deal
announcement years.
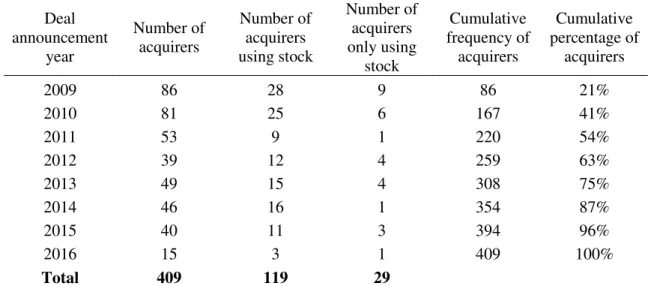
Table 2 describes the acquirers’ sample distribution, showing the number of
acquirers which used stock payments (partially or fully) to finance their deals over
different years. The majority of announcements occur in 2009 and 2010, the period
immediately followed by the subprime crisis, where 167 out of 409 acquirers effectively
initiated their acquisitions. From these 167 acquirers, only 53 of them have used stock as
a mean of payment, meaning that 114 acquirers preferred to finance their transactions via
cash or cash combined with other kind of payables that are not stock. Overall, there were
119 acquirers (about 29%) which used stock against 290 acquirers which used cash as the
Table 2 - Sample of acquirers Deal announcement year Number of acquirers Number of acquirers using stock Number of acquirers only using stock Cumulative frequency of acquirers Cumulative percentage of acquirers
2009 86 28 9 86 21% 2010 81 25 6 167 41% 2011 53 9 1 220 54% 2012 39 12 4 259 63% 2013 49 15 4 308 75% 2014 46 16 1 354 87% 2015 40 11 3 394 96% 2016 15 3 1 409 100%
Total 409 119 29
This table describes the sample acquirers over 8 deal announcement years, considering stock payments.
6.2. Methodology
6.2.1. Application of Modified Jones Model
The applied methodology is similar to the one used by Higgins (2013), in the sense
that it compares the level of discretionary accruals for the year immediately before the
deal announcement of an acquiring firm and of its best matching firm with available data.
The combination criteria for both the acquirers and their matches was done taking into
account EU28 firms of the same industry with similar characteristics in terms of size and
performance, in order to be correctly comparable. Ideally, the total assets of one firm in
relation to another could not be superior or inferior to 50%, as well as the return-on-assets
also needed to have the same sign and closest percentage amongst each other. Moreover,
the matched firm is unique and never repeated, meaning that it only combines with one
single acquirer throughout all the sample, as well as it cannot ever be an acquirer in a
different year of the sample. To calculate total accruals, some literature uses the balance
cash-flow method (Botsari & Meeks, 2008; Higgins, 2013). In this work, I opt to use the
balance sheet method2 essentially due to data availability.
In practice, I identified each acquirer and compared its level of accruals with the
industry-related firms with available data in the concurrent year. As a consequence, 96
modified Jones model regressions were run under the OLS method. In each regression
was chosen the firm that best suited the respective acquirer, considering the tight criteria
that there could not be any repeated firms, as well as the matched firms needed to be the
most similar in terms of size and performance relatively to their acquirers.
After concluding this process, each firm’s discretionary accruals was saved and
annexed to the RDA (Real Discretionary Accruals) variable, which is one of the
dependent variables of the principal cross-sectionally pooled models (described in table
4). From 409 acquirers, only 9 did not meet a firm of the same sector with similar
characteristics. Thus, 800 firms completed the pool of acquirers and matches, where half
are acquirers and the other half are matches.
6.2.2. Variables description
According to the earnings management literature, table 3 shows the determinant
variables and respective formulas to be applied in this study.
Table 3 - Determinant variables (measured 1 year before the deal announcement)
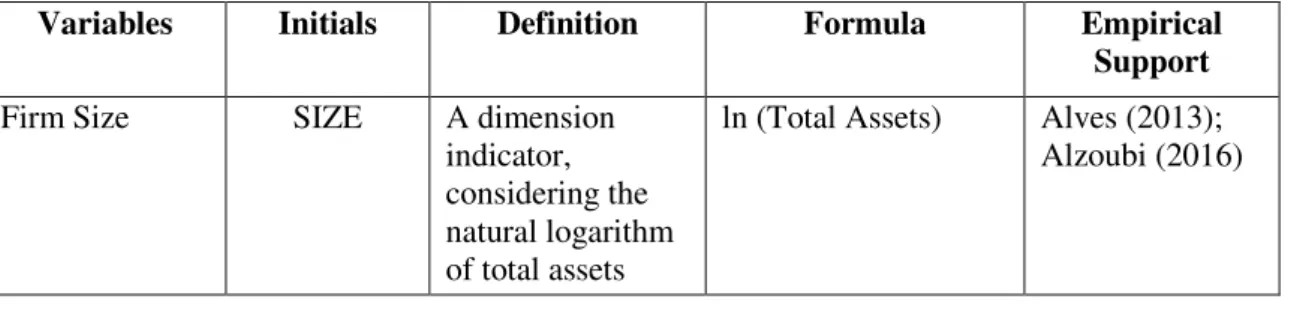
Variables Initials Definition Formula Empirical Support
Firm Size SIZE A dimension indicator, considering the natural logarithm of total assets
ln (Total Assets) Alves (2013); Alzoubi (2016)
2The balance sheet method to calculate total accruals is given by: TA
it= [∆ Current Assetsit - ∆ Cash and Cash
Equivalentsit] - [∆ Current Liabilitiesit - ∆ Short term financial debtit] - Depreciations and Amortizationsit , where:
TAit = total accruals of firm i in year t; ∆ Current Assetsit = difference between current assets in year t and t-1; ∆ Cash
and Cash Equivalentsit = difference between cash and cash equivalents in year t and t-1; ∆ Current Liabilitiesit =
Firm
Performance
ROA A performance indicator, considering the return-on-assets ratio
Net Income / Total Assets
Kothari et al. (2005); Higgins (2013); Alves (2013)
Firm Sales Growth
SALESGR n years
compounded sales growth of a firm
Louis (2004), Higgins (2013)
Firm Leverage LEV Level of firm leverage, considering the debt-to-asset ratio
Total Liabilities / Total Assets Higgins (2013); Alves (2013); Alzoubi (2016) Firm GDP Growth
GDPGR EU28 GDP performance (source: Pordata)
<no formula> Higgins (2013)
Firm Listed on the Stock Exchange
LIST Dummy: situation in which the firm is listed on the Stock Exchange
{1 = Firm is listed; Burgstahler (2006) {0 = otherwise
Firm Audit Quality
BIG4 Dummy: situation in which the firm is audited by Big4 auditor
{1 = Firm is audited by Big4;
Botsari & Goh (2014); Alzoubi (2016)
{0 = otherwise
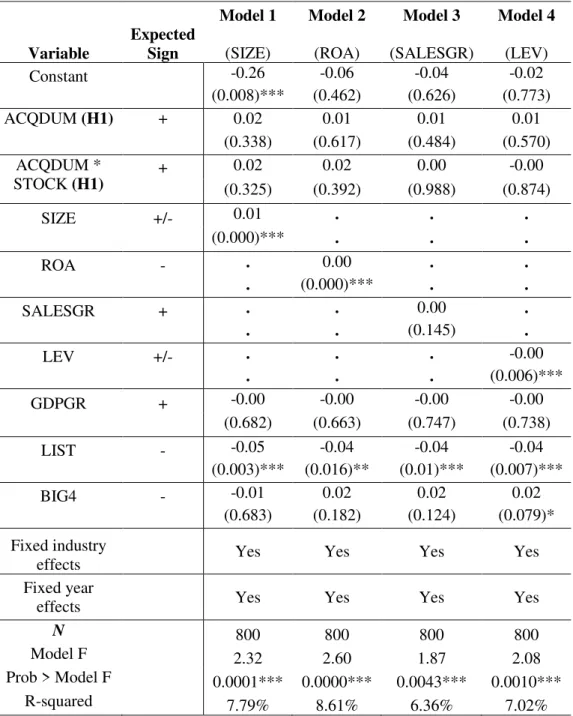
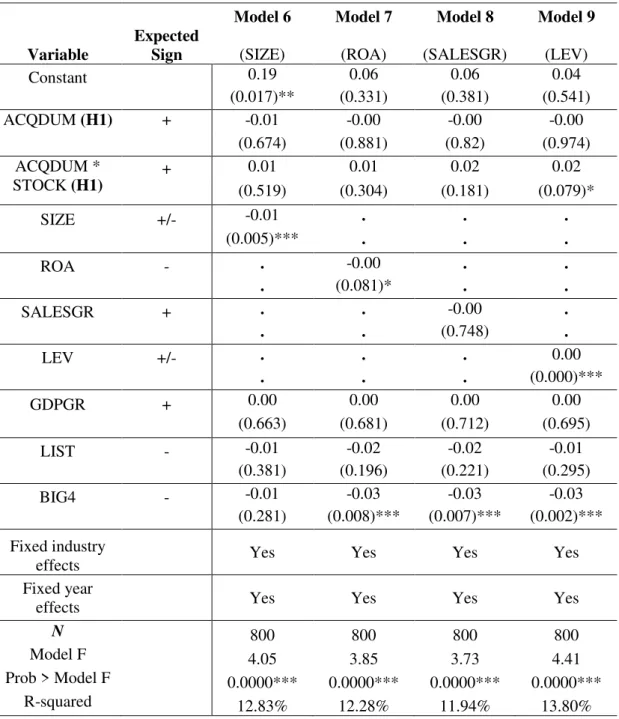
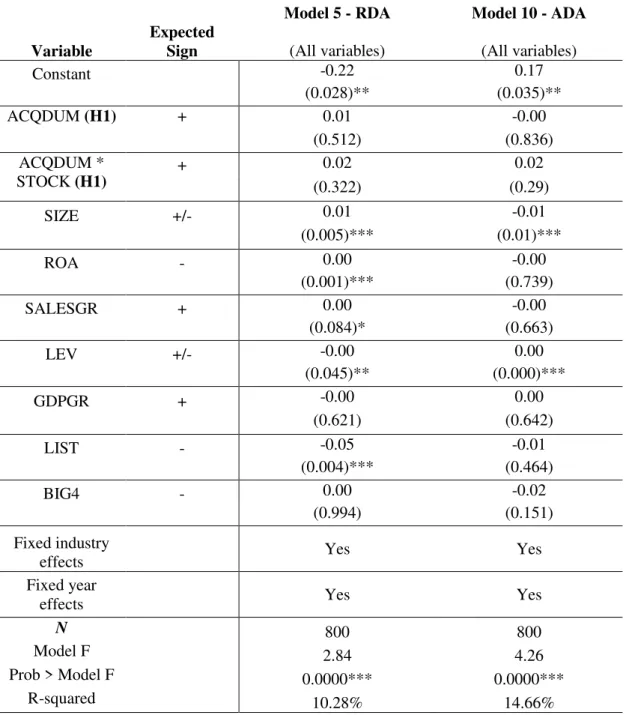
6.2.3. Empirical models
Since there is still a reasonable number of non-listed acquirers in the sample, this
study contrasts with extant studies of Japan (Higgins, 2013), UK (Botsari & Meeks, 2008)
and US (Erickson & Wang, 1999) which only analyze listed acquirers. All mentioned
authors have found evidence that stock-for-stock deals were effectively planned by
acquirers, proving that acquirers managed their earnings upward in a short period before
launching a bid. Hence, the present work aims to test whether European acquirers, which
decided to bid during the period of the subprime crisis until recently, also anticipated their
transactions through favorable accounting techniques. For the effect were created two
base models. In the first one, the dependent variable is RDA, whereas in the last one, the
dependent variable is ADA (Absolute Discretionary Accruals). The equations are shown
in table 4.
(𝑆𝑎𝑙𝑒𝑠𝑖𝑛𝑛
𝑆𝑎𝑙𝑒𝑠𝑖𝑛0)
1/𝑛
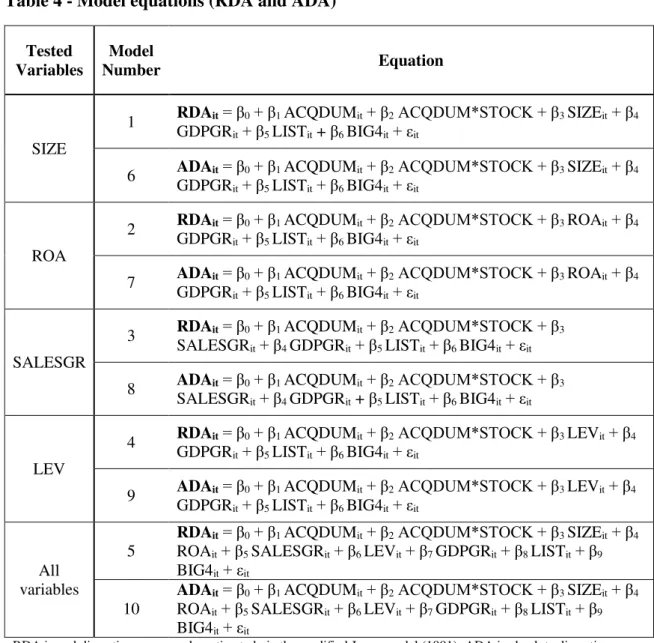
Table 4 - Model equations (RDA and ADA)
Tested Variables
Model
Number Equation
SIZE
1 RDAit= β0+ β1 ACQDUMit+ β2ACQDUM*STOCK + β3 SIZEit+ β4 GDPGRit+ β5 LISTit + β6 BIG4it+ εit
6 ADAit= β0+ β1 ACQDUMit+ β2ACQDUM*STOCK + β3 SIZEit+ β4 GDPGRit+ β5 LISTit+ β6 BIG4it+ εit
ROA
2 RDAit= β0+ β1 ACQDUMit+ β2ACQDUM*STOCK + β3 ROAit+ β4 GDPGRit+ β5 LISTit+ β6 BIG4it+ εit
7 ADAit= β0+ β1 ACQDUMit+ β2ACQDUM*STOCK + β3 ROAit+ β4 GDPGRit+ β5 LISTit+ β6 BIG4it+ εit
SALESGR
3 RDAit= β0+ β1 ACQDUMit+ β2ACQDUM*STOCK + β3 SALESGRit+ β4 GDPGRit+ β5 LISTit+ β6 BIG4it+ εit
8 ADAit= β0+ β1 ACQDUMit+ β2ACQDUM*STOCK + β3 SALESGRit+ β4 GDPGRit + β5 LISTit+ β6 BIG4it+ εit
LEV
4 RDAit= β0+ β1 ACQDUMit+ β2ACQDUM*STOCK + β3 LEVit+ β4 GDPGRit+ β5 LISTit+ β6 BIG4it+ εit
9 ADAit= β0+ β1 ACQDUMit+ β2ACQDUM*STOCK + β3 LEVit+ β4 GDPGRit+ β5 LISTit+ β6 BIG4it+ εit
All variables
5
RDAit= β0+ β1 ACQDUMit+ β2ACQDUM*STOCK + β3 SIZEit+ β4
ROAit+ β5 SALESGRit+ β6 LEVit+ β7 GDPGRit+ β8 LISTit+ β9
BIG4it+ εit
10
ADAit= β0+ β1 ACQDUMit+ β2ACQDUM*STOCK + β3 SIZEit+ β4
ROAit+ β5 SALESGRit+ β6 LEVit+ β7 GDPGRit+ β8 LISTit+ β9
BIG4it+ εit
RDA is real discretionary accruals, estimated via the modified Jones model (1991); ADA is absolute discretionary accruals, measured as the absolute value of RDA; ACQDUM is a dummy variable that assumes a value of 1 if the firm is an acquirer and 0 if it is a match; STOCK is a dummy variable that assumes a value of 1 if the firm is an acquirer which used stock as a mean of payment and 0 if it did not use stock at all, or if it is a match;
ACQDUM*STOCK is an interaction between acquirer and their stock payments in order to provide support to H1 ; SIZE is natural logarithm of total assets; ROA is return-on-assets ratio, measured in percentage; SALESGR is firm’s 2 years compounded sales growth in the 2 years before the announcement, measured in percentage; LEV is debt-to-asset ratio, measured in percentage; GDPGR is the growth rate of EU28 seasonally adjusted GDP in the year before the announcement, measured in percentage; LIST is a dummy variable that assumes a value of 1 if the firm is listed on the stock exchange and 0 if otherwise; BIG4 is a dummy variable that assumes a value of 1 if the firm is audited by a Big4 auditor and 0 if otherwise.
As previously referred, the RDA was estimated through the modified Jones model
for each acquirer and respective match firm in the year preceding the M&A
announcement. The purpose is to simultaneously measure the direction and dimension of
more than the absolute value obtained from the real discretionary accruals metric. In
ADA, only the earnings management’s dimension is able to be verified. In order to deepen
the statistical inference, five combinations were tested through the OLS method in a
cross-sectionally pooled model for each dependent variable. The variables ACQDUM,
GDPGR, LIST and BIG4 were kept permanent in every tested model, hence following
the literature which most approximates of this work.
All models were controlled by fixed effects, such as announcement year and
industry.
Year: created n-1 dummy variables according to the number of years of the
sample. This dummy takes the value of 1 if the firm had announced the deal in that year
and 0 if otherwise.
Industry/Sector: created n-1 dummy variables according to the number of years
of the sample. This dummy takes the value of 1 if the firm belongs to that sector and 0 if
otherwise.
The control of fixed effects per year is important due to possible economic and
financial conjectures that might have influenced firms to announce or void their
investment decisions in that year (e.g.: European debt crisis of 2012, which led to a
reduction of credit conditions and contagious lack of confidence). Furthermore, the
industry fixed effects aim to control particular circumstances of a given sector. Besides,
it is understood that in a competitive market, firms tend to follow their competitors. Since
that each industry has its own conditions and faces different trends (e.g.: in the last years,
the technology sector is expected to have had a faster pace than some other unrelated
sectors), a sectorial dummy serves to control potential intrinsic effects which may have
6.3. Data
6.3.1. Descriptive statistics
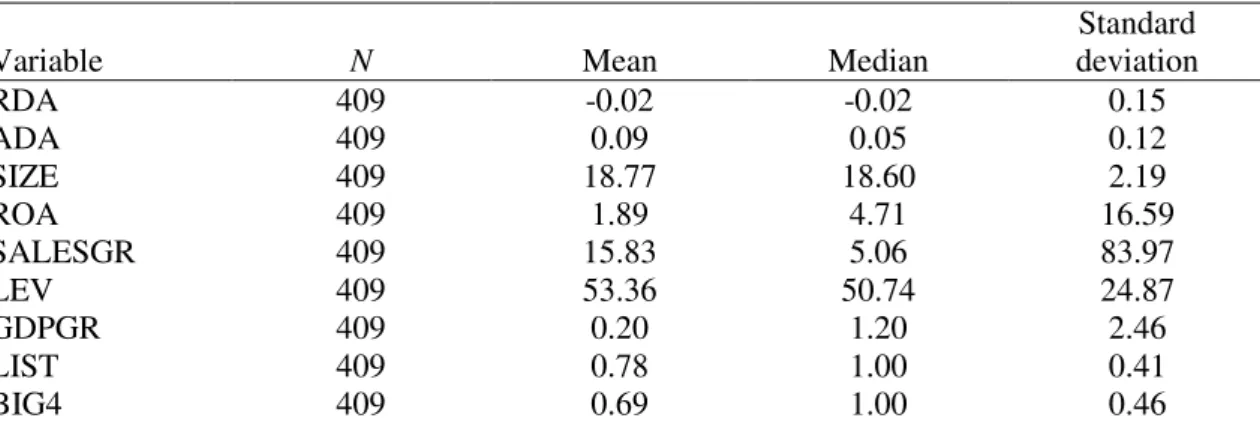
Table 5 provides the descriptive statistics of the studied variables (except the
dummy variable ACQDUM which is only used to control the type of firm).
Table 5 - Summary of variables
Variable N Mean Median
Standard deviation RDA 409 -0.02 -0.02 0.15 ADA 409 0.09 0.05 0.12 SIZE 409 18.77 18.60 2.19 ROA 409 1.89 4.71 16.59 SALESGR 409 15.83 5.06 83.97 LEV 409 53.36 50.74 24.87 GDPGR 409 0.20 1.20 2.46 LIST 409 0.78 1.00 0.41 BIG4 409 0.69 1.00 0.46
RDA is real discretionary accruals, estimated via the modified Jones model (1991); ADA is absolute discretionary accruals, measured as the absolute value of RDA; SIZE is natural logarithm of total assets; ROA is return-on-assets
ratio, measured in percentage; SALESGR is firm’s 2 years compounded sales growth in the 2 years before the
announcement, measured in percentage; LEV is debt-to-asset ratio, measured in percentage; GDPGR is the growth rate of EU28 seasonally adjusted GDP in the year before the announcement, measured in percentage; LIST is a dummy variable that assumes a value of 1 if the firm is listed on the stock exchange and 0 if otherwise; BIG4 is a dummy variable that assumes a value of 1 if the firm is audited by a Big4 auditor and 0 if otherwise.
It is possible to verify that, on average, an acquirer shows a positive performance
of almost 2%, a 2-years compounded sales growth rate of almost 16%, and a leverage
level close to 53%. Even though the results meet the expectations for these variables, they
are not similar to the results presented by Higgins (2013) concerning Japanese acquirers,
who report an average for sales growth at 2% and for leverage at 39%. Comparing the
sales growth’s mean and median, there is still a significant difference of more than 10%,
which induces that the sample of acquirers shows very different levels of operating
revenue between firms. Furthermore, on average, an acquirer has more than half of its
assets consumed by its debt, which may constitute an incentive for them to gain synergies
percentage of real discretionary accruals means that, on average, a firm manages its
earnings downwards around -2%. For the absolute discretionary accruals, the 9% average
indicates the dimension of earnings management.
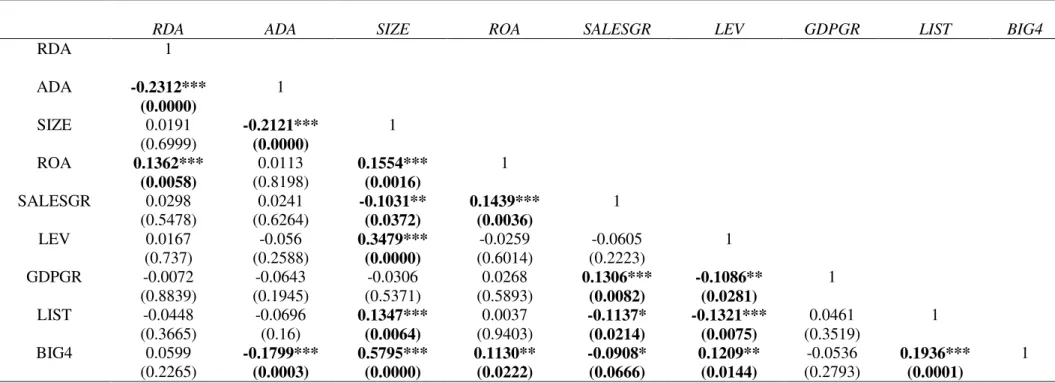
6.3.2. Correlation matrix
Table 6 (in annex) shows the Pearson correlation matrix from the studied
variables. In general, the variables do not show a strong correlation amongst themselves.
The highest correlation is provided by SIZE & BIG4, which suggests that high sized firms
are normally associated to a Big4 auditor. In turn, the SIZE & LEV correlation suggest
that high sized firms are more able to bear a higher level of debt than low sized firms.
The RDA & ROA correlation indicates that there is a strong evidence that profitable
acquirers have a bigger margin to engage in earnings management than firms with a lower
performance. On the other hand, there is a negative relationship between ADA & SIZE
and ADA & BIG4, which suggest that smaller acquirers, as well as acquirers not audited
by a Big4 auditor, are associated to a higher extent of earnings management.
7. Results
Table 7 (in annex) summarizes both total accruals and discretionary accruals to
build a base for univariate analysis. It is verified that the total accruals of both acquirers
and matches are negative on average (-4.98% and -3.93% respectively), whose results are
consistent with the ones in Higgins (2013). However, the percentages obtained in this
study are less negative than in the author’s study. A curious fact is that, on average, RDA
are more negative for acquirers (-1.72%) than for their matches (-0.27%), although the
matches’ average is not statistically significant. The results on average show a contrary
expectation regarding the H1, which assumes that acquirers manage earnings upward in
average for acquirers and earnings management practices, which is less expressive in
comparison to their matches (9.92%).
Tables 8 and 9 (in annex) report the equations output of the multiple combinations
that were performed for the 800 pooled firms (400 acquirers and 400 matches). In table
8, RDA is the dependent variable, while in table 9, ADA is the dependent variable. In
table 10 (in annex), the independent variables are regressed altogether in two equations,
where RDA and ADA are the dependent variables of each one of them.
The outputs show that even though ACQDUM is positive in 5 models out of 10,
it is not statistically significant in any of them, therefore providing weak support to the
H1. Unlike in related literature (Higgins, 2013), this result is not consonant with the
prediction that acquirers are likely to present higher levels of abnormal accruals when
compared to non-acquirers. In a further analysis done to stock acquirers (i.e.: those which
used stock to finance M&A deals), it is shown that ACQDUM*STOCK is positively
signed in 9 models out of 10, and statistically significant at 10% in the model 9. Even
considering a positive association between earnings management and stock swaps for the
majority of tested models, the H1 is weakly satisfied.
Relatively to the range of tested variables, it is notable that SIZE is statistically
significant at 1% in all models it was tested (i.e.: model 1, 5, 6 and 10), being positively
associated to RDA and negatively associated to ADA. This evidence meets the
expectation that larger firms tend to manage earnings more upwards than smaller ones,
even though it is inferred that smaller firms manipulate earnings in a higher scale. ROA
shows a positive coefficient in models 2 and 5 where RDA is the dependent variable,
being statistically significant at 1% in both. The positive relationship suggests that
enhancement. On the other hand, models 7 and 10 evidence ROA as negatively related to
ADA, although only in the model 7 this variable shows statistical significance at 10%
confidence. This proposes that, in extension, firms with lower income levels are more
associated to discretionary acts due to a higher pressure from stakeholders towards the
management to attain better performances. SALESGR is positively linked to RDA in
models 3 and 5, reaching 10% of significance in this latter one. The coefficient sign
corresponds to the expectation that firms with higher growing perspectives are more
engaged in earnings management than those with lower perspectives. LEV is statistically
significant at 1% and 5% in the tested models, having a negative coefficient in models 4
and 5, and a positive one in models 9 and 10. The negative sign for LEV relatively to
RDA hints that high leveraged firms are tendentiously more monitored and scrutinized
by creditors and lenders, which disincentive firms to manage earnings. On the opposite
side, the positive association between LEV and ADA indicates that leveraged firms feel
pressured to report a higher level of earnings in order to keep up the creditors’ confidence.
The macroeconomic indicator GDPGR looks unrelated to RDA and related to ADA. The
negative sign may denunciate that firms behavior are not associated with the European
economic environment to pursue earnings management practices. However, since that no
statistical significance was found for any models it was tested, there are no viable
conclusions with respect to this variable. LIST presents a negative sign in all of 10 tested
models, which emphasizes the fact that listed firms are less subject to manage earnings
than non-listed firms because of higher scrutiny from market agents, such as investors or
regulators. Furthermore, there is less flexibility for these firms to alter accounting reports
due to special requirements to follow IAS/IFRS practices. Even though negatively signed
the equations in which RDA is the dependent variable. Finally, BIG4's coefficient is
negative in 6 models out of 10 (i.e.: models 1, 6, 7, 8, 9 and 10), being statistically
significant at 1% when the ADA is the dependent variable (i.e.: models 7, 8 and 9). The
negative association confirms the prediction that firms are less flexible to engage in
earnings management in the presence of any of the Big4 auditors due to their accounting
expertise.
Analyzing the tests for the multiple combinations where RDA is the dependent
variable (table 8), it is verified that ROA presents the highest R-squared (8.61%) in
comparison to the rest of the tested variables. On the other hand, when taking ADA as the
dependent variable (table 9), it is able to confirm that LEV presents the highest R-squared
(13.80%) overall. In practice, this means that discretionary accruals are more conditioned
by performance in the earnings management direction, whereas these are more
conditioned by leverage in the earnings management dimension.
8. Conclusions, limitations and suggestions for future researches
8.1. Conclusions
This study examines the behavior of EU28 acquiring firms in the period
subsequent to the subprime crisis, with the purpose to explore the relationship between
mergers and acquisitions and earnings management.
The results do not suggest that mergers and acquisitions are anticipated by
acquirers, even though the acquirer dummy variable shows a positive sign in 5 models
out of 10. In depth, it means that there is no statistical evidence that acquirers report
positive abnormal accruals for the fiscal year immediately before the deal announcement.
Despite being positive in 9 models out of 10, this variable is statistically significant at
10% only in the model 9. In this sense, the findings do not meet the main assumption that
stock swap acquirers manage earnings upward in order to mitigate the cost of the
operation (Erickson & Wang, 1999; Botsari & Meeks, 2008; Higgins, 2013). On the other
hand, as the majority of deals were paid via cash or cash combined with other kind of
payments that are not stock, the lack of evidence confirms the prediction that cash-related
acquirers effectively do not find an incentive to manage earnings (Erickson & Wang,
1999). For these reasons, the H1 is not confirmed as initially forecasted.
The results also suggest that some of the studied determinants provide an
important insight about this thematic. It was strongly evidenced that firms of higher
dimension and positive performance show a higher association to earnings management
than firms with inverse conditions, which denunciates not only that it is of interest for
larger firms to stimulate accounting reports, but also that obtaining profit is a key factor
in management’s accruals choice. Furthermore, it is deducted that scrutiny and control
has influence in firms, which lessens the incentive of these to pursue discretionary acts.
In practice, leverage indicators alarm creditors and lenders about credit risks (i.e.: firms’
inability to meet their liabilities, either in short-term or long-term), which conduct such
agents to supervise leveraged firms in a higher way. In a similar mood, it was evidenced
that listed firms face more obstacles to succeed in earnings management than non-listed
firms.
Since to my knowledge there are no related studies which test for evidence of
abnormal accruals in EU28 firms after the subprime crisis, the results hereby presented
are not exactly comparable to results from other studies that were performed for other
than samples of related papers because, contrarily to a big part of them which only
analyzes listed firms, this one takes into account both listed and non-listed firms. The
inclusion of both firm types in the sample provides a different perspective relatively to
the extant literature, as well as could confirm the prediction that listed firms are less agile
to manage earnings than non-listed firms.
8.2. Limitations
The first limitation of these type of studies consists in the effective detection of
discretionary accruals and how to best measure this component. Even though most
literature is consensual in choosing the Jones model to do that (either the original or the
modified version), it is naturally unable to embed and reflect all factors that contribute to
earnings management. Furthermore, the literature evokes that total accruals may be
estimated through either the cash-flow or the balance sheet method. For that reason, the
discretionary accruals may contain errors because it is not clear which method best applies
to each sample and in particular to each firm within it.
Another aspect to be highlighted concerns a database limitation. Firstly, in the
search process were identified acquirers in Zephyr without any records in Amadeus and
vice-versa. As a consequence, such observations were immediately excluded because this
study uses data from both software programs in order to harmonize the information.
Secondly, as there were acquirers without all the necessary accounting information to
compose total accruals and other key measures, these were not possible to make part of
the acquirers’ sample. Also, when choosing the most similar entities in relation to the
final list of acquirers, some potential matching firms did not have enough accounting
information to perform the multivariate tests. In order to surpass the issue, the next best
repeated across all the sample. Although having been the most feasible solution, this
criteria is itself limitative and inevitably lessened the sample’s power.
The third limitation concerns some unavailability on target’s financial statements,
especially for older periods of analysis. Due to mergers and acquisitions, target firms were
incorporated into their acquirers and thus only a few records with respect to them
remained in the searching database. Also, by interacting targets and acquirers, the
combined sample would undesirably decrease in more than 50%. Hence, no targets data
was used to help explain acquirers’ behavior because it would not assure an accurate
inference.
8.3. Suggestions for future researches
Since that the financial world is becoming more and more competitive, managers
are permanently seeking for value enhancement on business. As more sophistication
predictably brings more business opportunities, it would be important to continue
developing studies linked to earnings management and mergers and acquisitions for more
recent dates. In future researches, that would be interesting to include corporate
governance indicators as they are likely to increase the explanatory power of the main
results around this thematic. Examples of possible indicators mean to follow former
studies, such as board size (Lipton & Lorsch, 1992; Ebrahim, 2007; Alves, 2013; Botsari
& Goh, 2014), non-executive directors on the board (Cotter et al., 1997; Davidson et al.,
2005; Botsari & Goh, 2014), duality of executive functions (Coombes & Wong, 2004;
Botsari & Goh, 2014) or managerial ownership (Warfield et al., 1995; Kao & Chen, 2004;
Botsari & Goh, 2014). Another suggestion would pass by including variables that could