Key words: social stigma, fare evasion, free-rider problem, public transport, social norms.
Palavras-Chave: estigma social, evasão de tarifa, free-rider problema, transportes públicos, normas sociais.
Recommended Citation * Email: [email protected].
Research Directory
Submitted 29 Dec 2012; received in revised form 14 Jan 2013; accepted 21 Jan 2013
The effect of social stigma on fare evasion in
Stockholm's public transport
[O efeito do estigma social sobre evasão de tarifa no transporte público de Estocolmo]
Stockholm School of Economics - Sweden
Resumo
Este estudo examina se há algum problema de estigma social associado aos controles de bilhete no metrô de Estocolmo. Usamos um modelo baseado em pesquisas que mede a disposição a pagar por um cartão de metrô dados diferentes tipos e números de controles de bilhetes. Ao contrastar a disposição a pagar nos diferentes cenários obtivemos o valor estigma social percebido em valores monetários locais (SEK). Nosso principal resultado é um aumento na disposição de pagar por um cartão de metrô de SEK 612 por ano quando os controles estão associados com o estigma social. No entanto, respondentes evasores de tarifas não reagem tão fortemente ao estigma social como os não-evasores. Esses resultados sugerem que investir em controles de mais bilhetes que contenham mais estimas sociais não é estratégia preferível, uma vez que os evasores de tarifa não serão afetados por ela.
Sterner, A. and Sheng, S. (2013) The effect of social stigma on fare evasion in Stockholm's public transport. Journal of Transport Literature, vol. 7, n. 4, pp. 50-74.
Adeline Sterner, Shu Sheng*
Abstract
This study examines if there is any social stigma associated with ticket-controls in Stockholm’s subway. We used a survey-based model that measures the willingness to pay for a subway card given different types and number of ticket-controls. By comparing the willingness to pay between the different scenarios we obtained the perceived social stigma in local currency (SEK). Our main result is an increase in the willingness to pay for a subway card of SEK 612 per year when controls are associated with social stigma. However, already fare evading respondents do not react as heavily to social stigma as non-fare evaders. These finding suggest that investing in more stigmatizing ticket controls is not preferable since fare evaders will not be affected by it.
Introduction
Every day we make decisions unconsciously affected by social norms present in our society. Social norms are defined as rules or standards of behavior, shared and created by members of a social group. Once social norms are established they will often continue to be effective, even when those who established them have left the group. Although social norms are not actual laws, they still have a great power, since breaking them may lead to sanctions were the deviant is considered to be an outcast of the society (Scott and Marshall 1998). Given the
expectation that others are going to conform to a social norm, group members prefer to conform than risking possible social exclusion (Lewis 1969). Thus, the obedience to social
norms depends heavily on how people in the surrounding act (Slemrod 2007, Bénabou and Tirole 2006). The threat of alienation makes social norms an effective way to control individuals and limit the amount of undesired behavior within a group. Ostrom (2000) showed that social norms could be more effective than externally imposed laws with regards to managing common pool resources. She found that when users of a common pool resource organize themselves and devise their own rules, they tend to manage local resources more sustainably than external regulators. Hence, laws are not always necessary, but can be replaced by social norms.
On the other hand, traditional economic theory claims that individuals are rational and self-interested, and will not act in the common interest without an external law forcing them (Olson 1965). The dilemma of how to provide and manage common pool resources is what creates the free rider problem. The free rider problem refers to a situation where an individual consumes a resource without paying for it, expecting someone else to bear the costs. Free riding is considered to be a problem when it leads to non-production or underproduction of a public good. According to neoclassical economics, a public good is defined as a good that is non-excludable and non-rivalrous (Pindyck & Rubinfeld 2009). Public transport is defined as
a public good, since people cannot effectively be excluded from consuming it, and an additional passenger will not reduce the availability to others. The problem of free riding
In Stockholm’s subway system approximately six percent of the travelers fare evade regularly (Stockholms läns landsting 2011). Today, the economic benefit of fare evading is relatively high for a frequent traveler. The price of a monthly subway card is SEK 790, and the penalty fare is SEK 1,200. With the current probability of getting caught, a passenger traveling five times a week would save just over SEK 7,000 annually if he or she chooses to fare evade instead of buying a subway card1 (Thomas Silvander, commercial manager at SL, personal communication 17th of April 2012). According to the free rider theory, this should result in a higher proportion of fare evaders than the present level. An opposite view is presented by Ostrom (2000), claiming that social norms could be an effective way to manage common pool resources. These contradicting theories led us to investigate this further. Could the low rate of
fare evasion be explained by a social norm condemning fare evasion as undesired behavior? If fare evasion is violating a social norm, passing the turnstile or getting caught in a ticket-control should be associated with embarrassment. This embarrassment, or social stigma, should be a strong incentive not to fare evade. Hence, we study if a relationship between social norms and fare evasion can be found. Further, we investigate if increasing social stigma associated with fare evasion can contribute to a lower level of fare evasion.
To examine the relationship between fare evasion and social stigma we investigate if ticket-controls are associated with social stigma, and attempt to quantify this social stigma. We use a survey-based model where we ask the participants to state their willingness to pay for a monthly subway card given different scenarios. The first scenario describes the current control system and the second scenario describes a humiliating type of control. Both scenarios are followed by three sub questions where the number of controls varies, but the expected penalty fare payment per year is fixed. As an answer, the respondent has to state how much he or she is willing to pay for a subway card before choosing another transport alternative or to fare evade. In order to determine if social stigma is present, we compare the willingness to pay between the different types and number of controls. To delimit and simplify our study, we choose to only investigate ticket controls, even though social stigma is presumed to be present in other phases of fare evasion. The study is limited to fare evasion in Stockholm’s subway system and does not include buses or trams.
1
Our results indicate that the willingness to pay increases if controls are associated with a higher degree of social stigma. This increase is equivalent to SEK 612 per year. Further, we find that respondents who already fare evade are almost not affected by this social stigma. Their yearly willingness to pay increases by only SEK 84 compared to SEK 624 for the non-fare evading sample. Thus, investing in controls with a higher degree of social stigma is not a preferable strategy to reduce fare evasion, since the fare evading sample does not seem to be affected by it.
1. Background - Stockholm Public Transport
Stockholm Public Transport, commonly referred to as SL, is the organization running all the
land-based public transportation systems in Stockholm. SL is a politically governed company owned by the Stockholm County Council and is financed by approximately 50 percent county taxes and 50 percent by the travelers through ticket sales (AB Storstockholms Lokaltrafik 2011a). Their main revenue stream is the sales of the monthly subway cards (AB Storstockholms Lokaltrafik 2011b). A monthly subway card costs SEK 790 for an adult (AB Storstockholms Lokaltrafik 2012), but SL also offers several other ticket options depending on the frequency of travel and the journey’s length. Ticket options range from a single ticket valid during one hour for SEK 36 to an annual subway card at a price of SEK 8,300 (AB Storstockholms Lokaltrafik 2012).
To verify that travelers comply and travel with a valid ticket, SL occasionally performs ticket controls at the subway stations. If the traveler cannot show a valid ticket, the controller issues a penalty fare of SEK 1,200. According to SL, fare evasion costs approximately SEK 277
million per year. SL’s main action to reduce fare evasion is to install new turnstiles that are harder to cross. They estimate to replace all old turnstiles with new ones by the end of 2013. The level of fare evasion during 2011 was 6 percent, which was a decrease by 0.7 percentage points from 2010. SL claims that this decrease is mainly the result from installing new
The subway system in Stockholm has approximately 700,000 travelers a day, and on average, SL carries out 5,200 ticket controls per day (Thomas Silvander, commercial manager at SL, personal communication 17th of April 2012). Hence, the probability of encountering a ticket control is low, approximately 0.7 percent. Furthermore, the penalty fare when getting caught without a valid ticket is SEK 1,200, to be compared with SEK 790, the monthly fee of a subway card. In order to get value for a monthly subway card, a traveler has to use the subway more than 892 times per month with the given probability of getting caught in a control. A passenger who does not travel frequently would, due to the low rate of fare inspections and the low penalty fare, benefit economically from fare evading.
Planka.nu is a Swedish organization that advocates an entirely tax financed public transport
system (Planka.nu 2012). According to Planka.nu fare evading is a way to make a political statement. A membership at Planka.nu costs SEK 100 per month and being a member covers any possible penalty fares at a deductible of SEK 100. This is one way to attract members, but the majority of Planka.nu’s members join as they already have a strong opinion about a public transport system free of charge. While Planka.nu is encouraging fare evasion, SL focuses on reducing the level of fare evasion. One of their most recent campaigns pictured a traveler, often an old lady, carrying two other travelers on her back. This was an attempt to emphasize that all travelers will have to bear the costs of fare evaders. SL and Planka.nu are two parties with conflicting opinions about fare evasion. SL portrays fare evaders as parasites whereas Planka.nu believe they are fighting for a tax-financed subway.
2. Previous research and theory
In accordance with traditional economic theory, the free riding problem assumes that people are rational and utility-maximizers (Snyder and Nicholson 2008), and therefore will free ride when the opportunity occurs (Perloff 2008). Olson (1965) argued that rational and self-interested individuals will always act in their own interest and not in the group’s common
interest. This finding became known as the “zero contribution thesis”. However, the zero
contribution thesis cannot always explain all observations in our everyday life. There are for
instance still many who do not pollute, do not cheat taxes and who do pay their subway
tickets. Observing this inconsistency, Ostrom (1997) found in her study that people engage in collective action, even without an external authority imposing sanctions. Ostrom concluded in a more recent study (2000) that societies are made up of several types of individuals with different willingness to initiate reciprocity. With the willingness to contribute, comes the requirement that other individuals are like-minded. When reciprocating individuals realize that others are taking advantage of them, they will gradually stop contributing. To avoid this risk and reduce the probability of free riding, members of the society invest resources in monitoring and sanctioning wrongful actions (Ostrom 1990). However, it is not possible to monitor and sanction every behavior that is undesirable by the society. As a complement, social norms develop and become a way to help achieve this common consensus. If members
of the society choose not to follow the social norms, they can be seen as outcasts of the society.
Studies in behavioral economics have shown that social norms concerning self-image affect
the individual’s behavior. Bénabou and Tirole (2006) argued that an individual’s decision is affected by what others do, and the individual will carefully consider the reputational effects before engaging in behavior that a social norm does not support. Bobek, Roberts and Sweeny (2007) studied what role social norms play in evading taxes. The paper discovered that social norms help to explain why tax compliance rates are higher than what would be predicted by strictly economic models. They found that the most influential social factor for paying taxes is
the individual’s own moral beliefs along with the beliefs of those close to the individual. The
second most influential factor is the society’s view of what is considered as appropriate behavior. Individuals are reluctant to break norms that the majority complies with since it can be stigmatizing; there is a threat of possible social exclusion. However, Häckner and Nyberg (1996) concluded that a system based on strong social norms and people complying with them might collapse if the economic gain of breaking the norms is high enough. When the economic gain to deviate from the norm is consistently high, there is an increased risk of gradually shifting the social norm and thus reducing the stigma. Further, in a study of tax systems that relied on taxpayers’ own conscience to pay what they owed, Slemrod (2007) noted, that the number of dutiful members of the society decreased, as they saw how the others were taking advantage of them. Hence, the definition of socially acceptable depends on how the majority of the society acts. A parallel can be drawn to littering, were a study found
of other individuals (Torgler, Frey and Wilson 2009). When the individual thought everybody else was littering, the individual started littering too. If people believe that others are fare evading, then their own moral values regarding fare evasion will change. Thus, beliefs about
others’ behavior such as “It isjust not done” and “everyone does it” often affect what makes a
given behavior socially unacceptable or acceptable.
3. Empirical method
Given our research subject, the time frame and the lack of previous data, a survey appeared as
the most appropriate and relevant way of collecting data. Since the majority of the fare evaders are 20-25 years old (Stockholms läns landsting 2011), we wanted to capture
respondents from this specific age group. To facilitate the survey collection we chose to distribute the survey at schools and universities. A broadest sample would be obtained by collecting surveys from different parts of Stockholm and our goal was to distribute the survey at schools in different locations in Stockholm. However, the majority of the schools did not want to participate. Two universities, Södertörn University and the Stockholm School of Economics participated where we in total obtained 253 complete responses. The sample pool was split into two sub samples collected at two different stages of the process. We distributed a pilot study at Södertörn University April 5th, 2012 where we obtained 153 responses. The aim of the pilot study was to investigate how the respondents perceived the survey and to obtain some first results. After the first analyzes, we were able to add, remove and alter questions before we collected survey number two. We distributed the second survey at the Stockholm School of Economics April 23rd and 24th, 2012, which resulted in 140 responses.
3.1 The survey
The first part of the survey addressed the respondent’s willingness to pay for a subway card. We asked the respondent to state how much he or she was maximum willing to pay for a subway card given two different ticket-control scenarios. The first scenario described the current control system, i.e. a controller from SL stops the traveler to check if he or she has got a valid ticket. Without a valid ticket, the traveler would receive a penalty fare. The scenario had three sub questions where the sum of the expected penalty fare payments per year was the same, but with a varying number of controls per year. The alternatives were one control with a penalty fare of SEK 1,200, five controls with a penalty fare of SEK 240 and ten controls with a penalty fare of SEK 120. Thus, the expected annual penalty fare payment was SEK 1,200, corresponding to today’s penalty fare amount (AB Storstockholms Lokaltrafik 2011c).
Given these situations, the respondent had to state his or her willingness to pay for a monthly subway card before choosing another transport option or fare evade. The respondent could choose from ten pre-stated alternatives ranging from SEK 0 to more than SEK 800 with SEK 100 intervals. As the expected annual penalty fare was fixed at SEK 1,200, the only difference between the questions was the number of controls. Thus, the difference in the willingness to pay corresponded to the perceived benefit or cost of getting caught a higher number of times. For example, a respondent could state the willingness to pay SEK 100 for a monthly subway card given one expected control per year and SEK 120 given five expected controls per year. The difference, SEK 20, represents the respondent’s increased willingness to pay per month for getting caught four more times per year. Thus, the social stigma associated with four controls is equal to SEK 20 per month.
an embarrassing control. The difference, SEK 100, corresponds to the perceived social stigma associated with a more humiliating control.
The second part of the survey contained questions regarding the frequency of travel and habits of fare evasion. According to previous research, the general attitudes and people’s opinions are of importance as they give an indication of what is socially accepted or not. Hence, we asked the students’ to state their opinions about fare evasion and to what extent they care about others perception of their behavior. When analyzing the results from the first survey, we
found that the respondent’s risk preferences could be of importance when choosing among the
alternatives. Previous research has shown that people tend to be risk averse. Risk averse
persons prefer losing a small amount of money with certainty than risk losing a larger amount with a low probability. Thus, risk aversion may affect the response choices when stating the willingness to pay. Therefore, in the second survey we added a question that captured risk preferences. The respondent had to consider a game consisting of flipping a coin and winning either SEK 10,000 or nothing. As a response, they had to state what amount of money they would claim in order to resist playing the game. After the first analyzes, we added a basic math skill question in the second survey. Since the questions in our main section of the survey had the same expected payment, we wanted to ensure this was understood by the respondents. In order to get descriptive information about our dataset, the last part of the questionnaire dealt with standard questions regarding demographics and socio-economics. We chose to ask these questions last since questions about income and such could be sensitive.
3.2 Statistical methods
Table 1 – Description of the variables
Variable name Description
Willingness To Pay The maximum amount the respondents were willing to pay for a 30-days subway card
Embarrassing Control A dummy variable that takes the value 1 if the ticket-control is embarrassing, otherwise 0
Five Controls A dummy variable that takes the value 1 if the ticket-controls are five, otherwise 0
Ten Controls A dummy variable that takes the value 1 if the ticket-controls are ten, otherwise 0
Embarrassing × Five A dummy variable that takes the value 1 if the ticket-controls are five and embarrassing, otherwise 0
Embarrassing × Ten A dummy variable that takes the value 1 if the ticket-controls are ten and embarrassing, otherwise 0
Fare evader A dummy variable that is 1 if the respondent has fare evaded more than once during the last month, otherwise 0
Fare evader × Five A dummy variable that is 1 if the respondent has fare evaded more than once during the last month and the number of ticket-controls are five, otherwise 0 Fare evader × Ten A dummy variable that is 1 if the respondent has fare evaded more than once
during the last month and the number of ticket-controls are ten, otherwise 0 Fare evader × Embarrassing A dummy variable that is 1 if the respondent has fare evaded more than once
during the last month and the ticket-controls are embarrassing, otherwise 0 Embarrassing × Male A dummy variable that is 1 if the respondent is a male and the ticket-controls
are embarrassing, otherwise 0
Risk averse × Five A dummy variable that is 1 if the respondent is risk averse, defined as he/she would rather choose an amount equal to or below SEK3000 instead of earning SEK10 000 with a 50 percent chance, and the number of ticket-controls are five, otherwise 0
Risk averse × Ten A dummy variable that is 1 if the respondent is risk averse, defined as he/she would rather choose an amount equal to or below SEK3000 instead of earning SEK10 000 with a 50 percent chance, and the number of ticket-controls are ten, otherwise 0
Risk averse × Embarrassing A dummy variable that is 1 if the respondent is risk averse, defined as he/she would rather choose an amount equal to or below SEK3000 instead of earning SEK10 000 with a 50 percent chance, and the of ticket-controls are embarrassing, otherwise 0
Against × Five A dummy variable that is 1 if the respondent has stated that he /she thinks fare evasion is equal to free riding on other passengers and the number of ticket-controls are five, otherwise 0
Against × Ten A dummy variable that is 1 if the respondent has stated that he /she thinks fare evasion is equal to free riding on other passengers and the number of ticket-controls are five, otherwise 0
3.2.1 Regression models
1.
Regression number 1 determines what effect the type and number of controls have on the willingness to pay. The variable Embarrassing takes the value of 1 if the control is of the embarrassing type. The variables Five and Ten take the value of 1 if the controls are five and ten respectively.
2.
In regression number 2, we add the variable Fare evader. The regression determines what effect, being a fare evader has on the willingness to pay. The variable Fare evader takes the value of 1 if the respondent has fare evaded more than once during the past month.
3.
In regression number 3, we replace the variable Fare evader with Risk averse. The regression determines what effect being a risk averse respondent has on the willingness to pay. The variable Risk averse takes the value of 1 if the respondent chose SEK 3,000 or less with 100 percent probability over SEK 10,000 with 50 percent probability.
4.
Regression 4 investigates if opinions regarding fare evasion have an effect on the willingness to pay. The variable Against takes the value of 1 if the respondent is against
3.3 Empirical results
3.3.1 Data description
The dataset consists of 293 students from the Stockholm School of Economics (SSE) and the Södertörn University (SH). At SH the survey was distributed during class, which led to almost no external loss. Since the students got time off from class to fill in the survey, the internal loss was also very small, only five surveys had one or more answer missing. At SSE the external loss was somewhat higher since the students had to fill it in during their break. We estimate the external loss to be around 40 responses. The internal loss was also higher with approximately 20 surveys that had incomplete answers. We observe that 53 percent of the respondents are female, and the average age of the respondent is 22 years. Approximately
20 percent of the sample state that they fare evade regularly, which we define as more than once the past month. As seen in Table 2, the two sample groups are rather similar in terms of student characteristics such as age, income and proportion fare evaders. The only notable difference between the two sample groups is the gender distribution. The SH sample consists of 61 percent females whereas the SSE sample consists of 45 percent females. Regarding views about fare evasion, 45 percent of the sample state that fare evaders are free riding on other passengers. Another 45 percent state that they do not care; everyone should do as they please. The remaining 10 percent of the sample believe that fare evasion is a good act to stand
up against SL’s prices. The question is only included in the second survey, thus respondents consists only of SSE students.
Table 2 –Student characteristics
SH students (n=153) SSE students (n=140)
Mean or proportion
Standard deviation
Mean or proportion
Standard deviation
Age 22.1 3.63 21.9 2.53
Female 61% 45%
Income* 11 846 4 822 12 964 4 680
Against fare evasion** 45%
Fare evades regularly*** 20% 19%
Risk averse**** 21%
4. Results
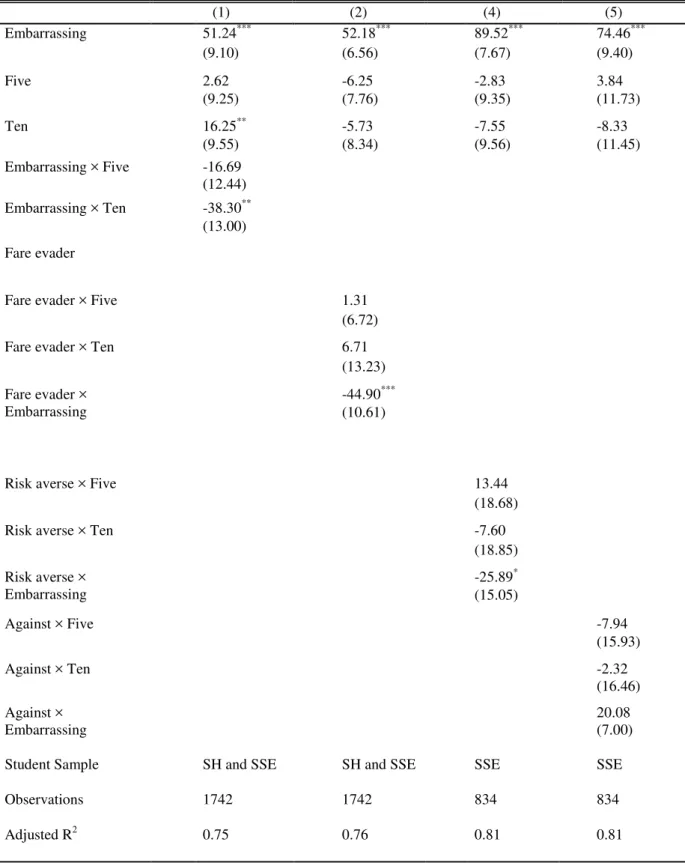
The results from the regressions are presented in Table 3. Regression 1 reveals that if a control is of the embarrassing type compared to a regular one, the willingness to pay for a monthly subway card will increase. The coefficient for the variable Embarrassing indicates this increase to be SEK 51 per month. Thus, on average, a respondent will pay SEK 612 more per year if an expected control would be more embarrassing, assuming everything else equal. This confirms that controls are associated with social stigma, and this social stigma is
equivalent to SEK 612 for one control per year. The variables Five and Ten indicate a slight increase in willingness to pay, confirming that the respondents find it more troublesome to get
caught a high number of times over a low. However, there is no statistical significance for the variable Five. The coefficient for the variable Ten is SEK 16, indicating that the social stigma associated with nine more controls per year is equivalent to SEK 195 per year. Surprisingly, the coefficients for the variables Five x Embarrassing and Ten x Embarrassing indicate negative values. However, the variable Five x Embarrassing is not statistically significant.
Ten x Embarrassing indicates that the average willingness to pay for a monthly subway card
decreases by SEK 38, equivalent to SEK 460 per year. Thus, the respondents prefer to get caught ten times per year over once when controls are embarrassing. These results contradict that Embarrassing is positive and statistically significant. Embarrassing x Ten should be positive to be in line with this finding.
The contradicting results from regression 1 indicate that other factors than social stigma may affect the outcome. One factor that could be of importance is risk preferences. Previous research has shown that people in general tend to be risk averse (Holt and Laury 2002). When faced with investments with similar returns, a risk averse person will prefer the one with the lower risk. In this case, the three questions with the same expected penalty fare are equal for a
risk neutral respondent. However, a risk averse respondent will prefer risk losing the smaller amount, SEK 120 over SEK 1,200, even if the probabilities of losing the money are altered so
5,000 to refrain from playing the game. We control for risk aversion by adding a dummy variable to regression 4. A person is defined as risk averse, if the amount stated to refrain from the game is SEK 3,000 or less. Since we added risk preferences to the second survey, thus the sample consists of only SSE students. However, running the regression does not indicate any significant results. The only significant variable is Risk Averse x Embarrassing, indicating that risk averse persons are willing to pay SEK 26 less per month than the rest of the sample if the control is embarrassing.
Another explanation to why the willingness to pay does not increase with increasing number of controls could be the deterrent effect of the penalty fare. A penalty fare set at SEK 120
signals a harmless crime, whereas SEK 1,200 signals a more severe crime. Thus, the results may be affected by this and not only capture the effect of the increased social stigma. According to Feinberg (1970), punishment must be characterized by both a hard treatment and have a symbolic significance. Further, Feinberg (1970) argues that the expressive function of punishment serves important social purposes. He claims that the social functions of punishment are performed through the expression of condemnation associated with the punishment rather than the hard treatment itself. In the case of fare evasion, it is not only paying the penalty fare that is the punishment, but also what the penalty fare signals about you; forcing others to involuntarily bear the cost of your journey. Another deterrent signal is the level of punishment when breaking a rule (Frey 2009). The level indicates what behavior is considered undesirable by lawmakers (Frey 2009). As a result, higher expected punishment will result in lower crime rate (Becker cited in Frey 2009). Thus, the expected punishment acts as a deterring mean to reduce unwanted behavior. When there are difficulties to monitor and impose punishment, expressive punishment may be the only possible action (Frey 2009). Since it is too costly for SL to control all passengers, a high penalty fare might be an effective way to reduce fare evasion.
To rule out the possibility that the sample’s mathematical skills were too low to understand
Note: All regressions estimated using ordinary least squares. The dependent variable is willingness to pay. Heteroskedasticity-robust standard errors are reported in parentheses.
***
Significant at the 1 percent level in a two-sided test ** Significant at the 5 percent level in a two-sided test * Significant at the 10 percent level in a two-sided test
Table 3 –Estimated Effect of Social Norms related variables on Willingness To Pay
(1) (2) (4) (5)
Embarrassing 51.24*** 52.18*** 89.52*** 74.46***
(9.10) (6.56) (7.67) (9.40)
Five 2.62 -6.25 -2.83 3.84
(9.25) (7.76) (9.35) (11.73)
Ten 16.25** -5.73 -7.55 -8.33
(9.55) (8.34) (9.56) (11.45)
Embarrassing × Five -16.69 (12.44) Embarrassing × Ten -38.30** (13.00)
Fare evader
Fare evader × Five 1.31
(6.72)
Fare evader × Ten 6.71
(13.23)
Fare evader × Embarrassing
-44.90*** (10.61)
Risk averse × Five 13.44
(18.68)
Risk averse × Ten -7.60
(18.85)
Risk averse × Embarrassing
-25.89* (15.05)
Against × Five -7.94
(15.93)
Against × Ten -2.32
(16.46) Against ×
Embarrassing
20.08 (7.00)
Student Sample SH and SSE SH and SSE SSE SSE
Observations 1742 1742 834 834
Regression 2 reveals that fare evaders are less sensitive than non-fare evaders to social stigma associated with controls. Approximately 20 percent of our sample fare evade regularly. The results show that a fare evader is willing to pay SEK 7 more per month for an embarrassing control compared to a regular one. This should be compared to the result of the non-fare evading respondents who are willing to pay SEK 52 more per month. Conclusions can be drawn that fare evaders perceive controls as less stigmatizing than non-fare evaders. This finding shows that increasing the level of social stigma associated with the controls, will only have a small effect on the willingness to pay among fare evaders. Relating back to Planka.nu, it could be that individuals fare evade to make a political statement. Since they do not believe they are doing anything wrong, they do not think it is embarrassing to get caught. Attitudes
towards fare evasion could play a role if the respondents perceive controls as stigmatizing or not. Intuitively, respondents who are against fare evasion should find it more embarrassing to get caught in a control since it is against their moral values. To test if attitudes have any effect on the willingness to pay, we include an interaction variable that reflects if the respondents’ were against fare evasion. Although we did not obtain any significant results, we note that
Against x Embarrassing is positive. This indicates that people who are against fare evasion
are more sensitive to embarrassing controls than the rest of the sample. In our dataset, 45 percent stated that they were against fare evasion. Approximately 45 percent did not care if people fare evaded; everyone should do as they please. Remaining 10 percent believed that
fare evasion was a good act to stand up against SL’s prices. These answers give an indication of how socially accepted fare evasion is considered to be by peers. Relating back to Häckner and Nyberg (1996), if there is an economic gain to deviate from the social norm, over time, there might be a gradual shift in the norm and thus reducing the stigma. Even if the ticket-controls would become more humiliating, the level of fare evasion might not decrease. If fare evasion is not stigmatizing then the punishment, controls or penalty fares, will not be stigmatizing either.
In our sample, we included only students since the majority of the students are in the same age group as the majority of the fare evaders. To obtain a more diverse sample of students, approximately half of the respondents studies at the Stockholm School of Economics and the other half at the Södertörn University. The results were very similar and no significant differences were observed between the schools. We obtained similar results even though the
similarities between students as a group, the survey could be distributed to a wider range of professions to get more accurate results. Since the sample included only one, specific age range, the possibilities to draw conclusions concerning younger and older travelers are limited. However, for the purpose of this study, it is not a crucial problem. We intended to investigate how to reduce the level of fare evasion. Hence, the relevant age group to examine is the group that fare evades the most.
Although a survey appeared as the most appropriate and relevant way of collecting data, the survey method has its limitation. There was no sincere interest for the respondents to take the time to fill out the survey thoroughly and thus the questions were not always properly answered. Furthermore, the questions measuring the willingness to pay in different scenarios
were similar with regards to layout and response choices. Respondents might have seen two similar questions and, assuming the two questions were identical, stated the same amount. Furthermore, the survey was anonymous which made it easy for the respondents not to answer the survey properly.
The results indicated that there is social stigma associated with more humiliating controls, but this stigma was almost non-existing for fare evading respondents. Suggested further research would be to investigate if individuals more susceptible to social stigma share any common traits. This knowledge could be useful when considering how to deal with different types of individuals. In this case, if persons aged 20-25 are the ones less susceptible to social stigma it is a bad idea for SL to invest in more stigmatizing controls since the majority of the fare evaders lies in this age group. Unfortunately, with our limited data we could not draw any conclusions regarding susceptibility to social stigma. In line with this, it would also be useful
to understand what motivates current fare evaders’ behavior to get a better insight on what way to approach fare evasion. We suggest further research into this area by doing an in-depth study on why individuals fare evade and what other factors help to explain fare evasion. This
insight could widen SL’s knowledge and perhaps alter their strategy from only replacing
Therefore, we believe research about the penalty fare’s effect on fare evasion and society would be interesting.
Conclusion
The results indicated that there was an increase in the willingness to pay if ticket-controls were more embarrassing than regular controls. Hence, we conclude that there is a higher social stigma associated with embarrassing controls. However, we obtained contradicting results since the willingness to pay did not increase as the number of embarrassing controls
did. Thus, we cannot determine if social stigma is a decisive component affecting the
individual’s level of fare evasion. Further, results showed that people who were already fare evading exhibited a relatively small difference in willingness to pay between regular and embarrassing controls. We can conclude that fare evaders experience almost no difference in terms of social stigma between the two types of controls. This finding shows SL that it is unnecessary to invest in having more embarrassing controls. Although embarrassing controls would lead to an increase in willingness to pay for the population as a whole, they would have almost no effect among fare evaders. Approximately 45 percent of the respondents did not have an opinion about people fare evading, and 10 percent thought fare evading was a good way to make a statement towards SL’s high prices. These answers, in combination with the relatively high economic gain of fare evading, could be an indication that fare evasion is to some degree socially accepted. Relating to Östling’s (2009) study, if there is an economic incentive for the individual to fare evade, then their moral values towards fare evasion will change. This study has shown that social stigma could have an effect on the fare evasion level, but is most probable not one of the main factors in the deciding whether to fare evade or not. Thus, in SL’s effort to decrease fare evasion, social stigma might not be the most appropriate approach.
Acknowledgments
School of Economics for their kind co-operation when collecting our surveys. We also thank AB Storstockholms Lokaltrafik for provision of data. Finally, we thank all the students that participated in the survey.
References
AB Storstockholms Lokaltrafik (2011a) Finansiering och reklam. AB Storstockholms Lokaltrafik.
Available at www.sl.se.
AB Storstockholms Lokaltrafik (2011b) SL:s årsberättelse för 2010. AB Storstockholms Lokaltrafik,
Stockholm.
AB Storstockholms Lokaltrafik (2011c) Vad händer om jag inte har biljett och det blir kontroll? AB
Storstockholms Lokaltrafik. Available at www.sl.se.
AB Storstockholms Lokaltrafik (2012) Våra biljetter och priser. AB Storstockholms Lokaltrafik. Available at www.sl.se.
Bénabou, R. and Tirole, J. (2006) Incentives and Prosocial Behavior. The American Economic Review,
vol. 96, n. 5, pp. 1652-1678.
Bobek D. D., Roberts R.W. and Sweeny J. T. (2007) The Social Norms of Tax Compliance: Evidence from Australia, Singapore, and the United States. Journal of Business Ethics, vol. 74, n. 1, pp. 49-52.
Feinberg, J. (1970) The Expressive Function of Punishment, in Doing and Deserving. Princeton: Princeton University Press, pp. 95-118.
Frey, B. S. (2009) Punishment – and beyond. CESIFO Working Paper N. 2706. Available at
www.CESifo-group.org/wp.
Holt, C.A. and Laury, S.K. (2002) Risk Aversion and Incentive Effects. The American Economic Review, vol. 92, n. 5, pp. 1644-1655.
Högskoleverket (2008) Vilka är studenter? En undersökning av studenterna i Sverige,
Högskoleverket, Stockholm.
Stockholms läns landsting (2011) Lägesrapport intäktssäkring 2011. Stockholms läns landsting,
Stockholm.
Häckner, J. and Nyberg, S. (1996) Marknaden and moralen. Ekonomisk Debatt, vol. 24, n. 2.
Lewis, D. K. (1969) Convention: A Philosophical Study. Harvard University Press, Cambridge MA.
Olson, M. (1965). The Logic of Collective Action: Public Goods and the Theory of Groups.
Cambridge: Harvard University Press.
Ostrom, E. (1990) Governing the Commons: The Evolution of Institutions for Collective Action. New
York: Cambridge University Press.
Ostrom, E. (1997) A Behavioral Approach to the Rational Choice Theory of Collective Action, American Political Science Review. vol. 92, n. 1, pp. 1-22.
Ostrom, E. (2000) Collective Action and the Evolution of Social Norms. Journal of Economic
Perspectives, vol. 14, n. 3, pp. 137-158.
Perloff, J. M. (2008) Microeconomics, 5th edition. Boston: Pearson Education.
Planka.nu (2012) Vad tycker vi?, Planka.nu. Available at: planka.nu/vad-tycker-vi. Accessed 13th of May 2012.
Scott, J. and Marshall, G. (1998) A Dictionary of Sociology. Oxford: Oxford University Pres.
Slemrod, J. (2007) Cheating Ourselves: The Economics of Tax Evasion. Journal of Economic
Perspectives, vol. 21, n. 1, pp. 25-48.
Stockholms läns landsting (2011) Lägesrapport intäktssäkring 2011. Stockholms läns landsting,
Stockholm.
Snyder, C. and Nicholson, W. (2008) Microeconomic Theory: Basic Principles and Extensions. 10th
edition. Mason: Thomson South-Western.
Torgler, B., Frey, B. S. and Wilson, C. (2009) Environmental and Pro-Social Norms: Evidence on Littering. The B.E. Journal of Economic Analysis and Policy, vol. 9, n. 1, art. 18.
Trost, J. (2001) Enkätboken, 2nd edition. Lund: Studentlitteratur.
Appendix
–
The survey
3Thank you for participating in our survey. All the answers are anonymous and confidential.
The following questions concern the willingness to pay for a SL card.
Suppose you can either buy a monthly subway card or fare evade. If you choose to fare evade you will be subject to controls. A control is identical to the ones today control. This means that a controller from SL will check the validity of your ticket at the exit from the subway. If you travel without a valid ticket you will receive a penalty fare.
1. Suppose that you expect to get caught once a year. The penalty fare is SEK 1200.
How much would you be willing to pay for a subway card given these circumstances?
Nothing at all
SEK 1-100 per month
SEK 100-200 per month
SEK 200-300 per month
SEK 300-400 per month
SEK 400-500 per month
SEK 500-600 per month
SEK 600-700 per month
SEK 700-800 per month
More than SEK 800 per month
2. Suppose that you expect to get caught five times a year. The penalty fare is SEK 240.
How much would you be willing to pay for a subway card given these circumstances?
Nothing at all
SEK 1-100 per month
SEK 100-200 per month
SEK 200-300 per month
SEK 300-400 per month
SEK 400-500 per month
SEK 500-600 per month
SEK 600-700 per month
SEK 700-800 per month
More than SEK 800 per month
3. Suppose that you expect to get caught ten times a year. The penalty fare is SEK 120.
How much would you be willing to pay for a subway card given these circumstances?
Nothing at all
SEK 1-100 per month
SEK 100-200 per month
SEK 200-300 per month
SEK 300-400 per month
SEK 400-500 per month
SEK 500-600 per month
SEK 600-700 per month
SEK 700-800 per month
Assume now that the ticket controls are different. When you get caught you will be escorted by two controllers to a booth in the middle of the subway station, thus being visible to other passengers. You will have to state your personal information and a photo will be taken.
4. Suppose that you expect to get caught once a year. The penalty fare is SEK 1200.
How much would you be willing to pay for a subway card given these circumstances?
Nothing at all
SEK 1-100 per month
SEK 100-200 per month
SEK 200-300 per month
SEK 300-400 per month
SEK 400-500 per month
SEK 500-600 per month
SEK 600-700 per month
SEK 700-800 per month
More than SEK 800 per month
5. Suppose that you expect to get caught five times a year. The penalty fare is SEK 240.
How much would you be willing to pay for a subway card given these circumstances?
Nothing at all
SEK 1-100 per month
SEK 200-300 per month
SEK 300-400 per month
SEK 400-500 per month
SEK 500-600 per month
SEK 600-700 per month
SEK 700-800 per month
More than SEK 800 per month
6. Suppose that you expect to get caught ten times a year. The penalty fare is SEK 120.
How much would you be willing to pay for a subway card given these circumstances?
Nothing at all
SEK 1-100 per month
SEK 100-200 per month
SEK 200-300 per month
SEK 300-400 per month
SEK 400-500 per month
SEK 500-600 per month
SEK 600-700 per month
SEK 700-800 per month
7. How often do you ride the SL metro (one way trips)?
More than 10 times a week
6-10 times a week
1-5 times a week
1-4 times per month
Less than once a month
Never
8. How many times have you fare evaded the past month?_________________
Why? (Multiple alternatives can be chosen)
Expensive
The turnstile was open/it was easy to cross the turnstile
Other_______________________________________
9. Have you ever gotten caught in a control?
Yes
How did you react? (Multiple alternatives can be chosen)
Embarrassing
Irritating to get a penalty fare
I am never going to fare evade again
I did not care
10.What is your opinion about fare evaders?*
They exploit paying passengers
It is good that they stand up against SL’s high prices I do not care, everybody are free to do whatever they like 11.How much do you care about other’s opinions of you?*
1 2 3 4
Nothing at all A lot
The following questions concern your preferences when it comes to winning money4
12.You flip a coin. If you get tails you win SEK 10 000, otherwise you win nothing. What amount would you claim to resist flipping the coin?*
SEK _________________
The following questions concern mathematical skills
13.Mark the largest alternative*
5 x 230 vs. 8 x 140
350/5 – 30 vs. (460/4) – 50
1.5 x 30 vs. 0.7 x 60
Demographics
14.Gender
Female
Male
15.Age__________
16.What is your monthly income (in SEK)?
< 5 000
5 000 – 10 000
10 000 – 15 000
15 000 – 20 000
20 000 – 25 000
25 000 – 30 000
30 000 – 35 000
35 000 – 40 000