AND OPERATIONS RESEARCH
Mariana Peres de Lima1, Luis Marcelo Tavares de Carvalho2, Adriana Zanella Martinhago3, Luciano Teixeira de Oliveira4, Samuel de Pádua Chaves e Carvalho5,
Gleyce Campos Dutra6, Thomaz Chaves de Andrade Oliveira7 (received: March 10, 2010; accepted: April 28, 2011)
ABSTRACT: In view of the need to improve the planning of timber harvest and transportation, with both activities being the most infl uential in determining the fi nal cost of timber delivered to the mill yard, this work aims to develop a new methodological proposal using operations research and geotechnology tools in order to determine optimal locations for log stacking and also the amount of timber to be allocated to each selected stack. Analysis was performed using two software applications, geographic information system (GIS) and operations research (OR). GIS spatial analyses were based on layers of the study site, which is a property owned by Votorantim Celulose e Papel, located in the municipality of São José dos Campos, in order to obtain three variables: degree of diffi culty in operating forestry equipment, degree of diffi culty in log stacking, and distance between log stacks and existing roadways. To obtain these variables, layers containing information on terrain inclination and existing roadways were combined in another analysis named weighted overlay. Results were then fi ltered and inserted into an operations research environment for maximization of the timber volume in each selected stack. With results obtained from the geographic information system, 80 potential sites were selected for log stacking. By using operations research, 59 of these sites were ruled out, a 73% reduction in the number of potential sites, with only 21 sites remaining as potentially optimal for log storage. For each of these 21 sites, an optimal amount of timber was determined to be allocated to each one of them.
Key words: Geographic information system, linear programming, log stacking.
METODOLOGIA PARA PLANEJAMENTO DAS PILHAS DE MADEIRA UTILIZANDO GEOTECNOLOGIA E PESQUISA OPERACIONAL
RESUMO: Verifi cando a necessidade de aperfeiçoar o planejamento da colheita e transporte de madeira, já que estas atividades são as que mais infl uenciam no custo fi nal da madeira posta em fábrica, neste trabalho, objetivou-se desenvolver uma nova proposta metodológica que utiliza ferramentas de geotecnologia e pesquisa operacional visando à determinação de melhores locais para o empilhamento de madeira e a quantidade de madeira alocada em cada pilha selecionada. As análises foram feitas, utilizando dois softwares de sistema de informação geográfi ca (SIG) e de pesquisa operacional (PO), respectivamente. As análises espaciais no SIG foram realizadas a partir de layers da área de estudo pertencente à Votorantim Celulose e Papel, localizada no município de São José dos Campos, visando à obtenção de três variáveis: graus de difi culdade de movimentação de máquinas fl orestais, grau de difi culdade para o empilhamento de toras e a distância das áreas para empilhamento em relação às estradas existentes. Para a obtenção dessas variáveis, foram combinadas as layers contendo informações sobre a inclinação do terreno e estradas existentes em uma nova análise denominada sobreposição ponderada. Posteriormente, os resultados foram fi ltrados e inseridos em ambiente de pesquisa operacional que visou à maximização do volume de madeira em cada pilha selecionada. Por meio dos resultados obtidos pelo sistema de informação geográfi ca foram selecionados 80 locais potenciais para as pilhas de madeira. Com a utilização da pesquisa operacional eliminaram-se 59 destes locais, com uma redução de 73%, restando como locais ótimos 21 pilhas para o armazenamento da madeira. Para cada uma das 21 pilhas, foi determinada a quantidade de madeira ideal a ser alocada em cada uma.
Palavras-chave: Sistema de informação geográfi ca, programação linear, empilhamento.
1Forest Engineer, Professor, Ph.D. candidate in Forest Resources – Instituto de Ciências Agrária e Ambientais – Universidade Federal de Mato Grosso – Campus Universitário Sinop – Av. Alexandre Ferronato, nº 1200 – 78557-267 – Sinop, MT, Brasil – [email protected]
2Forest Engineer, Professor Ph.D. in Geoscience and Environment – Departamento de Ciências Florestais – Universidade Federal de Lavras /UFLA – Campus Universitário – Cx. P. 3037 – 37200-000 – Lavras, MG, Brasil – [email protected]fl a.br
3Bachelor of Computer Sciences – Departamento de Ciências Florestais – Universidade Federal de Lavras/UFLA – Campus Universitário – Cx. P. 3037 – 37200-000 – Lavras, MG, Brasil – [email protected]
4Forest Engineer, Ph.D. candidate in Forest Engineering – Departamento de Ciências Florestais – Universidade Federal de Lavras /UFLA – Campus Universitário – Cx. P. 3037 – 37200-000 – Lavras, MG, Brasil – [email protected]
5Forest Engineer, Ph.D. candidate in Forest Resources – Departamento de Ciências Florestais – Escola Superior Luiz de Queiroz/ESALQ –Universidade de São Paulo/USP – Cx. P. 9 – 13418-900 – Piracicaba, SP, Brasil – [email protected]
6Forest Engineer, Professor Ph.D. in Forest Engineering – Faculdade de Ciências Agrárias – Universidade Federal dos Vales do Jequitinhonha e Mucuri/UFVJM – Campus II – Rod. MGT-367, km 583, nº 5000 – 39100-000 – Diamantina, MG, Brasil – [email protected]
1 INTRODUCTION
The planning of forestry activities is critical for any type of decision-making process, whether in the short, medium or long term. More and more, forestry companies are seeking to update their technologies so as to improve effi ciency and support decision-making, for the ultimate purpose of reducing costs and consequently increasing profi ts.
Countless tools and software applications have been developed for use in the forestry sector, often adapted from other sectors, with which to attain more elaborate, satisfactory results in connection with activity planning, including remote sensing (RS), geographic information system (GIS), global positioning system (GPS) and operations research (OR).
Authors such as Arce (1997), Contreras and Chung (2007), Flisberg et al. (2007), Seixas (1986), Soares et al. (2003) and Weintraub and Romero (2006) developed studies in which they present methods for applied use of geotechnology and operations research tools in forestry planning, obtaining good optimization results in several activities, including log hauling, determination of optimal routes and optimal mill setup sites, distance minimization and transportation cost reduction.
In the realm of forestry planning there is growing concern about log harvest and transportation activities, on account of the critical role they play in defi ning the total cost of timber. Machado (2002) argues that activities involving log harvest account for a large portion of the fi nal cost of timber delivered to mill, reaching up to 50%. Use and implementation of geotechnology and operations research in the forestry sector has proved very effective, being of great interest to company management and thus infl uencing decision-making. These tools allow planning harvest activities and formatting exploration strategies, with a view to an economic analysis and an optimized execution of activities, producing highly satisfactory chronograms and results. It should be said, however, that the use of remote sensing, geographic information systems and global positioning systems in the Brazilian forestry sector could still be perfected.
According to Leite (1994) and Rodriguez and Lima (1985), as cited by Silva et al. (2003), Linear Programming is featured as one of the main, most effective techniques among other operations research techniques applied to forestry planning, and is also addressed in this study.
A geographic information system can, in its turn, retrieve and use data such as relief characteristics, distance between roadways and log stacks, maximum safe inclination for operation of forestry equipment, that way indicating the best locations to perform log stacking in a tree stand.
Operations research can also help a geographic information system fi lter the areas defi ned as potential sites for log stacking, due to use of restrictions that optimally reduce the number of previously selected sites. Additionally, operations research can defi ne the amount of timber to be allocated to each stack, facilitating and improving effi ciency of harvest planning in the fi eld.
Works combining linear programming and geographic information system methodologies are noted to be scarce, hence the need for this study.
Considering the above context, by addressing the log harvest process planning, this work sought to provide a new methodological proposal, through deterministic methods, selecting geotechnology and operations research as support tools. Here, these tools were used for determining the best locations for log stacking, using spatial analysis and operations research techniques, and for determining the optimal amount of timber to be allocated to each selected stack, through volume maximization in cubic meters.
This study is focused on deterministically planning optimal locations to perform log stacking, as opposed to the often intuitive way this is done today which often relies only on the experience of planners and fi eld operators, with hardly any tool being used to expedite the decision-making process.
2 MATERIAL AND METHODS 2.1 Study site
The study was performed in Fazenda Santa Terezinha I, an estate owned by Votorantim Celulose e Papel. The property is located in the municipality of São José dos Campos, eastern São Paulo State, at coordinates 22o 58’ 20’’ South and 45o 55’ 20’’ West. The local climate is hot with dry winters and the average annual temperatures is 21ºC, with average highs of 24ºC and average lows of 17ºC. January and February are the months with highest rates of rainfall (OLIVEIRA, 2001).
2.2 Data collection
Data used in this study were provided by the above mentioned company in three different formats. The fi rst format refers to forest inventory spreadsheets as processed per stand, containing information about project, stand number, total area and perimeter of each stand, spacing, clones, planting dates, height, dominant height, expected volume with bark and without bark from 5 to 9 years, and expected volume of pulp from 5 to 9 years.
Another data set was provided in a vectorial format compatible with the geographic information system, containing information about area and perimeter of stands and the property, existing roadways, legal reserve areas and permanent preservation areas according to existing vegetation (bamboo, secondary vegetation, pasture, marshland etc.) as well as existing local infrastructure.
Finally, Votorantim also provided data tables of stack factor and cubicalness factor, maximum slope for tractor operation and maximum slope for log stacking.
In order to detail log harvest planning, stand 16 was selected out of sixteen stands in Santa Terezinha I estate. Selection of stand 16 took into account attribute requirements for the study, this particular stand having wide-ranging terrain slope and greater extent of roadways.
As the second largest plot, stand 16 covers an area of 47.58 ha, which is divided into substands for better company planning and boasts an estimated total volume of timber of 12,576.18 m³ at 7 years.
2.3 Harvest system
Harvest systems used in the study site are dictated mainly by the considerably rugged local relief. A semi-automated system (chain saw + self-loading log truck) and an automated system (harvester + forwarder) are generally used.
Tree felling and hauling is performed either using a caterpillar harvester, where terrain slope is less than 27º, or using a chain saw, where terrain slope is more than 27º. Log hauling is performed by forwarders and, in some cases, by self-loading log trucks.
2.4 Stack factor
It is necessary to know the dimensions of stacks prior to allocating logs to storage areas. Dimensions can be obtained through stack factors. A stack factor provides the volume of a 1-cubic meter log stack and thus comprises both solid wood and empty spaces in between. This work used a 1.8 stack factor, which is the value set by Votorantim.
2.5 Spatial analyses in the geographic information system
Spatial data from forest records of Votorantim were georeferenced and incorporated into the Geographic Information System in an ArcGIS 9.3 environment. The following data layers were used: area of stand 16, existing roadways and contour lines (isolines). Stand 16 is subdivided into smaller areas intersected by roadways. Each subdivision is referred to as a substand, with roadways acting as limiting lines.
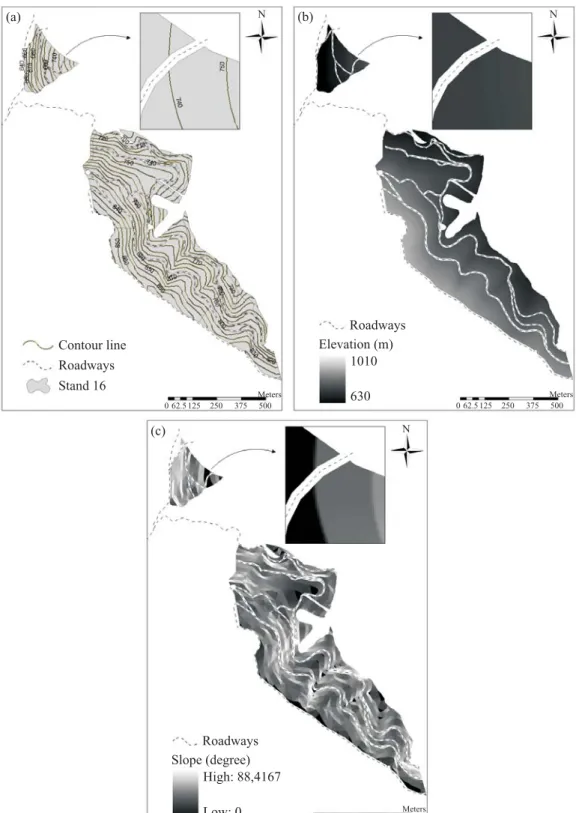
Equipment operation and stack locations are determined by terrain slope and distance to existing roadways. It was necessary to calculate an elevation model (Figure 1b), based on contour lines (Figure 1a), and then a slope model (Figure 1c) for the study site.
Based on existing roadways and slope layers in stand 16, the next step was to reclassify data to an ordinal scale, deriving three new layers: (1) degrees of diffi culty in operating forestry equipment, (2) degrees of diffi culty in log stacking and (3) distance to roadways, referred to from now as variables 1, 2 and 3 respectively.
Ratings range from 1 to 5, with lower values (1 and 2) referring to very low and low diffi culty areas, and higher values (3 and 4) referring to high and very high diffi culty areas for log stacking. Rating 5 refers to areas where log stacking is unfeasible, thereby restricted areas. Table 1 provides ratings for variables used in this work.
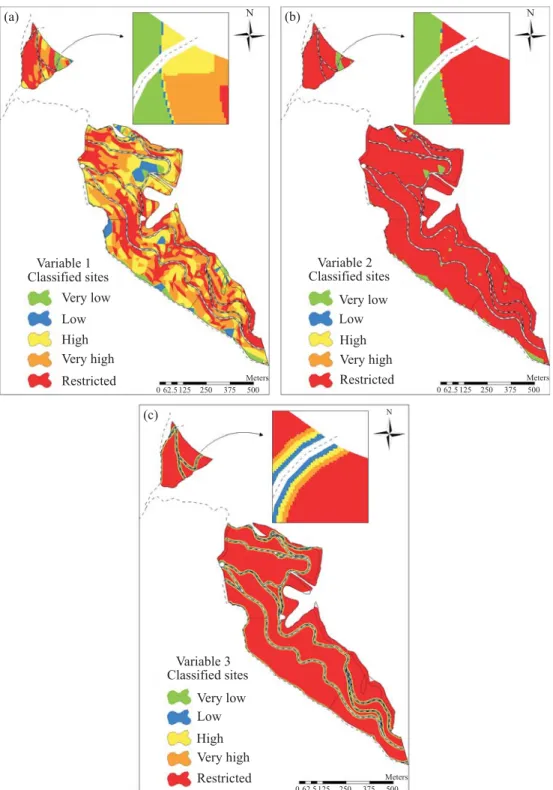
For variables 1 (Figure 2a) and 2 (Figure 2b), areas with a 5 rating (red) represent limiting slope for forestry equipment operation and log stacking respectively, according to Table 2. The remaining classes of these variables were defi ned in intervals of the same range.
Variable 3 (Figure 2c) refers to distance classes to existing roadways. As with the previous variables, locations closer to roadways (0 to 2.5m) were considered very good for log stacking, thereby being reclassifi ed with a 1 rating. At the other extreme of the scale, locations reclassifi ed with a 5 rating are more than 10m away from roadways and are thus inapt for log stacking. The fi xed stretch of 2.5m for the fi rst four classes was based on the size of logs bucked by the harvester (2.4m), according to data provided by VCP (Table 3).
Figure 1 – Contour line map of stand 16 (a); Elevation map of stand 16 (b); Slope map of stand 16 (c).
Figure 2 – Maps for variable 1 - diffi culty classes regarding forestry equipment operation (a), for variable 2 - diffi culty classes regarding log stacking (b) and for variable 3 - distance to roadway (c).
Table 2 – Maximum slope for forestry activities, in degree and in percentage.
Tabela 2 – Declividades máximas em graus e porcentagem para atividades fl orestais.
Forestry activities Maximum slope (º)
Maximum slope (%)
Forwarder 27 50
Harvester 27 50
Stacking 6.35 10
Source: VCP, 2008.
Table 3 – Classes of distance to existing roadways (variable 3). Tabela 3 – Classes de distância das estradas existentes (variável 3).
Variable 3 Class Color Distance to roadway (m)
1 Very low Green 0-2.5
2 Low Blue 2.6-5.0
3 High Yellow 5.1-7.5
4 Very high Orange 7.6-10.0
5 Restricted Red >10.0
Table 1 – Difficulty classes for variables: 1 (difficulty in operating forestry equipment), 2 (diffi culty in log stacking) and 3 (distance between stacks and existing roadways).
Tabela 1 – Classes de difi culdade das variáveis: 1 (difi culdade de movimentação de máquinas fl orestais), 2 (difi culdade de empilhamento de toras) e 3 (distância das estradas).
Values Class Color
1 Very low Green
2 Low Blue
3 High Yellow
4 Very high Orange
5 Restricted Red
Weight defi nition was based on what Votorantim considers critical for establishing log stacks. Limiting slope for equipment operation (variable 1) and distance to roadway (variable 3) are both ascribed equal importance. Variable 2 in turn is ascribed greater importance as it directly relates to stacking.
Results were obtained for a weighted overlay analysis and two layers were created defi ning potentiality
classes: potential areas and inapt areas for log stacking. The layer resulting from weighted overlay was excluded for classes of areas inapt for stacking. The layer resulting from stacking was divided into fi ve classes, whether favorable or not for stacking, and ranged from 1 to 5 regarding stack allocation: 1 (extremely favorable), 2 (reasonably favorable), 3 (favorable), 4 (barely favorable) and 5 (almost unfavorable).
Each of the fi ve classes was computed individually, and it was observed that the combining of classes 1 and 2 would be suffi cient to receive all timber contained in stand 16.
2.6 Operations research
2.6.1 Determination of optimal sites for log stacking In order to determine best sites for log stacking, stand 16 was divided into four substand groups for better distribution of stacks across the area and looking to reduce log hauling distance. The subdivision was based on two aspects: geographic proximity of substands and terrain slope, deriving 4 groups.
Once plots were subdivided, a table of attributes was determined for each of the four groups which calculated the aggregate total area of all substands contained in each group, the log volume in cubic meters contained in the substands, and also the stere volume using a stack factor.
A list was obtained determining which sites were best suited for log stacking in each group, along with the total volume capacity, in cubic meters, that such stacks would be capable of accommodating (Table 4).
Table 5 provides the real volume of timber contained in each one of the four substand groups of stand 16, confronted with data on supported capacity should all areas be used for log stacking.
Geotechnological analyses were done and data were handled for subsequent use of operations research tools. The linear programming method was used in this study to potentiate the tools previously used, looking to restrict and ensure more satisfactory results in the solution of the proposed log stacking problem.
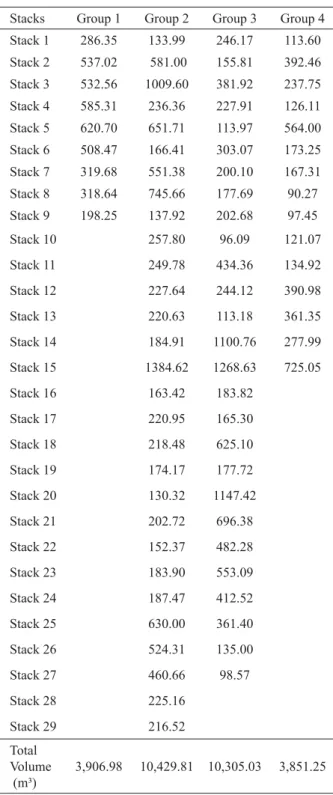
Table 4 – Maximum log capacity per ‘Vij’ stack, in cubic meters.
Tabela 4 – Capacidade máxima de madeira por pilha “Vij”, em metros cúbicos.
Stacks Group 1 Group 2 Group 3 Group 4 Stack 1 286.35 133.99 246.17 113.60 Stack 2 537.02 581.00 155.81 392.46 Stack 3 532.56 1009.60 381.92 237.75 Stack 4 585.31 236.36 227.91 126.11 Stack 5 620.70 651.71 113.97 564.00 Stack 6 508.47 166.41 303.07 173.25 Stack 7 319.68 551.38 200.10 167.31 Stack 8 318.64 745.66 177.69 90.27 Stack 9 198.25 137.92 202.68 97.45
Stack 10 257.80 96.09 121.07
Stack 11 249.78 434.36 134.92
Stack 12 227.64 244.12 390.98
Stack 13 220.63 113.18 361.35
Stack 14 184.91 1100.76 277.99 Stack 15 1384.62 1268.63 725.05
Stack 16 163.42 183.82
Stack 17 220.95 165.30
Stack 18 218.48 625.10
Stack 19 174.17 177.72
Stack 20 130.32 1147.42
Stack 21 202.72 696.38
Stack 22 152.37 482.28
Stack 23 183.90 553.09
Stack 24 187.47 412.52
Stack 25 630.00 361.40
Stack 26 524.31 135.00
Stack 27 460.66 98.57
Stack 28 225.16
Stack 29 216.52
Total Volume (m³)
3,906.98 10,429.81 10,305.03 3,851.25
Table 5 – Log volume in stand 16 and maximum volume supported by stacks, in cubic meters.
Tabela 5 – Volume de madeira do talhão 16 e volume máximo suportado pelas pilhas, em metros cúbicos.
Groups
Total log volume of stand 16
(m³)
Supported capacity (m³)
Group 1 1175.63 3,906.98
Group 2 3790.58 10,429.81
Group 3 4119.39 10,305.03
Group 4 3490.57 3,851.25
2.6.1.1 Objective function
The formulation of a mathematical model used the information given in Table 4, which are the volumes contained in matrix ‘Vij’ (total volume capacity of stacks in cubic meters) and also the information about timber availability per substand group. LINDO software was used for solving the problem.
Maximize: (1) where:
Z = Amount of timber allocated to stacks i of group j, in cubic meters;
X = Variable that identifi es the stack and its respective substand group;
V = Total volume capacity of stacks, in cubic meters; i = number of log stacks from 1 to m; and
j = number of substand groups ranging from 1 to n, where n=4.
2.6.1.2 Constraints
For each of the four substand groups there is a log volume to be provided that requires stacking. Consequently, the aggregate log volume to be allocated to stacks has to be, at the minimum, equal to the volume available for stacking, that is, the total amount of timber contained in each substand group, in cubic meters, according to the equations below.
For j = 1: (2)
For j = 2: (3)
For j = 3: (4)
For j = 4: (5) where:
Vf gj = Total amount of timber supplied by the group of substands j.
There is a constraint as to the value of variable ‘Xij’. The value of a stack cannot exceed the supported log capacity, in cubic meters.
For i and j ranging from 1 to m and 1 to n respectively:
(6)
Below are presented constraints as to the non-negativity of the variables.
Xij≥ 0; i = 1,.m; j = 1,.n (7) By applying the above equations (1) to (7) to the data provided, then followed the determination of which
stacks would be selected to allocate logs and how much would be allocated to each.
3 RESULTS AND DISCUSSION
3.1 Spatial analyses using a geographic information system
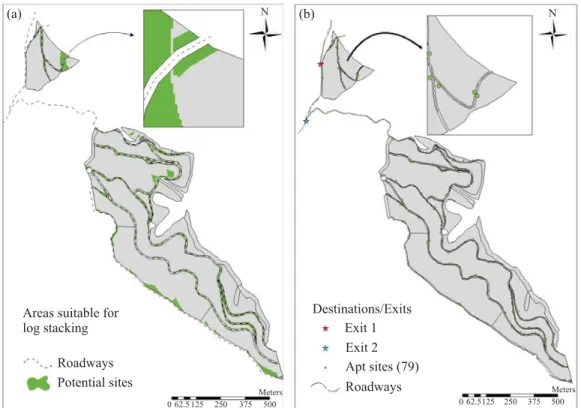
Figure 3a is the outcome of a weighted analysis, in which gray areas represent inapt sites for log stacking while green areas represent potential sites for log stacking.
The next step was to fi lter the potential areas for log stacking. Filtering is intended to exclude areas less than 100 m² which, according to Votorantim, are undersized and thus unsuitable for log stacking. Eighty apt polygons were obtained for potential log stacking.
Calculations were made of the volume in cubic meters and the stere volume supported by each polygon, and also the distance from each polygon to the two property exits (S1 and S2). Figure 3b shows the center points of apt polygons, the two exits/destinations (S1 and S2) and the existing road network in stand 16.
Figure 3 – Maps of potential polygons (a) and polygon center points, and also exits 1 and 2 (b).
Figura 3 – Mapas dos polígonos potenciais (a) e dos pontos centrais dos polígonos, e as saídas 1 e 2 (b).
27
1
X Vf
i
ij gj
=
≤
∑
15
1
X Vf
i
ij gj
=
≤
∑
3.2 Optimal sites for stacking 3.2.1 Objective function and constraints
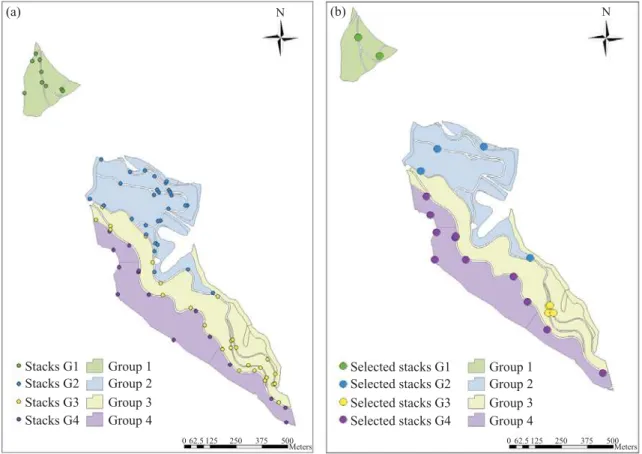
Using the formulation of the mathematical model, 21 apt sites were selected for log stacking out of the 80 sites previously selected by the geographic information system, showing a 73% reduction in potential log stacking sites.
Apt stacks are distributed as follows: two stacks in substand group 1, four stacks in substand group 2, four stacks in substand group 3 and eleven stacks in substand group 4, totaling twenty-one apt sites. According to linear programming results, each substand group has its selected stacks with the respective log volume supported per stack and log volume to be allocated, in cubic meters (Table 6).
Figure 4a illustrates the spatial distribution of the 80 stacks initially selected by weighted overlay and then the result of linear programming (Figure 4b) which reduced potential log stacking sites by about 73%, leaving a total of 21 potential sites distributed across the substand groups.
It should be noted that with real life problems and a good database, optimization cannot but seek satisfactory results, yet optimal, exact results are virtually impossible to achieve.
According to Silva et al. (2003), in many forestry planning situations it is impossible to adopt an optimal solution, particularly where decisional variables involve labor or machinery and also, to the detriment of the optimum, when operational solutions are adopted. An operational solution consists of an enforceable approximation to the optimum suggested by Mathematical Programming.
Developed through a modeling procedure, this study allowed combining a weighted analysis of layers in a GIS environment with a linear programming model for representation of a problem involving planning and identifi cation of optimal stack sites, helping assess possible areas in a specifi c setting and helping allocate optimal log quantities, defi ne stack dimensions and consequently the ideal site for use.
The use of operations research has proved very effective in fi ltering and optimally reducing potential sites to be selected and allocated for establishment of log stacks. Complementarily, results in the proposed planning reveal that it is possible to rely confidently on GIS data considering the aspects, and the operational and environmental limitations that occur in forestry planning related to log stacking.
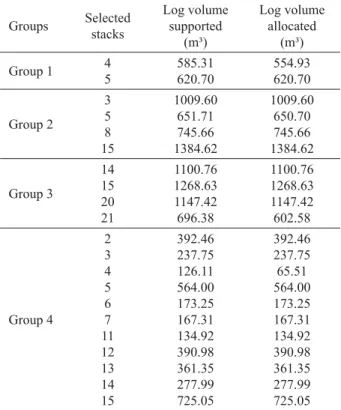
Table 6 – Selected stacks with the respective log volume supported per stack and log volume to be allocated, in cubic meters.
Tabela 6 – Pilhas selecionadas e seus respectivos valores de volume de madeira suportada por pilha e volume de madeira que será alocada, em metros cúbicos.
Groups Selected stacks Log volume supported (m³) Log volume allocated (m³)
Group 1 4
5 585.31 620.70 554.93 620.70 Group 2 3 5 8 15 1009.60 651.71 745.66 1384.62 1009.60 650.70 745.66 1384.62 Group 3 14 15 20 21 1100.76 1268.63 1147.42 696.38 1100.76 1268.63 1147.42 602.58 Group 4 2 3 4 5 6 7 11 12 13 14 15 392.46 237.75 126.11 564.00 173.25 167.31 134.92 390.98 361.35 277.99 725.05 392.46 237.75 65.51 564.00 173.25 167.31 134.92 390.98 361.35 277.99 725.05
Overall, it can be said that technical gains can be made from optimization, since with it stacking sites will no longer be determined intuitively, relying only on the experience of planners and fi eld operators. Instead it will rely on a methodology grounded in technical and scientifi c standards, facilitating and expediting the planning and decision-making process concerning log stacking.
Banhara et al. (2010) observed that linear programming techniques can offer the possibility of combining critical operational and environmental aspects that often are only partially considered in conventional planning methods.
Figure 4 – Stacks selected by weighted overlay (a); Stacks selected by linear programming (b).
Figura 4 – Pilhas selecionadas pela sobreposição ponderada (a); Pilhas selecionadas pela programação linear (b).
The methodology proposed in this study can be recommended for forestry harvest planning, judging by the good quality results from combining two tools. This demonstrates that interdisciplinarity is an excellent way of conducting studies and research as it allows several fi elds to interact toward the betterment and solution of complex problems.
In this study, combining GIS with linear programming proved effective in solving forestry planning problems, specifi cally in the fi elds of Forestry Harvest and Transportation. This refl ects countless possibilities for extending and improving knowledge and understanding of issues once found diffi cult to tackle. It is suggested, in future works, that variables such as cost of transportation and roadway characteristics be inserted in the numeric model of linear programming.
Finally, language programming routines should be developed that include geospatial domain, as well as operations research routines.
4 CONCLUSIONS
The following conclusions were drawn from this study:
- the use of geotechnologies such as geographic information system and the use of operations research proved effective in the new methodological proposal for forestry harvest planning;
- the use of a methodology weighting three variables, namely diffi culty in operating forestry equipment, diffi culty in log stacking and distance from log stacks to roadways, proved satisfactory for log stack planning;
- it was possible to determine optimal sites for log stacking by combining operations research and geotechnology;
- a 73% reduction was found in the number of optimal sites for log stacking, by applying operations research subsequently to spatial analysis; and
5 ACKNOWLEDGMENTS
The authors wish to thank CAPES (coordination for improvement of higher education personnel) for granting fi nancial aid, and also VCP-Florestal, in particular Engineers Honório Kanegae, Taís Rufino, Claudio Thiersch, Pablo de Campos Ferreira, for providing data, suggestions, ideas, and for their trust.
6 REFERENCES
ARCE, J. E. Um sistema de programação do transporte
principal de multiprodutos fl orestais visando à minimização de custos. 1997. 98 f. Dissertação (Mestrado em Ciências Florestais) - Universidade Federal do Paraná, Curitiba, 1997.
BANHARA, J. R.; RODRIGUEZ, L. C. E.; SEIXAS, F.; MOREIRA, J. M. M. A. P.; SILVA, L. M. S. da; NOBRE, S. R.; COGSWELL, A. Agendamento otimizado da colheita de madeira de eucaliptos sob restrições operacionais, espaciais e climáticas. Scientia Florestalis, Piracicaba, v. 38, n. 85, p. 85-95, mar. 2010.
CONTRERAS, M.; CHUNG, W. A computer approach to fi nding an optimal log landing location and analyzing infl uencing factors for ground-based timber harvesting.
Canadian Journal of Forest Research, Ottawa, v. 37, n. 2, p. 276-292, Feb. 2007.
FLISBERG, P.; FORSBERG, M.; RÖNNQVIST, M. Optimization based planning tools for routing of forwarders at harvest areas. Canadian Journal of Forest Research, Ottawa, v. 37, n. 11, p. 2153-2163, Nov. 2007.
LEITE, H. G. Conversão de troncos em multiprodutos da
madeira, utilizando programação dinâmica. 1994. 230 f.
Tese (Doutorado em Ciência Florestal) - Universidade Federal de Viçosa, Viçosa, 1994.
OLIVEIRA, C. A. de. Turfa de São José dos Campos: estado de São Paulo. São Paulo: CPRM, 2001. 14 p. (Série oportunidades minerais, 24).
RODRIGUEZ, L. C. E.; LIMA, A. B. N. P. M. A utilização da programação linear na determinação de uma estratégia ótima de reforma de um talhão fl orestal. Scientia Florestalis, Piracicaba, n. 31, p. 47-53, 1985.
SEIXAS, F. Planejamento e estudo de sistema de exploração fl orestal. Circular Técnica IPEF, Piracicaba, n. 34, p. 25-303, dez. 1986.
SILVA, G. F.; LEITE, H. G.; SILVA, M. L.; RODRIGUES, F. L.; SANTOS, H. N.Problemas com o uso de programação linear com posterior arredondamento da solução ótima, em regulação fl orestal. Revista Árvore, Viçosa, v. 27, n. 5, p. 677-688, 2003.
SILVA, M. L. da; MIRANDA, G. M. Custos. In: MACHADO, C. C. (Ed.). Colheita fl orestal. 2. ed. Viçosa, MG: UFV, 2008. p. 185-230.
SOARES, C. P. B.; RIBEIRO, J. C.; NASCIMENTO FILHO, J.; RIBEIRO, J. C. L. Determinação de fatores de empilhamento através de fotografi as digitais. Revista Árvore, Viçosa, v. 27, n. 4, p. 473-479, 2003.