Copyright: This is an open-access article distributed under the terms of the Creative Commons Attribution License®, which permits unrestricted use, distribution, and reproduction in any medium, provided that the original author and source are credited.
Is city of residence a factor differentiating Sitting
time in adolescents?
A cidade de residência é um fator que diferencia o tempo sentado de adolescentes?
AUTHOR’SRoberval Emerson Pizano1
Christiane de Faria Coelho Ravagnani2
Robert Glenn Weaver3
Maria Sylvia de Souza Vitalle4 1 Federal Institute of Education, Science and Technology of Mato Grosso, Department of Physical Education, Cáceres, Mato Grosso, Brazil. 2 Federal University of Mato Grosso do Sul, Department of Physical Education, Campo Grande, Mato Grosso do Sul, Brazil.
3 University of South Carolina, Arnold School of Public Health, Department of Exercise Science, Columbia, South Carolina, Estados Unidos. 4 Universidade Federal de São Paulo Departamento Pediatria- São Paulo, Brasil.
CORRESPONDING Roberval Emerson Pizano
Rua dos Canários, 367, Cidade Alta, Cáceres, Mato Grosso, Brazil. CEP: 78200-000.
DOI
10.12820/rbafs.23e0004
ABSTRACT
The aim of this cross-sectional study was to examine the association between city of residence and other factors related to sitting time in adolescents. Students (n = 1,089), between 14 and 18 years, completed self-reported questionnaires to collect data about sitting time, general fitness, physical education and sport participation, socio-economic stratum and householder´s education in Botucatu (SP), Cáceres (MT) and São Paulo (SP). The choice of municipalities occurred for convenience and the selection of schools and students was performed randomly. Multi-level mixed linear regression models were used to estimate the relationship between the independent variables and sitting time (min.day-1) during weekdays and weekend days. Hierarchal models were estimated to account for the nested nature of student within schools. Regarding cities of residence, there was no association with sitting time on both weekday (São Paulo, β = 36.87, CI: 25.6; 233.62 and Cáceres, β = 66.94, CI: 22.1; 156.01) and weekend (São Paulo, β = 104.01, CI: 64.5;138.20 and Cáceres, β = 90.23, CI: 33.2; 213.64), when compared to Botucatu. Socio economic indicators were related to sitting time in different ways considering week or weekend. Students with higher householder education degrees had more sitting time on weekdays. On weekend students in higher levels of socioeconomic stratum presented less sitting time. Adolescents with very good perception of general fitness had -65.29 minutes of sitting time on weekday and -70.1 minutes of sitting time on weekend. In the present study, city of residence was not related to sitting time in adolescents. However, other factors such as gender, socioeconomic stratum and educational status, participation in sports and physical education and perceptions of fitness were related to students sitting time.
Keywords: Physical fitness; Adolescents; Sedentary lifestyle.
RESUMO
O objetivo deste estudo de cunho transversal foi examinar a associação entre cidades de residência e outros fatores relacionados ao tempo sentado em adolescentes. Estudantes (n = 1.089), com ida-des entre os 14 e 18 anos, responderam a questionários sobre tempo sentado, percepção da aptidão física geral, participação em educação física e participação em esportes, estrato socioeconômico e educação do responsável da família nos municípios de Botucatu (SP), Cáceres (MT) e São Paulo (SP). A escolha dos municípios ocorreu por conveniência e a seleção das escolas e alunos foi reali-zada de forma randômica. Modelos de regressão linear mista de multiníveis foram utilizados para estimar a relação entre as variáveis independentes e a quantidade de minutos sentados (min/dia) durante a semana e nos dias ao final de semana. Os modelos hierárquicos foram estimados para explicar a natureza aninhada do aluno dentro das escolas. Com relação às cidades de residência, não houve associação com o tempo sentado durante a semana (São Paulo, β = 36,87, IC: 25,6; 233,62 e Cáceres, β = 66,94, IC: 22,1; 156,01) e no nal de semana (São Paulo, β = 104,01, IC: 64,5; 138,20 e Cáceres, β = 90,23, IC: 33,2; 213,64), quando comparados a Botucatu. Os indica-dores socioeconômicos foram relacionados ao tempo sentado de diferentes maneiras, considerando a semana ou o fim de semana. Estudantes que tinham responsável com nível educacional mais alto tiveram mais tempo sentados durante a semana. Nos finais de semana, estudantes com melhor es-trato socioeconômico apresentaram menos tempo sentados. Adolescentes com percepção muito boa de aptidão física geral tiveram -65,29 minutos de tempo sentado no dia da semana e -70,1 minutos de tempo sentado no fim de semana. No presente estudo, a cidade de residência não teve relação ao tempo sentado em adolescentes, no entanto, outros fatores, como gênero, estrato socioeconômico e status educacional, participação em esportes e educação física e percepções de aptidão física foram relacionados ao tempo sentado.
Introduction
Sedentary behavior (SB) is defined as any waking time characterized by energy expenditure of ≤1.5 metabolic equivalents (METs). Examples of sedentary behavior include sitting at a desk, riding in a vehicle, or wat-ching television1. A growing body of epidemiological
evidence has linked sedentary behavior to a variety of health risks including an increased risk of chronic di-seases and all-cause mortality2,3.
In a systematic review of the literature, Carson et al.4 suggested that higher durations/frequencies of
screen time and television (TV) viewing were associat-ed with various harms to health such as an unfavorable body composition, higher clustered cardiometabolic risk scores, lower physical fitness, lowered self-esteem and pro-social behavior, and worse academic perfor-mance. These associations have also shown that sed-entary behaviors have the potential to influence risk of disease, independent of physical activity level2,3.
Several studies report that children and adolescents spend the majority of their leisure time engaging in sedentary pursuits like watching television or playing video games5,6. In a recent study of Brazilian
adoles-cents, Rezende et al.7 showed that the prevalence of
adolescents that watched at least two hours of televi-sion per day was 61.8%, with similar rates for females and males 59.0% and 64.5%, respectively. The high prevalence of television viewing among Brazilian ado-lescents justify the need for more research on the prev-alence and correlates of television viewing7.
Most studies with adolescents identify sedentary be-havior as screen time on TV, cell phones, computers and video games4.However, this represents only part of the
total time spent by young people in sedentary behavior, excluding activities such as sitting in school, reading in home and commuting. In addition to sitting time (ST) encompassing more activities related to sedentary be-havior, it is associated with all-cause mortality such as myocardial infarction and coronary heart disease8.
Sedentary behavior is determined by different and complex factors. Evidence from studies in different countries show that age, racial/ethnic group, educa-tional attainment, gender, income, and city of residence are all related to sedentary activity5,9,10. Besides that,
the locality and the social and physical environment in which people live are recognized as potentially power-ful influences on the time adolescent spend sedentary11.
Studies addressing sedentary behavior in adoles-cents living in cities with different size are scarce and
the much of the evidence on the relationship of envi-ronmental factors with sedentary behavior comes from studies in Australia9, Canada12 and the USA3,5, not
from South America. There are data in Brazil collected in different cities, as reviewed by Guerra et al.13, but
they hardly identify the relationship between the city of residence. Besides that, each city in Brazil has their own public policies for physical activity and leisure time that can influence on citizen´s lifestyle.
Therefore, the aim of this study was to examine the association between city of residence and other factors related to sitting time in adolescents.
Methods
This cross-sectional study occurred in the Brazilian mu-nicipalities with different population sizes: São Paulo (large city), Botucatu (medium city) and Cáceres (small city). São Paulo is the state capital, with a population of approximately 12,000.000 inhabitants, 60% of whi-te ethnic, Municipal-level Human Development Index (IDHM) of 0.805 and ranked as 28th among the most developed Brazilian cities according to Botucatu, a mu-nicipality in the interior of São Paulo State, with a po-pulation of approximately 140,000 inhabitants, appro-ximately 77% of white ethnic, IDHM of 0.800 and ranked as 40th among the most developed municipali-ties in the country. Cáceres, in the State of Mato Grosso, has approximately 90,000 inhabitants, approximately 58% of brown people, IDHM of 0.790 and is ranked as the 1,665th most developed city in Brazil. São Paulo and Botucatu have, on average, relatively higher family incomes and educational level than families in Cáceres14.
For this study, the municipalities were divided into five geographic regions: north, south, east, west and cen-tral. In each region one school was randomly selected for data collection and invited to participate in the study. Recruitment and consent of schools occurred from April to May 2015, via face-to-face meetings with the school principals. A list of eligible schools was created from which schools were randomly selected until five con-sented to participate in each municipality. After schools agreed to participate, about 10 classrooms by school were randomly selected and students were recruited after clar-ification about the procedures and objectives of the study. As inclusion research criteria, only adolescents who were 14 to 18 years old and who did not present physical problems that made it impossible to perform physical activity were included. Participation was voluntary and no individual identification information was exposed.
All the schools, parents and students participants gave their assent/consent before participation in the study.
All surveys were administered to adolescents in their classrooms at the beginning of the school day. Surveys were administered by 11 trained members of the data collection team. A pilot study (n = 14 adolescents, 14-18 years of age) was conducted in order to verify the pertinence of the items, language, clarity and objectivi-ty of the general questionnaire questions. No problems or inconsistencies were found in the instruments. Data collection was completed between October and De-cember of 2015. All data collection procedures are in accordance with Resolution CNS / MS 466/2012 that regulates studies in humans and were approved by the Research Ethics Committee of the Federal University of São Paulo under No. 0685/2015.
Boys and girls, between the ages of 14 and 18 years enrolled in a state public high school participat-ed in the research. Adolescents completparticipat-ed a Brazilian self-reported questionnaire to collect data about age, gender, socio-economic stratum (SES), and house-holder´s education (HED)15. Participants were divided
into three age groups: 14-15 years, 16 years and 17-18 years. The questionnaire Criteria of Economic Classifi-cation Brazil developed by the Brazilian Association of Research Company (ABEP)15contains estimations for
total Brazil and macro regions based on national prob-abilistic studies and represents characteristics of house-holds from the lower to higher social-economic strata: D-E, C2, C1, B2, B1, A. This classification system is based on the quantity of household possessions as TV set, radio, washing machine, car and educational level of householder and the used water and street coating. Each level corresponds to an approximate value of family income in US dollars, as follows: A = US$6180, B1 = US$2650, B2 = US$1349, C1 = US$734, C2 = US$446, D/E = US$19415. For SES analyses, five
groups were considered: D-E-C2, C1, B2, B1 and A. Householder education was categorized into the following levels: no schooling/incomplete elementary school (IES), elementary school diploma/incomplete junior high school (IJS), junior high school diploma/ incomplete high school (IHS), high school diploma/ incomplete higher education (IRS) and higher educa-tion degree (HES). For this study, were considered four groups: IES-IJS, IHS, IRS and HES.
General fitness level was assessed using a single-re-sponse item included in the International Fitness Scale16. About the test–retest reliability of scale,
per-fect agreement was observed in latin adolescents aged 9 to 17.9 years, with Kappa coefficient of 0.8117. The
question states: “Think about your level of physical fit-ness (compared to your friends) and choose the right option. Your general physical fitness is: very poor, poor, average, good and very good.” For this study, we con-sidered very poor and poor as one group.
Physical education and sports participation were collected through two questions developed for this study. Students responded either “yes” or “no” to the two following questions: “Do you attend physical ed-ucation classes?” This question aimed to understand if the students went to physical education, and “Do you practice sports outside of school hours?”
Students’ sitting time was obtained through the In-ternational Physical Activity Questionnaire (IPAQ)18,
short version, using the questions “During the last 7 days, how much time did you usually spend sitting on a week day?” and “During the last 7 days, how much time did you usually spend sitting on a weekend day?” This questionnaire has been used extensively with Bra-zilian adolescents in past studies and has been shown to produce valid and reliable data19. Consistent with
Guidelines for Data Processing and Analysis of the International Physical Activity Questionnaire, ques-tionnaires with a daily value above 900 minutes and under 10 minutes were excluded18. The week day and
weekend day responses were analyzed separately and used as dependent variables.
All analyses and multicolinearity test were perfo-med and conducted using the statistical software SPSS for Windows version 21. Interpretations of results were based on significant statistical tests (p < 0.05) and mo-del fit statistics.
Multi-level mixed linear regression models were used to estimate the relationship between the inde-pendent (i.e., city of residence, participation in physical education, participation in sports, fitness) and depend-ent variables (i.e., minutes of seddepend-entary time during weekdays and weekend days). Hierarchal models were estimated to account for the nested nature of the data (i.e., students nested within schools). Initially descrip-tive statistics were calculated for all variables (see Table 1.). A three-step process was undertaken to estimate the relationship between the independent and depend-ent variables. First, all covariates (i.e., gender, age, SES, householder education) were added as fixed effects to a model (model 1) to account for compositional differ-ences across the three cities. Second, main effect models
were estimated for each independent variable (model 2-5). Third, all covariates, dependent, and independent variables were added to a final model (model 6).
Results
Regarding the losses in the data collection, two of 15 schools were noTable to participate in the survey due to school strike. About 10% of students did not fill out the questionnaires correctly and could not be included in the research.
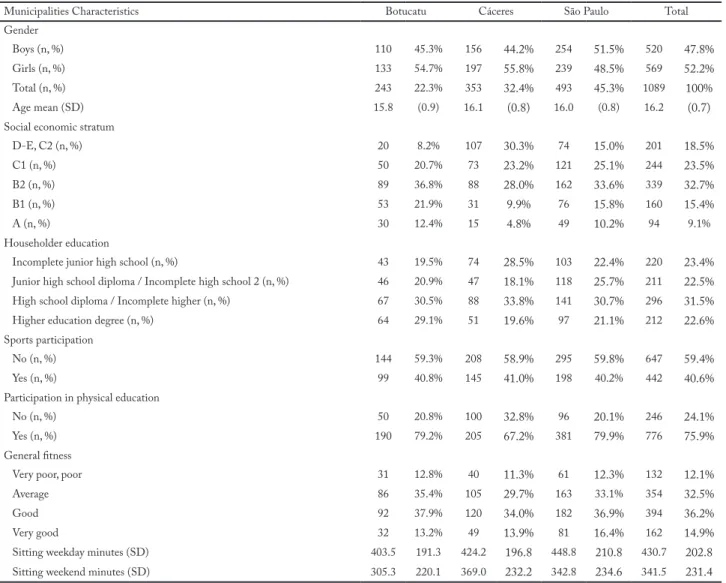
The characteristics of the students across munici-palities are presented in Table 1. The study included 1089 youth (52.2% females) with age mean of 16.2y. Approximately 42% of youth were in the lowest SES, 46% had householders with incomplete High School level, 40% were engaged in some type of Sport, 76% had participated in PE classes and almost 50% of the adolescents had good or very good perception of
fit-ness. Overall, Botucatu showed the highest level of students in upper socio economic stratum, higher ed-ucation degree among their householders as well as the lowest sitting time on weekdays (403.5 ± 191.3 min/day) and weekends (305.3 ± 220.1 min/day). The highest level of sitting weekday time was observed among students from São Paulo (448.8 ± 210.8 min/ day). Students from Caceres presented the lowest so-cio-economic indicators, more sitting time on week-ends (369.0 ± 232.2 min/day) and less participation on PE and sports. Adolescent’s self-reported sitting time was higher on weekdays (430.7 ± 202.8 min/day) than on weekend days (341.5 ± 231.4 min/day).
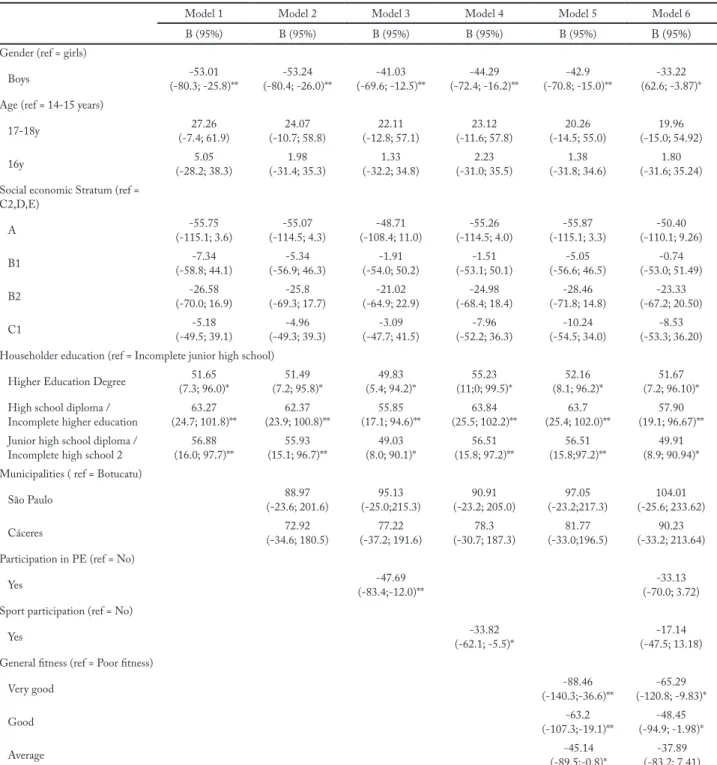
Results from linear regression analysis are present-ed in Tables 2 and 3. Socioeconomic indicators were related to ST in different ways considering week or weekend. After adjustments for all possible cofound-ers (model 6), students with the highest householder
Table 1 – Characteristics of participant schools and students.
Municipalities Characteristics Botucatu Cáceres São Paulo Total Gender
Boys (n, %) 110 45.3% 156 44.2% 254 51.5% 520 47.8%
Girls (n, %) 133 54.7% 197 55.8% 239 48.5% 569 52.2%
Total (n, %) 243 22.3% 353 32.4% 493 45.3% 1089 100%
Age mean (SD) 15.8 (0.9) 16.1 (0.8) 16.0 (0.8) 16.2 (0.7)
Social economic stratum
D-E, C2 (n, %) 20 8.2% 107 30.3% 74 15.0% 201 18.5% C1 (n, %) 50 20.7% 73 23.2% 121 25.1% 244 23.5% B2 (n, %) 89 36.8% 88 28.0% 162 33.6% 339 32.7% B1 (n, %) 53 21.9% 31 9.9% 76 15.8% 160 15.4% A (n, %) 30 12.4% 15 4.8% 49 10.2% 94 9.1% Householder education
Incomplete junior high school (n, %) 43 19.5% 74 28.5% 103 22.4% 220 23.4% Junior high school diploma / Incomplete high school 2 (n, %) 46 20.9% 47 18.1% 118 25.7% 211 22.5% High school diploma / Incomplete higher (n, %) 67 30.5% 88 33.8% 141 30.7% 296 31.5% Higher education degree (n, %) 64 29.1% 51 19.6% 97 21.1% 212 22.6% Sports participation
No (n, %) 144 59.3% 208 58.9% 295 59.8% 647 59.4%
Yes (n, %) 99 40.8% 145 41.0% 198 40.2% 442 40.6%
Participation in physical education
No (n, %) 50 20.8% 100 32.8% 96 20.1% 246 24.1%
Yes (n, %) 190 79.2% 205 67.2% 381 79.9% 776 75.9%
General fitness
Very poor, poor 31 12.8% 40 11.3% 61 12.3% 132 12.1%
Average 86 35.4% 105 29.7% 163 33.1% 354 32.5%
Good 92 37.9% 120 34.0% 182 36.9% 394 36.2%
Very good 32 13.2% 49 13.9% 81 16.4% 162 14.9%
Sitting weekday minutes (SD) 403.5 191.3 424.2 196.8 448.8 210.8 430.7 202.8 Sitting weekend minutes (SD) 305.3 220.1 369.0 232.2 342.8 234.6 341.5 231.4 SD = standard deviation.
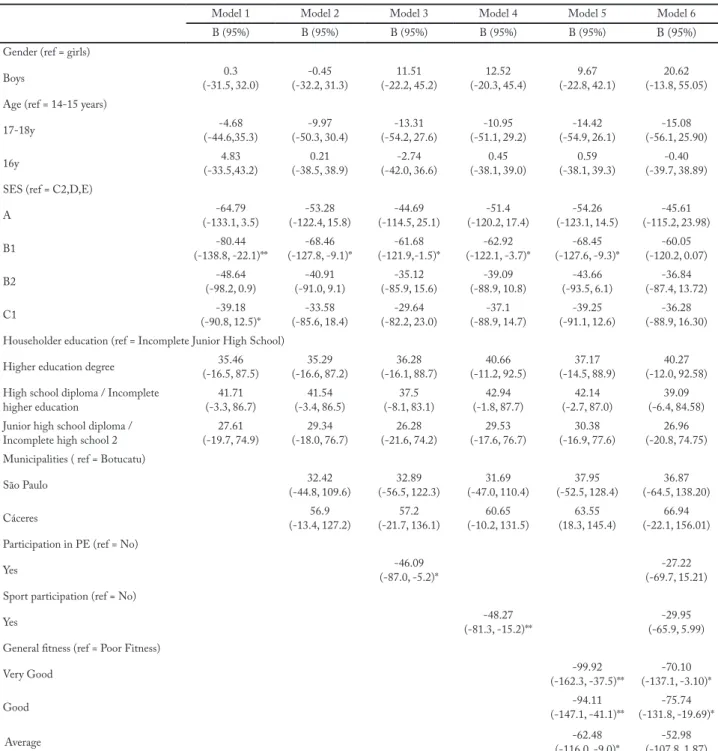
education degree had more sitting time on weekdays in comparison to the reference (Incomplete junior high school; +51.67; 95%IC: 7.2-96.10) (Table 2). On weekend days, students in higher levels of socio-economic stratum presented less sitting time (-68.4; 95%IC: -127.6; 9.3), but only for models 1 to 5 (i.e. adjusted for socio-demographic variables). There
was-not significantly association between socioeconom-ic stratum and sitting time after adjustments for PE, Sport Participation and Fitness perception (model 6; Table 3). Boys presented less sitting time than girls on weekdays but not on weekend in all adjustment mod-els. City of residence had no association with ST on both week and weekend (Tables 2 and 3 respectively).
Table 2 – Estimates from socio demographic variables, physical activity participation and fitness perception predicting sedentary behavior (sitting weekday minutes) in different Brazilian cities, n = 1089.
Model 1 Model 2 Model 3 Model 4 Model 5 Model 6
B (95%) B (95%) B (95%) B (95%) B (95%) B (95%)
Gender (ref = girls)
Boys (-80.3; -25.8)**-53.01 (-80.4; -26.0)**-53.24 (-69.6; -12.5)**-41.03 (-72.4; -16.2)**-44.29 (-70.8; -15.0)**-42.9 (62.6; -3.87)*-33.22 Age (ref = 14-15 years)
17-18y (-7.4; 61.9)27.26 (-10.7; 58.8)24.07 (-12.8; 57.1)22.11 (-11.6; 57.8)23.12 (-14.5; 55.0)20.26 (-15.0; 54.92)19.96 16y (-28.2; 38.3)5.05 (-31.4; 35.3)1.98 (-32.2; 34.8)1.33 (-31.0; 35.5)2.23 (-31.8; 34.6)1.38 (-31.6; 35.24)1.80 Social economic Stratum (ref =
C2,D,E)
A (-115.1; 3.6)-55.75 (-114.5; 4.3)-55.07 (-108.4; 11.0)-48.71 (-114.5; 4.0)-55.26 (-115.1; 3.3)-55.87 (-110.1; 9.26)-50.40 B1 (-58.8; 44.1)-7.34 (-56.9; 46.3)-5.34 (-54.0; 50.2)-1.91 (-53.1; 50.1)-1.51 (-56.6; 46.5)-5.05 (-53.0; 51.49)-0.74 B2 (-70.0; 16.9)-26.58 (-69.3; 17.7)-25.8 (-64.9; 22.9)-21.02 (-68.4; 18.4)-24.98 (-71.8; 14.8)-28.46 (-67.2; 20.50)-23.33 C1 (-49.5; 39.1)-5.18 (-49.3; 39.3)-4.96 (-47.7; 41.5)-3.09 (-52.2; 36.3)-7.96 (-54.5; 34.0)-10.24 (-53.3; 36.20)-8.53 Householder education (ref = Incomplete junior high school)
Higher Education Degree (7.3; 96.0)*51.65 (7.2; 95.8)*51.49 (5.4; 94.2)*49.83 (11;0; 99.5)*55.23 (8.1; 96.2)*52.16 (7.2; 96.10)*51.67 High school diploma /
Incomplete higher education (24.7; 101.8)**63.27 (23.9; 100.8)**62.37 (17.1; 94.6)**55.85 (25.5; 102.2)**63.84 (25.4; 102.0)**63.7 (19.1; 96.67)**57.90 Junior high school diploma /
Incomplete high school 2 (16.0; 97.7)**56.88 (15.1; 96.7)**55.93 (8.0; 90.1)*49.03 (15.8; 97.2)**56.51 (15.8;97.2)**56.51 (8.9; 90.94)*49.91 Municipalities ( ref = Botucatu)
São Paulo (-23.6; 201.6)88.97 (-25.0;215.3)95.13 (-23.2; 205.0)90.91 (-23.2;217.3)97.05 (-25.6; 233.62)104.01 Cáceres (-34.6; 180.5)72.92 (-37.2; 191.6)77.22 (-30.7; 187.3)78.3 (-33.0;196.5)81.77 (-33.2; 213.64)90.23 Participation in PE (ref = No)
Yes (-83.4;-12.0)**-47.69 (-70.0; 3.72)-33.13
Sport participation (ref = No)
Yes (-62.1; -5.5)*-33.82 (-47.5; 13.18)-17.14
General fitness (ref = Poor fitness)
Very good (-140.3;-36.6)**-88.46 (-120.8; -9.83)*-65.29
Good (-107.3;-19.1)**-63.2 (-94.9; -1.98)*-48.45
Average (-89.5;-0.8)*-45.14 (-83.2; 7.41)-37.89
After adjusting for all socio-demographic variables (models 3 and 4), PE and sport participation was in-versely associated with sitting time on both week and weekend (Tables 2 and 3 respectively) though the as-sociations were not significant anymore after adjust-ment for further covariates (model 6). The most con-sistent independent variable related to sitting time was
self-perception of fitness. Across all models, those ad-olescents with best perceptions of general fitness level had less sitting time on both week and weekends. After adjustment for all variables, adolescents with very good perception of fitness had -65.29 minutes of sitting time on weekday and -70.1 minutes of sitting time on weekend (model 6; Tables 2 and 3 respectively).
Table 3 – Estimates from socio demographic variables, physical activity participation and fitness perception predicting sedentary behavior (sitting weekend minutes) in different Brazilian cities, n = 1089.
Model 1 Model 2 Model 3 Model 4 Model 5 Model 6
B (95%) B (95%) B (95%) B (95%) B (95%) B (95%)
Gender (ref = girls)
Boys (-31.5, 32.0)0.3 (-32.2, 31.3)-0.45 (-22.2, 45.2)11.51 (-20.3, 45.4)12.52 (-22.8, 42.1)9.67 (-13.8, 55.05)20.62 Age (ref = 14-15 years)
17-18y (-44.6,35.3)-4.68 (-50.3, 30.4)-9.97 (-54.2, 27.6)-13.31 (-51.1, 29.2)-10.95 (-54.9, 26.1)-14.42 (-56.1, 25.90)-15.08 16y (-33.5,43.2)4.83 (-38.5, 38.9)0.21 (-42.0, 36.6)-2.74 (-38.1, 39.0)0.45 (-38.1, 39.3)0.59 (-39.7, 38.89)-0.40 SES (ref = C2,D,E)
A (-133.1, 3.5)-64.79 (-122.4, 15.8)-53.28 (-114.5, 25.1)-44.69 (-120.2, 17.4)-51.4 (-123.1, 14.5)-54.26 (-115.2, 23.98)-45.61 B1 (-138.8, -22.1)**-80.44 (-127.8, -9.1)*-68.46 (-121.9,-1.5)*-61.68 (-122.1, -3.7)*-62.92 (-127.6, -9.3)*-68.45 (-120.2, 0.07)-60.05 B2 (-98.2, 0.9)-48.64 (-91.0, 9.1)-40.91 (-85.9, 15.6)-35.12 (-88.9, 10.8)-39.09 (-93.5, 6.1)-43.66 (-87.4, 13.72)-36.84 C1 (-90.8, 12.5)*-39.18 (-85.6, 18.4)-33.58 (-82.2, 23.0)-29.64 (-88.9, 14.7)-37.1 (-91.1, 12.6)-39.25 (-88.9, 16.30)-36.28 Householder education (ref = Incomplete Junior High School)
Higher education degree (-16.5, 87.5)35.46 (-16.6, 87.2)35.29 (-16.1, 88.7)36.28 (-11.2, 92.5)40.66 (-14.5, 88.9)37.17 (-12.0, 92.58)40.27 High school diploma / Incomplete
higher education (-3.3, 86.7)41.71 (-3.4, 86.5)41.54 (-8.1, 83.1)37.5 (-1.8, 87.7)42.94 (-2.7, 87.0)42.14 (-6.4, 84.58)39.09 Junior high school diploma /
Incomplete high school 2 (-19.7, 74.9)27.61 (-18.0, 76.7)29.34 (-21.6, 74.2)26.28 (-17.6, 76.7)29.53 (-16.9, 77.6)30.38 (-20.8, 74.75)26.96 Municipalities ( ref = Botucatu)
São Paulo (-44.8, 109.6)32.42 (-56.5, 122.3)32.89 (-47.0, 110.4)31.69 (-52.5, 128.4)37.95 (-64.5, 138.20)36.87 Cáceres (-13.4, 127.2)56.9 (-21.7, 136.1)57.2 (-10.2, 131.5)60.65 (18.3, 145.4)63.55 (-22.1, 156.01)66.94 Participation in PE (ref = No)
Yes (-87.0, -5.2)*-46.09 (-69.7, 15.21)-27.22
Sport participation (ref = No)
Yes (-81.3, -15.2)**-48.27 (-65.9, 5.99)-29.95
General fitness (ref = Poor Fitness)
Very Good (-162.3, -37.5)**-99.92 (-137.1, -3.10)*-70.10
Good (-147.1, -41.1)**-94.11 (-131.8, -19.69)*-75.74
Average (-116.0, -9.0)*-62.48 (-107.8, 1.87)-52.98
Discussion
In the present study, city of residence was not related to ST in adolescents. However, other factors such as gender, SES and educational status, participation in sports and PE and perceptions of fitness were related to students ST. The inverse association between PE and Sports participation with sitting time were influenced by self-perception of fitness. Being girl and having householder in the highest education degree had an independent and direct association with more sitting time on weekdays in youth. On the other hand, having a self–perception of good fitness had a protective effect on sitting time independent of all other factors.
Our findings counter to a prior study with Brazil-ian adolescents that showed protective effect of living in Mato Grosso’ sin land compared to capitals on ST. The author’s hypothesized that adolescents in relatively larger cities had more access to electronic devices while those living in small cities had more opportunities to participate in activities that involve greater energy ex-penditure like playing outdoors20. It’s also hypothesized
that small towns are easier/more accessible for walking and cycling, have more favorable safety and traffic con-ditions and less access to technological facilities13.
Conversely, in our study, Caceres (the smallest city) had the highest weekend sitting time among the three cities. On the other hand, Botucatu (medium city) had the lowest levels of sitting time on both, weekday and weekend. These results indicate that factors other than city of residence may exert a great influence on ST in youth. It is also important to not the data from the Institute for Applied Economic Research (IPEA) demonstrate lower crime rates in Botucatu when com-pared to Caceres and São Paulo. Even though we have not evaluated crime indicators in our study, higher rates of crime have been related to increase sedentary behavior among adolescents and should be considered in future research in Brazil21.
In the present study, those adolescents in the highest SES stratum presented less sitting time only on week-end. Regarding the educational level, our study shows that sitting time on weekdays occurs in a larger degree between adolescents with the highest household edu-cational level. The negative association between SES and sitting time differs from that reported in a Brazil-ian cohort with adolescents22. The explanation for these
discrepancies is not clear due to the limited number of studies on this issue in Brazil13. It is also worth
mention-ing that in other studies addressmention-ing sedentary behavior
in Brazil20,23 did not split it into week and weekend
making it difficult to compare. Considering that youth sedentary time patterns vary between days of the week and between countries24 there is a need for research
ex-amining this aspect among Brazilian adolescents. Another important observation is that sports and PE participation in our study showed a negative asso-ciation with adolescents’ sitting time regardless of their city of residence or socio-demographic factors. Howev-er, the associations lost the significance when the 3 var-iables related to PA (Sports and PE participation and youth’s fitness self-perception) were analyzed togeth-er (model 6), suggesting a close relationship between them. Physical self-perception is an aspect of self-con-cept that is likely to be affected by physical activity par-ticipation25 and increased fitness parameters (e.g
cardi-ovascular fitness)26. It is plausible that the relationship
are bidirectional.For example, if adolescents have high perceptions of conditioning it might encourage them to engage in various types of physical activities (includ-ing more PE and sports classes), thus increas(includ-ing their conditioning and self-perception of it. On the other hand, low perceptions of fitness can lead youth to avoid physical activities, thus engaging in sedentary choices decreasing their opportunities to be active and devel-op better self-perceptions of fitness. Adolescents with lower levels of PA tend to adopt other negative health habits such as cigarette smoking, lower fruit and vege-table intake and greater television watching27.
Considering the intricate relationship between the abovementioned variables, physical self-components could be enhanced through involving youth in sports programs and PE classes. Specially, for adolescents from public schools, the opportunities to practice sports and PE must be assured by public policies. In the last years, national initiatives like the “More Education Program” and “Second Time” have focused on promoting better infrastructure, teacher professional development train-ing and more opportunities for sport24,28. The Second
Time Program from the Ministry of Sports aims to democratize the access to the sport practice in order to promote the integral development of children, ado-lescents and young people, especially in areas of social vulnerability. However, not all municipalities are a part of these programs and less than 3% of the students en-rolled in public schools are reached by them, leading to disparities in Sport opportunities between Brazilian cities29. Furthermore, a more recent program, changed
the “New More Education Program” emphasizing full-time school and more Mathematics and Portuguese
classes leaving the sport into a second place (as a low priority). Thus, the expansion and continuity of the sports-related programs is essential to democratize the access to physical activities in adolescence
Regarding PE, according to the National Adoles-cent School-based Health Survey (PeNSE)30 only half
of Brazilian public high schools attend at least two PE class per week and only 49.3% of girls attend PE at least two times per week. This is despite the fact that PE is mandatory for high school students. Our results show that almost a quarter of our students do not at-tend at least one PE class/week, among girls it increas-es to 36% that highlight the need for emphasizing PE attendance for girls.
Despite the original results from our study, some gaps needs to be addressed. First, the cross-sectional study design does not allow us to establish precedence between ST and some independent variables, thus cau-sality cannot be inferred. For example, in our study is difficult to know the temporal sequence between sit-ting time and fitness perception and reverse causation can occur. Second, even though we have used a vali-dated questionnaire to measure sitting time, there may have been errors associated to adolescent’s difficulty to remember their activities during the last week and under or over reporting can occur. Furthermore, dif-ferent domains of sedentary behavior (i.e. time spent on cell phones and tablets, sitting down in transit or in the school environment) could not be evaluated by IPAQ. Few studies in Brazil have measured sedentary behavior with objective methods and beyond different domains of sedentary behavior and more studies are necessary to verify different correlates of sedentary be-havior according to specific domains28.
Based on the data identified in this review, we can con-clude that the city of residence was not associated to sit-ting time among adolescents from public schools. Other factors like PE and sports participation and self-percep-tion of fitness may be best correlates of sitting time among adolescents. There is a need for more studies to better un-derstand these correlates of ST in the Brazilian context.
Sedentary Behavior can be attributed to a variety of individual, environmental and policy-level factors. In particular for youth from low-mid income families, school and sports participation seems to be a critical determinant of low levels of sitting time on both week and weekends, which shows the need for national
pub-lic and local school popub-licies in Brazil. Adding physical education classes to the daily school routine and add-ing extracurricular sports activities in the school envi-ronment appears to be promising strategies for reduce sedentary behavior in Brazilian adolescents. Consid-ering the current great violence in Brazil streets, the school environment could be used as a reference point for students and their community to practice sports and cultural activities on weekends. For this purpose, the current national policies must be evaluated, re-viewed and better implemented.
Conflict of interest
The authors declare no conflict of interest.
Authors’ contribution
Pizano RE made substantial contributions to manus-cript’s conception and design, acquisition, analysis, in-terpretation of data and writing. Ravagnani CFC made substantial contributions to conception, participated in drafting the article and revising it critically for intellec-tual content. Weaver RG made substantial contribu-tions to conception, design, analysis and interpretation of data and revising it critically for intellectual content. Vitalle MSS made contributions to conception and re-vising the manuscript critically for intellectual content
References
1. Ainsworth BE, Haskell W, Herrmann SD, Meckes N,
Bassett DRJ, Tudor-Locke C, et al. Compendium of Physical activities: a second update of codes and MET values. Med Sci Sports Exerc. 2011;43(8).
2. Wilmot EG, Edwardson CL, Achana FA, Davies MJ, Gorely T,
Gray LJ, et al. Sedentary time in adults and the association with diabetes, cardiovascular disease and death: systematic review and meta-analysis. Diabetologia. 2012;55(11):2895–905.
3. Matthews CE, George SM, Moore SC, Bowles HR, Blair A,
Park Y, et al. Amount of time spent in sedentary behaviors and cause-specific mortality in US adults. Am J Clin Nutr. 2012;95(2):437–45.
4. Carson V, Hunter S, Kuzik N, Gray CE, Poitras VJ, Chaput
J-P, et al. Systematic review of sedentary behaviour and health indicators in school-aged children and youth: an update. Appl Physiol Nutr Metab. 2016;41(6 (Suppl. 3):S240–65.
5. Whitt-Glover MC, Taylor WC, Floyd MF, Yore MM,
Yancey AK, Matthews CE. Disparities in physical activity and sedentary behaviors among US children and adolescents: prevalence, correlates, and intervention implications. J Public Health Policy. 2009;30.
6. Matthews CE, Chen KY, Freedson PS, Buchowski MS,
Beech BM, Pate RR, et al. Amount of time spent engaging in sedentary behaviours in the United States 2003-2004. Am J Epidemiol. 2008;167.
Quote this article as:
Pizano RE, Coelho-Ravagnani CFC, Weaver RG, Vitalle MSS. Is place of residence a factor differentiating sedentary behavior in adolescents? Rev Bras Ati Fis Saúde. 2018;23:e0004 DOI: 10.12820/rbafs.23e0004
7. Rezende LFM, Azeredo CM, Canella DS, Claro RM,
de Castro IRR, Levy RB, et al. Sociodemographic and behavioral factors associated with physical activity in Brazilian adolescents. BMC Public Health. 2014;14(1):485.
8. Petersen C, Bauman A, Grønbæk M, Helge J, Thygesen
L, Tolstrup JS. Total sitting time and risk of myocardial infarction, coronary heart disease and all-cause mortality in a prospective cohort of Danish adults. Int J Behav Nutr Phys Act. 2014;11(1):13.
9. Clark BK, Sugiyama T, Healy GN, Salmon J, Dunstan DW,
Shaw JE, et al. Socio-demographic correlates of prolonged television viewing time in Australian men and women: The AusDiab Study. J Phys Act Health. 2010;7(5):595–601.
10. Anderson S, Currie CL, Copeland JL. Sedentary behavior
among adults: The role of community belonging. Prev Med Rep. 2016;4:238–41.
11. Sallis JF, Floyd MF, Rodríguez DA, Saelens BE. Role of Built
environments in physical activity, obesity, and cardiovascular disease. Circulation. 2012;125(5):729.
12. Colley RC, Garriguet D, Janssen I, Craig C, Clarke J, Tremblay
MS: Physical activity of Canadian adults: Accelerometer results from the 2007-2009 Canadian Health Measures Survey. Health Rep. 2011, Statistics Canada, Catalogue no. 82-003-XPE, 22(1).
13. Guerra PH, Farias Júnior JC, Florindo AA. Sedentary
behavior in Brazilian children and adolescents: a systematic review. Rev Saúde Pública. 2016;50:9.
14. IBGE - Instituto Brasileiro de Geografia E Estatística.
Indicadores de Desenvolvimento Sustentável. Estudos e Pesquisas Informações Geográficas. 2012;
15. ABEP - Associação Brasileira de Empresas de Pesquisa.
Critério de Classificação Econômica Brasil. 2015 [citado 21 de março de 2015]; Disponível em: http://www.abep.org/ Servicos/Download.aspx?id = 12.
16. Ortega FB, Ruiz JR, España-Romero V, Vicente-Rodriguez
G, Martínez-Gómez D, Manios Y, et al. The International Fitness Scale (IFIS): usefulness of self-reported fitness in youth. Int J Epidemiol. 2011;40(3):701–11.
17. Ramírez-Vélez R, Cruz-Salazar SM, Martínez M, Cadore EL,
Alonso-Martinez AM, Correa-Bautista JE, et al. Construct validity and test–retest reliability of the International Fitness Scale (IFIS) in Colombian children and adolescents aged 9–17.9 years: the FUPRECOL study. PeerJ. 2017;5:e3351.
18. Guidelines for Data Processing and Analysis of the
International Physical Activity Questionnaire (IPAQ). 2005 [citado 7 de junho de 2017]. Disponível em: https://sites. google.com/site/theipaq/scoring-protocol.
19. Guedes DP, Lopes CC, Guedes JERP. Reprodutibilidade e
validade do Questionário Internacional de Atividade Física em adolescentes. Rev Bras Med Esporte. 2005;11:151–8.
20. Dias PJP, Domingos IP, Ferreira MG, Muraro AP, Sichieri
R, Gonçalves-Silva RMV. Prevalence and factors associated with sedentary behavior in adolescents. Rev Saude Publica. 2014;48(2):266–74.
21. Forsyth A, Wall M, Choo T, Larson N, Van Riper D,
Neumark-Sztainer D. Perceived and police-reported neighborhood crime: linkages to adolescent activity behaviors and weight status. J Adolesc Health. 2015;57(2):222–8.
22. Dumith SC, Hallal PC, Menezes AMB, Araújo CL.
Sedentary behavior in adolescents: the 11-year follow-up of the 1993 Pelotas (Brazil) birth cohort study. Cad Saúde Pública. 2010;26:1928–36.
23. Moraes SA, Beltran RJ, Mondini L, Freitas IC. Prevalence
of overweight and obesity, and associated factors in school children from urban area in Chilpancingo, Guerrero, Mexico, 2004. Cad Saude Publica. 2006;22.
24. Ramirez-Rico E, Hilland TA, Foweather L,
Fernández-Garcia E, Fairclough SJ. Weekday and weekend patterns of physical activity and sedentary time among Liverpool and Madrid youth. Eur J Sport Sci. 2014;14(3):287–93.
25. Fox KR, Corbin CB. The physical self-perception profile:
devlopment and preliminary validation. J Sport Exerc Psychol. 1989;11(4):408–30.
26. Schneider M, Dunton GF, Cooper DM. Physical activity and
physical self-concept among sedentary adolescent females; an intervention study. Psychol Sport Exerc. 2008;9(1):1–14.
27. Pate RR, Heath GW, Dowda M, Trost SG. Associations
between physical activity and other health behaviors in a representative sample of US adolescents. Am J Public Health. 1996;86(11):1577–81.
28. Kravchychyn C, Oliveira AAB. Social sports programs
and projects in Brazil: a systematic review. Movimento. 2015;1051–66.
29. Ministério do Esporte. Programa Segundo Tempo na Escola
- Apresentação. 2014 [citado 7 de junho de 2017]. Disponível em: http://www.esporte.gov.br/index.php/institucional/ esporte-educacao-lazer-e-inclusao-social/segundo-tempo-na-escola/apresentacao.
30. Malta DC, Andreazzi MAR, Oliveira-Campos M, Andrade
SSCA, Sá NNB, Moura L de, et al. Trend of the risk and protective factors of chronic diseases in adolescents, National Adolescent School-based Health Survey (PeNSE 2009 e 2012). Rev Bras Epidemiol. 2014;17:77–91.
Recebido: 13/07/2017 Aprovado: 26/09/2017