Dimensions of self-rated
health in older adults
Dimensões da autoavaliação de
saúde em idosos
I Programa de Pós-Graduação em
Gerontologia. Faculdade de Ciências Médicas. Universidade Estadual de Campinas. Campinas, SP, Brasil
II Departamento de Saúde Coletiva.
Faculdade de Ciências Médicas. Universidade Estadual de Campinas. Campinas, SP, Brasil
Correspondence: Flávia Silva Arbex Borim
Rua Padre Francisco de Abreu Sampaio, 269 apto. 32B Parque Itália
13036-140 Campinas, SP, Brasil E-mail: [email protected] Received: 11/15/2013 Approved: 5/23/2014
Article available from: www.scielo.br/rsp
ABSTRACT
OBJECTIVE: To analyze the association between negative self-rated health and indicators of health, wellbeing and sociodemographic variables in older adults.
METHODS: Cross-sectional study that used data from a population-based health survey with a probability cluster sample that was carried out in Campinas, SP, Southeastern Brazil,, in 2008 and 2009. The participants were older adults (≥ 60 years) and the dependent variable was self-rated health, categorized as: excellent, very good, good, bad and very bad. The adjusted prevalence ratios were estimated by means of Poisson multiple regression.
RESULTS: The highest prevalences of bad/very bad self-rated health were observed in the individuals who never attended school, in those with lower level of schooling, with monthly per capita family income lower than one
minimum salary. Individuals who scored ive or more in the physical health indicator also had bad self-rated health, as well as those who scored ive or
more in the Self-Reporting Questionnaire 20 and those who did not refer feeling happiness all the time.
CONCLUSIONS: The independent effects of material life conditions, physical and mental health and subjective wellbeing, observed in self-rated
health, suggest that older adults can beneit by health policies supported by
a global and integrative view of old age.
DESCRIPTORS: Aged. Self-Assessment. Health Status. Cost of Illness. Socioeconomic Factors. Health Inequalities. Health Surveys.
Flávia Silva Arbex BorimI
Anita Liberalesso NeriI
Priscila Maria Stolses Bergamo FranciscoII
The increase in longevity and the change in the
epidemi-ological proile have signiicantly enlarged the concept
of health and the spectrum of indicators that are neces-sary to monitor it. Considering that people’s subjective assessment of their own health status is an important indicator of the disease’s impact on individual well-being,4 this measure started to be used in
population-based surveys, together with other self-report measures of: signs, such as falls and incontinence; symptoms, such as fatigue, sadness and anxiety; recall of clinical diagnoses made by doctors; and functional perfor-mance, indicated by the degree of the need of help to perform activities of daily living.
Self-reports on morbidities, signs and symptoms and functional capacity focus on individual clinical condi-tions and are in good agreement with medical records or clinical examinations.30 Self-rated health implies
questions and answers of an evaluative and
compara-tive nature. It is a complex measure, inluenced by the
same elements that control reports on signs, symp-toms, functional performance and medical diagnoses. The difference between these two types of measure is the fact that self-reports on signs and symptoms have a descriptive character, while self-rated health has a
RESUMO
OBJETIVO: Analisar associação entre autoavaliação negativa de saúde e
indicadores de saúde, bem-estar e variáveis sociodemográicas em idosos.
MÉTODOS: Estudo transversal utilizando dados de inquérito de saúde de base populacional com amostra probabilística por conglomerados, realizado em Campinas, SP, em 2008 e 2009. Os participantes eram idosos (≥ 60 anos) e a variável dependente foi autoavaliação de saúde, categorizada em: excelente, muito boa, boa, ruim e muito ruim. As razões deprevalências ajustadas foram estimadas por meio de regressão múltipla de Poisson.
RESULTADOS: Maior prevalência de autoavaliação de saúde como ruim/muito ruim foi observada nos indivíduos que nunca estudaram, naqueles com menor escolaridade, com renda familiar per capita mensal inferior a um salário mínimo. Tiveram também pior autoavaliação de saúde aqueles com pontuação igual ou maior a cinco no indicador de saúde física, cinco ou mais no Self Reporting Questionnaire 20 e os que não referiram sentimento de felicidade todo o tempo.
CONCLUSÕES: Os efeitos independentes das condições materiais de vida, saúde física e mental e bem-estar subjetivo, observados sobre a autoavaliação
de saúde, sugerem que idosos podem ser beneiciados por políticas de saúde
apoiadas numa visão global e integrativa da velhice.
DESCRITORES: Idoso. Autoavaliação. Nível de Saúde. Efeitos Psicossociais da Doença. Fatores Socioeconômicos. Desigualdades em Saúde. Inquéritos Epidemiológicos.
INTRODUCTION
global, evaluative nature, indicated by answers that are characterized as a personal judgment, which is based on individual and social-normative criteria of priority access to the respondent.11
Studies on the relationships between health assessment by objective criteria and by subjective criteria are based on comparisons of healthy or successful aging measured by the two assessment criteria. The correlation between the health status measured by objective and subjective indicators tends to weaken as age advances.11 Among older adults, the incongruence relected on low scores
in objective health and high scores in self-rated health (or subjective health) may be explained by compensa-tory mechanisms of an affective nature, whose func-tion is to protect the individual’s self-esteem, sense of
self-eficacy and subjective wellbeing.26 However, there
are limits to the action of these compensatory mecha-nisms,20,21,29 which explains the positive correlations
that have been found between objective and subjective health assessments among older adults with disability,14
with disability and chronic diseases11 and with
depres-sion,18 or who live in poverty21 and have low access to
A longitudinal study that included in its baseline indi-viduals without illnesses and without disability has shown that morbidity, even when adjusted by sociode-mographic variables, utilization of and access to health services and health risk factors is, over time, a predictor of self-rated health.11 The study has also reported that
disability has a direct relationship to subjective health assessment. In relation to depression, a meta-analysis involving longitudinal and cross-sectional studies has found that the presence of chronic diseases and of a poor perceived health was associated with depression in older adults, and that self-rated health presented a higher association with depression than with self-reported chronic diseases.7
In Brazil, population-based studies have shown an asso-ciation among self-rated health, morbidity and func-tional capacity in older adults,17,25 but the magnitude
of this relationship, when variables like mental health and subjective wellbeing are included, has not been investigated yet.
The aim of the present study was to analyze the asso-ciation between negative self-rated health and health indicators, wellbeing and sociodemographic variables in older adults.
METHODS
Data from the population-based Campinas Health Survey (ISACamp 2008/2009)a were analyzed in terms of health status proiles, health behaviors and use of
health services in different segments of the popula-tion. This survey collected household information about people aged 10 years or older, considering three age groups: 10 to 19, 20 to 59 and 60 years and older, living in the urban area of the city of Campinas, SP, Southeastern Brazil, between 2008 and 2009. Sample size calculation totaled 1,000 individuals in each age group. A two-stage probability cluster sampling was performed: census tracts and households were drawn.6,b
To compensate for 20.0% of refusals and empty homes, 3,900 households were selected so that at least 1,000 interviews with older adults could be obtained. Among the drawn households, there was a 6.5% loss due to the
impossibility of inding a dweller or because a dweller
refused to list the individuals that lived in the
house-hold. Of the 1,558 older adults identiied in the drawn
households, 2.4% refused to participate in the study; thus, 1,520 older adults were interviewed. Among these, in 5.8% of the cases the interviews were conducted with a caregiver or relative and were excluded from
the study. Therefore, we analyzed data from 1,432 older adults with a mean age of 69.5 years (95%CI 69.1;69.9).
The participants’ data were collected by means of a questionnaire administered by trained interviewers. The questions were organized in blocks that approached topics related to morbidity, accidents and violence, emotional health, quality of life, use of services, preven-tive practices, use of medicines, health-related behav-iors and socioeconomic characteristics. The analyzed variables concerning older adults were:
1. Global subjective health indicator. It corresponded
to the answer to a scale item with ive alternatives:
“Generally speaking, would you say that your health is: excellent, very good, good, bad or very bad?”.
2. Physical health indicator. It was based on the older adults’ answers to the items corresponding to chro-nic diseases and health problems, and whether or not they caused limitations. A zero score was attri-buted to individuals who did not present diseases or chronic health problems; a score of one was attribu-ted to each reporattribu-ted disease or problem that did not cause limitations; and a score of two was attributed to each reported disease and problem that caused limitations in daily activities. This indicator was supported by data related to the following aspects:
a) Chronic diseases. It corresponded to the ques-tion: “Has a doctor or health professional ever told you that you have any of the following dise-ases?”, with the possibility of a dichotomous response (yes or no) to: hypertension, diabetes, heart disease, cancer, rheumatism, osteoporo-sis, asthma/bronchitis/emphysema, tendinitis and circulation problems.
b) Physical signs and symptoms. The following question was asked: “Do you have any of the following health problems?”, with the possibi-lity of a dichotomous response (yes or no) to: headache, backache, allergy, emotional problem, dizziness, insomnia and urinary problem.
c) Functional limitation. It was investigated by means of the question: “Does the disease or health problem (sign or symptom) limit your daily activities or not?”, for each disease or health problem reported by the older adults.
3. Mental health indicator, which consisted of the score obtained by each older adult in the Self Reporting Questionnaire 20 (SRQ-20)22 – an instrument with 20 dichotomous items in which each afirmative
a Universidade Estadual de Campinas, Faculdade de Ciências Médicas, Centro Colaborador em Análise de Situação de Saúde. Inquérito de
Saúde ISACamp 2008/2009 [cited 2014 Jul 13]. Available from: http://www.fcm.unicamp.br/fcm/ccas-centro-colaborador-em-analise-de-situacao-de-saude/isacamp/2008
answer is equivalent to one point. Three ranges
were constructed: zero to four, ive to ten and ten
points or more.
4. Demographic characteristics: sex and age.
5. Indicators of material life conditions: schooling and monthly per capita family income.
6. Wellbeing indicators. We considered the answers to two items of a quality of life questionnaire with 36 items the Health Survey Questionnaire – short form(SF-36):8
a) Feeling of happiness (level of pleasure in daily life). It was assessed by means of the question: “Have you been feeling happy in the last four weeks?”, with the following alternatives of answer: all the time/most of the time, some of the time and a small part of the time/never.
b) Vitality (level of energy perceived in daily life). It was assessed by means of the question: “Have you been feeling you have a lot of energy in the last four weeks?”, with the possibilities of answer: all the time/most of the time, some of the time and a small part of the time/never.
The survey’s data were keyboarded into a database developed with the use of the EpiData software, version 3.1, and submitted to a consistency analysis. For the analyses, prevalences and their respective 95%
conidence intervals were estimated. The associations
between independent variables and self-rated health were analyzed by the Chi-square test, with level of
signiicance of 5%. Poisson simple and multiple regres -sion analyzes were also used to estimate crude and adjusted prevalence ratios. The variables that presented
a level of signiicance lower than 20.0% (p < 0.20) were
introduced into Poisson multiple regression model, in the association with the dependent variable, and the
ones with p < 0.05 remained in the model. The regres
-sion model was developed in four stages. In the irst
stage, the demographic and socioeconomic variables were introduced; in the second, the physical health indi-cator was added; in the third stage, the mental health indicator was introduced; and in the fourth stage, the wellbeing indicators were added. Data analysis was carried out with the svy commands of the Stata soft-ware, version 11.0. The weights deriving from sample design were used and the existence of primary sampling units was considered.
The study was approved by the Research Ethics Committee of the Faculdade de Ciências Médicas of the Universidade Estadual de Campinas, in an addendum to Opinion 079 of 2007, referring to the project ISACamp 2008/2009 on April 27, 2010.
RESULTS
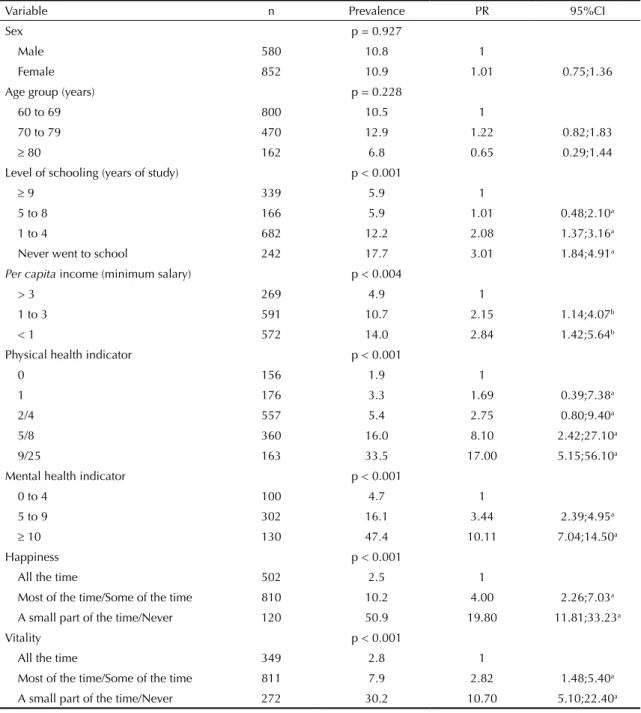
Table 1 presents the prevalence of bad/very bad self-rated health according to demographic and socioeco-nomic variables, physical and mental health indicators and subjective wellbeing indicators (happiness and vitality). We observed that older adults with level of schooling equal to or lower than four years and with per capita income up to three minimum salaries presented higher prevalence of bad/very bad self-rated health.
Older adults with score equal to or higher than ive in the physical health indicator and who scored ive or more in
the SRQ-20 presented higher prevalence of negative self-rated health, with PR = 17.0 and PR = 10.1, respectively, in the categories of highest scores (Table 1). The
preva-lence of bad/very bad self-rated health was signiicantly
higher among individuals who reported having a lower feeling of happiness and vitality (Table 1).
By means of the multiple regression model, we
veri-ied, in the irst stage, a higher prevalence of bad/very
bad self-rated health in individuals without formal schooling, in those with one to four years of schooling and whose monthly per capita family income was lower than one minimum salary. In the second stage of the analysis, those whose score was equal to or higher than
ive in the physical health indicator presented higher
prevalence of negative self-rated health. In the third
stage (Table 2), those who scored ive or more in the
SRQ-20 and, in the fourth stage, the categories low and intermediate level of feeling of happiness presented a higher prevalence of negative self-rated health. We observed that, even in the presence of congruence between the global self-rated health and the self-reports on diseases, signs and symptoms, disability and limita-tions, mental health and the feeling of happiness were important variables in the relation to self-rated health in older adults (Table 2).
DISCUSSION
A prevalence of 10.9% (95%CI 8.9;13.2) of negative self-rated health was observed among older adults, as well as an association of this subjective condition with physical and mental health indicators, with the feeling of happiness and with socioeconomic variables. These data suggest that health perception is characterized not only by favorable socioeconomic conditions and preserved physical and mental health, but also by a positive subjec-tive wellbeing, indicated by the feeling of happiness.28
Age and sex did not have a signiicant relationship to
self-rated health. Studies that investigated self-rated health in older adults in Brazil have found the same result,6,17,19 in spite of gender differences in relation
inluence self-rated health.11,14 Sex and age were
main-tained in the regression model as adjustment variables,
as the analysis included variables that suffer direct inlu -ences of sex and age, as it is possible to observe in some surveys that have detected higher prevalence of chronic diseases in women and in older adults.1,3
The socioeconomic variables are important physical
health correlates. Socioeconomic disadvantages inlu -ence lifestyle, use of and access to health services and social relations, and may be related to individuals’ and
populations’ worse health status.29 In the present inves-tigation, self-rated health presented a signiicant asso -ciation with income and schooling. Due to the
insuf-iciency of supports such as education and the satis -faction of health, housing and transportation needs in Brazil, income plays a fundamental role in relation to the acquisition of goods and services that are necessary for social reproduction.10 Robert et al20 (2009) analyzed quality of life and stratiied adult participants by socio
-economic status and age. They found a signiicant asso -ciation among self-rated health, income and schooling. Table 1. Prevalence and prevalence ratio of self-assessment and indicators among people ≥ 60 years. Campinas, SP, Southeastern Brazil, 2008-2009. (N = 1,432)
Variable n Prevalence PR 95%CI
Sex p = 0.927
Male 580 10.8 1
Female 852 10.9 1.01 0.75;1.36
Age group (years) p = 0.228
60 to 69 800 10.5 1
70 to 79 470 12.9 1.22 0.82;1.83
≥ 80 162 6.8 0.65 0.29;1.44
Level of schooling (years of study) p < 0.001
≥ 9 339 5.9 1
5 to 8 166 5.9 1.01 0.48;2.10a
1 to 4 682 12.2 2.08 1.37;3.16a
Never went to school 242 17.7 3.01 1.84;4.91a
Per capita income (minimum salary) p < 0.004
> 3 269 4.9 1
1 to 3 591 10.7 2.15 1.14;4.07b
< 1 572 14.0 2.84 1.42;5.64b
Physical health indicator p < 0.001
0 156 1.9 1
1 176 3.3 1.69 0.39;7.38a
2/4 557 5.4 2.75 0.80;9.40a
5/8 360 16.0 8.10 2.42;27.10a
9/25 163 33.5 17.00 5.15;56.10a
Mental health indicator p < 0.001
0 to 4 100 4.7 1
5 to 9 302 16.1 3.44 2.39;4.95a
≥ 10 130 47.4 10.11 7.04;14.50a
Happiness p < 0.001
All the time 502 2.5 1
Most of the time/Some of the time 810 10.2 4.00 2.26;7.03a
A small part of the time/Never 120 50.9 19.80 11.81;33.23a
Vitality p < 0.001
All the time 349 2.8 1
Most of the time/Some of the time 811 7.9 2.82 1.48;5.40a
A small part of the time/Never 272 30.2 10.70 5.10;22.40a
719 Variable First stagePR b 95%CI Second stagePR c 95%CI Third stagePR d 95%CI Fourth stagePR e 95%CI
Level of schooling (years of study)
≥ 9 1 1 1 1
5 to 8 0.89 0.44;1.80 0.96 0.49;1.91 0.87 0.45;1.70 0.87 0.44;1.73
1 to 4 1.77 1.21;2.59 1.66 1.04;2.65 1.58 0.99;2.56 1.57
Never went to school 2.50 1.57;3.95 2.29 1.42;3.68 2.00 1.22;3.25 1.93 1.20;3.10
Per capita income (minimum salary)
> 3 1 1 1 1
1 to 3 1.66 0.90;3.06 1.92 0.99;3.76 2.03 1.10;3.74 2.00 1.11;3.60
< 1 1.95 1.00;3.82 1.91 0.91;4.01 1.93 0.97;3.84 1.99 1.07;3.70
Physical health indicator
0 1 1 1
1 1.55 0.35;6.85 1.60 0.37;6.82 1.67 0.42;6.58
2/4 2.64 0.77;9.06 2.12 0.63;7.13 2.16 0.67;6.96
5/8 8.25 2.45;27.81 4.82 1.44;16.10 4.36 1.35;14.08
9/25 17.1 5.22;56.44 6.14 1.79;21.03 4.96 1.51;16.30
Mental health indicator
0 to 4 1 1
5 to 9 2.43 1.59;3.72 2.03 1.36;3.04
≥ 10 5.26 3.36;8.22 2.92 1.74;4.90
Happiness
All the time 1
Most of the time/Some of the time 2.73 1.56;4.77
A small part of the time/Never 6.44 3.11;13.31
a Poisson multiple regression model adjusted by sex and age. b PR adjusted by the demographic and socioeconomic variables.
c PR adjusted by the demographic and socioeconomic variables and by the physical health indicator.
d PR adjusted by the demographic and socioeconomic variables, by the physical health indicator and by the mental health indicator. e PR adjusted by all the variables of the table.
Chronic non-communicable diseases, which are highly prevalent in the older population, have a significant impact on the quality of life of the indi-viduals who have them and of their relatives, with repercussions in the health sector. As the number of comorbidities of an older adult increases, his/ her quality of life sharply decreases.12 The
preva-lence of chronic diseases increases as age advances, reaching more than 70.0% in people aged 70 years or older,4 and their presence has a direct influence
on self-rated health.2,13 Functional decline, the main
consequence of chronic conditions, has a robust relationship with perceived health.14
The present study found a higher prevalence ratio of negative self-rated health (“bad”) among older adults
who scored ive or more in the physical health indi -cator. The absence of an association between scores of one to four in this indicator and negative self-rated health may be related to the control of chronic diseases. This indicates the importance of reducing, diagnosing and treating common morbidities as early as possible in order to promote the quality of life of older adults. Prioritizing the control of morbidities and providing integral and continuous care are political strategies that focus on the prevention and manage-ment of chronic diseases.23
The older adults’ score in the assessment of common mental disorder (characterized by somatic and depression symptoms, anxiety status, irritability,
insomnia, fatigue, memory and concentration difi
-culties) was associated in a statistically signiicant
way with negative self-rated health. A cross-sectional study that analyzed self-rated health in a
represen-tative sample of older adults veriied that depres -sion symptoms are the main predictors of self-rating one’s own health as bad.15 Although physical and
mental health are correlated, the independent effect of each one on self-rated health is evident in the present study.
Depression generates high expenditures on health in the population aged 60 years or older, nega-tively affects functional capacity, is associated with somatic diseases, leads to social isolation and causes a significant decrease in the individuals’ quality of life.7 In old age, the etiology and the
psychological, behavioral and physical symptoms of depression may vary and may manifest themselves in a heterogeneous way, demanding adaptations of the forms of diagnosis and treatment.5 Due to the
singularity of this disease in old age and to the find-ings of the present study, we emphasize the need to invest more in the prevention of depression and in the promotion of mental health as a way of contrib-uting to improve subjective health and, conse-quently, older adults’ wellbeing and quality of life.
The association that was found between the feeling of happiness and self-rated health was the strongest of all the investigated relationships. A longitudinal study that investigated the determinants of self-rated
health and happiness found that these variables relect
the different facets of a common basis of physical and mental wellbeing.27 Siahpush et al24 (2008) assessed
relationships among happiness, life satisfaction and health and observed that people with high levels of feelings of happiness had better objective and subjec-tive health statuses.
Happiness is a hedonic state of pleasure that derives from satisfying needs and meeting goals. It is trans-lated as the predominance of positive emotional states or as the balance between positive and negative states.
It is inluenced by environmental stimuli, past expe -riences, physiological states and intrapsychic experi-ences.16 The concept of happiness integrates the concept of subjective wellbeing, which relects the assessment
that the individual himself makes of the dynamics of the relations among the conditions of the environment in which he lives, his own behavioral competence and the perceived quality of life.16 Subjective wellbeing is
connected with positive affections and, consequently, with emotional health. Older adults with higher levels of positive affections tend to use constructive coping strat-egies when they face the challenges that are inherent in advanced age.9
The associations that were found between physical and mental health statuses assessed by self-report and subjective appraisals of health quality suggest foci for research investment, such as the test of more detailed measures of mental health, vitality and happiness, as well as the investigation of variables that mediate the effects of health status on subjective health assessments. Other studies will be able to assess the effects of posi-tive self-rated health among poor health statuses and on the continuity of psychosocial functioning and of the sense of happiness among older adults. Future studies will also be able to focus on prospective research to evaluate risk and protection factors for outcomes like mortality, morbidity and disability based on somatic, psychiatric and psychological risks, on subjective well-being and on self-rated health.
The study enables to verify independent effects on self-rated health in relation to material life condi-tions, physical health, mental health and wellbeing, and emphasizes the integral approach to the older
adult in different dimensions. The indings show that,
1. Agborsangaya CB, Lau D, Lahtinen M, Cooke T, Johnson JA. Multimorbidity prevalence and patterns across socioeconomic determinants: a cross-sectional survey. BMC Public Health. 2012;12:201. DOI:10.1186/1471-2458-12-201
2. Alves LC, Rodrigues RN. Determinantes da autopercepção de saúde entre idosos
do Município de São Paulo, Brasil. Rev
Panam Salud Publica. 2005;17(5-6):333-41. DOI:10.1590/S1020-49892005000500005 3. Barros MBA, César CLG, Carandina L, Torre
GD. Desigualdades sociais na prevalência de doenças crônicas no Brasil, PNAD-2003.
Cienc Saude Coletiva. 2006;11(4):911-26. DOI:10.1590/S1413-81232006000400014 4. Barros MBA, Francisco PMSB, Lima MG, Cesar
CLG. Social inequalities in health among elderly.
Cad Saude Publica. 2011;27(Supl 2):s198-208. DOI:10.1590/S0102-311X2011001400008 5. Batistoni SST, Neri AL, Nicolosi GT, Lopes LO, Khoury
HT, Eulálio MC, et al. Sintomas depressivos e fragilidade. In: Neri AL, organizadora. Fragilidade e qualidade de vida na velhice. Campinas: Alínea; 2013. p.283-98. 6. Borim FSA, Barros MBA, Neri AL. Autoavaliação da
saúde em idosos: pesquisa de base populacional no município de Campinas, São Paulo, Brasil.
Cad Saude Publica. 2012;28(4):769-80. DOI:10.1590/S0102-311X2012000400016 7. Chang-Quan H, Xue-Mei Z, Bi-Rong D, Zhen-Chan
L, Ji-Rong Y, Qing-Xiu L. Health status and risk for depression among the elderly: a meta-analysis of published literature. Age Ageing. 2010;39(1):23-30. DOI:10.1093/ageing/afp187
8. Ciconelli RM, Ferraz MB, Santos W, Meinão I, Quaresma MR. Tradução para a língua portuguesa e validação do questionário genérico de avaliação de qualidade de vida SF-36 (Brasil SF-36). Rev Bras Reumatol 1999;39:143-50.
9. Dezutter J, Wiesmann U, Apers S, Luyckx K. Sense of coherence, depressive feelings and life satisfaction in older persons: a closer look at the role of integrity and despair. Aging Ment Health.2013;17(7):839-43. DOI:10.1080/13607863.2013.792780
10. Geib LTC. Determinantes sociais da saúde do idoso. Cienc Saude Coletiva. 2012;17(1):123-33. DOI:10.1590/S1413-81232012000100015
11. Latham K, Peek CW. Self-rated health and morbidity onset among late midlife U.S. adults. J Gerontol B Psychol Sci Soc Sci. 2013;68(1):107-16. DOI:10.1093/geronb/gbs104
12. Lima MG, Barros MBA, César CLG, Goldbaum M, Carandina L, Ciconelli RM. Impact of chronic disease on quality of life among the elderly in the state of São Paulo, Brazil: a population-based study.
Rev Panam Salud Publica. 2009;25(4):314-21. DOI:10.1590/S1020-49892009000400005
13. Lima-Costa MF, Firmo JOA, Uchoa E. A estrutura da auto-avaliação da saúde entre idosos: projeto
Bambuí. Rev Saude Publica. 2004;38(6):827-34.
DOI:10.1590/S0034-89102004000600011
14. Martinez DJ, Kasl SV, Gill TM, Barry LC. Longitudinal association between self-rated health and timed gait among older persons. J Gerontol B Psychol Sci Soc Sci. 2010;65(6):715-9. DOI:10.1093/geronb/gbp115 15. Millán-Calenti JC, Sánchez A, Lorenzo T, Maseda A.
Depressive symptoms and other factors associated with poor self-rated health in the elderly: gender differences. Geriatr Gerontol Int. 2012;12(2):198-206. DOI:10.1111/j.1447-0594.2011.00745.x
16. Neri AL. Qualidade de vida na velhice e subjetividade. In: Neri AL, organizadora. Qualidade de vida na velhice: enfoque multidisciplinar. Campinas: Alínea; 2007. p.13-59. 17. Nunes APN, Barreto SM, Gonçalves LG. Relações sociais
e autopercepção da saúde: Projeto Envelhecimento e Saúde. Rev Bras Epidemiol. 2012;15(2):415-28. DOI:10.1590/S1415-790X2012000200019 18. Ostbye T, Malhotra R, Chan A. Thirteen dimensions of
health in elderly Sri Lankans: results from a Nation Sri Lanka Aging Survey. J Am Geriatr Soc. 2009;57(8):1376-87. DOI:10.1111/j.1532-5415.2009.02350.x
19. Pagotto V, Nakatani AYK, Silveira EA. Fatores associados à autoavaliação de saúde ruim em idosos usuários do Sistema Único de Saúde.
Cad Saude Publica. 2011;27(8):1593-602. DOI:10.1590/S0102-311X2011000800014 20. Robert SA, Cherepanov D, Palta M, Dunham NC,
Feeny D, Fryback DG. Socioeconomic status and age variations in health-related quality of life: results from the National Health Measurement Study. J Gerontol B Psychol Sci Soc Sci. 2009;64(3):378-89. DOI:10.1093/geronb/gbp012
21. Rosero-Bixby L, Dow WH. Surprising SES gradients in mortality, health and biomarkers in a Latin American population of adults. J Gerontol B Psychol Sci Soc Sci. 2009;64(I):105-17. DOI:10.1093/geronb/gbn004 22. Scazufca M, Menezes PR, Vallada H, Araya R.
Validity of the self-reporting questionnaire-20 in epidemiological studies with older adults. Soc Psychiatry Psychiatr Epidemiol. 2009;44:247-54. DOI 10.1007/s00127-008-0425-y
23. Schmidt MI, Duncan BB, Azevedo e Silva G, Menezes AM, Monteiro CA, Barreto SM, et al. Chronic non-communicable diseases in Brazil: burden and current challenges. Lancet. 2011;377(9781):1949-61. DOI:10.1016/S0140-6736(11)60135-9
24. Siahpush M, Spittal M, Singh GK. Happiness and life satisfaction prospectively predict self-rated health, physical health, and the presence of limiting, long-term health conditions. Am J Health Promot.
2008;23(1):18-26. DOI:10.4278/ajhp.061023137 25. Silva RJS, Smith-Menezes A, Tribess S, Rómo-Perez V,
Virtuoso Júnior JS. Prevalência e fatores associados à percepção negativa da saúde em pessoas idosas no Brasil. Rev Bras Epidemiol. 2012;15(1):49-62. DOI:10.1590/S1415-790X2012000100005
26. Strawbridge WJ, Wallhagen MI, Cohen RD. Succesful aging and well-being: self-rated compared with
Rowe and Kahn. Gerontologist. 2002;42(6):727-33.
DOI:10.1093/geront/42.6.727
Article based on the doctoral dissertation authored by Borim FSA, titled: “Autoavaliação de saúde e transtorno mental
comum em idosos: estudo de base populacional no município de Campinas, SP”, submitted to the Programa de
Pós-Graduação em Saúde Coletiva of the Faculdade de Ciências Médicas of the Universidade Estadual de Campinas, in 2014.
Research funded by Fundação de Amparo à Pesquisa do Estado de São Paulo (FAPESP – Process 2010/05504-9, Borim
FSA’s Doctoral Scholarship) and by Conselho Nacional de Desenvolvimento Científico e Tecnológico (CNPq – Process
409747/2006-8, Barros MBA’s research funding and productivity scholarship). The authors declare no conflict of interest.
27. Subramanian SV, Kim D, Kawachi I. Covariation in the socioeconomic determinants of self rated health and happiness: a multivariate multilevel analysis of individuals and communities in the USA.
J Epidemiol Community Health. 2005;59(8):664-9. DOI:10.1136/jech.2004.025742
28. Teixeira INDO, Neri AL. Envelhecimento bem sucedido: uma meta no curso da vida. Psicol USP. 2008;19(1):81-94. DOI:10.1590/S0103-65642008000100010
29. Wickrama K, Mancini JA, Kwag K, Kwon J.
Heterogeneity in multidimensional health trajectories of late old years and socioeconomic stratification: a latent trajectory class analysis. J Gerontol B Psychol Sci Soc
Sci. 2013;68(2):290-7. DOI:10.1093/geronb/gbs111