Temporal evolution and spatial
distribution of maternal death
Evolução temporal e distribuição
espacial da morte materna
I Centro de Ciências Biológicas e da Saúde.
Centro Universitário Univates. Lajeado, RS, Brasil
II Programa de Pós-Graduação em
Enfermagem. Universidade Federal do Rio Grande do Sul. Porto Alegre, RS, Brasil
III Programa de Pós-Graduação em Saúde
Coletiva. Universidade do Vale do Rio dos Sinos. São Leopoldo, RS, Brasil
Correspondence: Ioná Carreno
Rua Avelino Talini, 171 Bairro Universitário 95900-000 Lajeado, RS, Brasil
E-mail: [email protected] Received: 11/4/2013 Approved: 3/24/2014
Article available from: www.scielo.br/rsp
ABSTRACT
OBJECTIVE: To analyze the temporal evolution of maternal mortality and its spatial distribution.
METHODS: Ecological study with a sample made up of 845 maternal deaths in women between 10 and 49 years, registered from 1999 to 2008 in the state of Rio Grande do Sul, Southern Brazil. Data were obtained from Information System on Mortality of Ministry of Health. The maternal mortality ratio and the speciic maternal mortality ratio were calculated from records, and analyzed by the Poisson regression model. In the spatial distribution, three maps of the state were built with the rates in the geographical macro-regions, in 1999, 2003, and 2008.
RESULTS: There was an increase of 2.0% in the period of ten years (95%CI 1.00;1.04; p = 0.01), with no signiicant change in the magnitude of the maternal mortality ratio. The Serra macro-region presented the highest maternal mortality ratio (1.15, 95%CI 1.08;1.21; p < 0.001). Most deaths in Rio Grande do Sul were of white women over 40 years, with a lower level of education. The time of delivery/abortion and postpartum are times of increased maternal risk, with a greater negative impact of direct causes such as hypertension and bleeding.
CONCLUSIONS: The lack of improvement in maternal mortality ratio indicates that public policies had no impact on women’s reproductive and maternal health. It is needed to qualify the attention to women’s health, especially in the prenatal period, seeking to identify and prevent risk factors, as a strategy of reducing maternal death.
DESCRIPTORS: Maternal Mortality, trends. Risk Factors. Maternal and Child Health. Health Status Indicators. Ecological Studies.
Ioná CarrenoI
Ana Lúcia de Lourenzi BonilhaII
Maternal mortality integrates the ield of health care with women’s sexual and reproductive rights, rep-resenting an event of great magnitude and transcen-dence in Brazil and in the world. Maternal mortality is one of the most serious violations of women’s human rights, as it is avoidable in 92.0% of cases and occurs mainly in emerging countries. Maternal health has been highlighted as a priority in international politics, and it has been included as one of the United Nations’ eight Millennium Development Goals, ratiied in 2000, which include a 75.0% reduction in the maternal mor-tality rate by 2015.a
The World Health Organization (WHO) estimated that there were 536,000 maternal deaths worldwide in 2008, with a maternal mortality ratio (MMR) correspond-ing to 400 deaths per 100,000 live births and a risk of maternal death of 1 in every 92 pregnancies. Developed
RESUMO
OBJETIVO: Analisar a evolução temporal da mortalidade materna e sua distribuição espacial.
MÉTODOS: Estudo ecológico com análise dos dados referentes a 845 óbitos maternos entre 10 e 49 anos, ocorridos no período de 1999-2008, no estado do Rio Grande do Sul, Brasil. Os dados foram obtidos no Sistema de Informações sobre Mortalidade do Ministério da Saúde. Foram calculadas razões de mortalidade materna e razões de mortalidade materna especíica, as quais foram analisadas por regressão de Poisson. Na distribuição espacial foram construídos três mapas do estado com as taxas de 1999, 2003 e 2008 das sete macrorregiões.
RESULTADOS: Houve aumento de 2,0% no período de dez anos (IC95% 1,00;1,04; p = 0,01), sem mudança expressiva na magnitude da razão de mortalidade materna. A macrorregião da Serra apresentou a maior razão de mortalidade materna (1,15; IC95% 1,08;1,21; p < 0,001). A maioria dos óbitos no estado do Rio Grande do Sul ocorreu entre mulheres acima de 40 anos, com baixa escolaridade e de cor branca. O momento do parto/aborto e o puerpério imediato foram os de maior risco materno, sendo a hipertensão arterial e hemorragia as causas diretas de maior impacto negativo.
CONCLUSÕES: A não redução da mortalidade materna indica que as políticas públicas não impactaram a saúde materna e reprodutiva das mulheres. Qualiicar a atenção à saúde da mulher, sobretudo no período pré-natal, buscando identiicar e prevenir fatores de risco, vem ao encontro da redução da morte materna.
DESCRITORES: Mortalidade Materna, tendências. Fatores de Risco. Saúde Materno-Infantil. Indicadores Básicos de Saúde. Estudos Ecológicos.
INTRODUCTION
countries presented the lowest rates, with an MMR of nine deaths per 100,000 live births. In developing coun-tries, 533,000 maternal deaths were estimated to have occurred in the same period, representing an MMR of 450 deaths per 100,000 live births; most of these cases were concentrated in Africa and Asia. In Brazil, 4,100 maternal deaths were observed, representing an MMR of 110 deaths per 100,000 live births, with a risk of maternal death of 1 in every 370 pregnancies.16
Maternal mortality relects a country’s socioeconomic conditions and its population’s quality of life, as well as the public policies that promote public health actions.16,b
Thus, maternal complications that lead to death are largely a result of inadequate and/or delayed health care.c
The maternal mortality ratio is a sensitive and relevant indicator of the care and quality of women’s health. High maternal mortality levels are associated with other
a Ministério da Saúde. Secretaria de Vigilância em Saúde. Departamento de Análise de Situação de Saúde. Guia de vigilância epidemiológica
do óbito materno. Brasília (DF); 2009.
problems, like high maternal morbidity and perinatal and infant mortality. For every maternal death, there are also several cases of severe morbidity, with acute and permanent damage.8
The Ministry of Health has formulated public policies and programs focused on women’s health, such as the
Programa de Humanização de Parto e Nascimento
(PHPN – Program for the Humanization of Prenatal Care and Childbirth) in 2000, the establishment of mater-nal mortality committees and the Natiomater-nal Pact for the Reduction of Maternal Mortality in 2004. Therefore, public policies are being developed to reduce maternal mortality, in order to meet objective 5 of the Millennium Development Goals.15,a,c
Brazil recognizes regional diversities and disparities, and understands that it is responsible for establishing programs that serve the entire population. These inequal-ities have direct repercussions on women’s health and the MMR. With regard to regional differences in mater-nal mortality in Brazil, in 2003, the Northwest had an MMR of 62.8 per 100,000 live births; the North had an MMR of 56.9 per 100,000 live births; the Southeast region had an MMR of 41.7 per 100,000 live births; the Midwest had an MMR of 52.7 per 100,000 live births; and the South region had an MMR of 51.3 per 100,000 live births.16
The objective of this study was to analyze the temporal evolution of maternal mortality and its spatial distribu-tion in the state of Rio Grande do Sul.
METHODS
An ecological time-series study was conducted. The unit of analysis was the sum of all maternal deaths in both the state of Rio Grande do Sul, Southern Brazil, and its seven macro-regions, as per political and geo-graphical divisions: Metropolitan, North, Midwest, South, Missionary, Valleys, and Mountain.
Data on the number of maternal deaths of women between 10 and 49 years of age and the number of women who gave birth and remained alive was analyzed for the period 1999-2008; the data was obtained from the Sistema de Informação sobre Mortalidade (SIM – Mortality Information System) and the Sistema de Informação de Nascidos Vivos (SINASC – Live Birth Information System).d
Indicators were constructed for the maternal mortal-ity ratio (MMR) (number of maternal deaths/number
of live births in the same period × 100,000), as well as speciic maternal mortality ratios (SMMR) for both sociodemographic variables (number of maternal deaths in the 20-24 age group/number of live births to mothers 20-24 years in the same period × 100,000) and obstetric variables, [(number of deaths due to eclampsia/number of live births in the same period) × 100,000]. In some studies,13 the MMR has been called a rate or coeficient,
but these terms can only be used if the denominator was the number of pregnancies, a piece of data which is dificult to obtain. This study used the expression ratio, recommended by the Ministry of Health, since its numerator was the number of maternal deaths and the denominator was the total number of live births; the result was multiplied by 100,000, following the internationally-adopted standard.b
This study assumed the maternal mortality and spe-ciic maternal mortality ratios as dependent variables.
Independent variables were also considered, such as the state’s seven macro-regions, sociodemographic variables (age, ethnicity and education) and obstetric variables (period when the death occurred, type of obstetric cause and direct obstetric cause, according to ICD-10, Chapter 15). The classiication of direct obstetric cause followed the guidelines recommended by the Maternal Mortality Committee Manualb and by the Ministry of Health’s Guide
to Epidemiological Monitoring of Maternal Death.d The
variables were categorized according to how they were found in the SIM and SINASC.
Yearly data was collected for each variable and its cat-egories, and a database was constructed using Excel 2007 software. MMR trends in the state and macro-regions were analyzed through Poisson regressione with
robust variance using SPSS program, version 19.0. In the regression model, the year was used as an explana-tory variable. The values of the exponential of the coef-icients were presented, which showed a variation in the MMR over the analyzed period, along with their respec-tive conidence intervals of 95% and the p-value of the Wald test. The standard error of the ratios was estab-lished from the formula (ratio/population) × 100,000.9
The software R, version 2.13.0, was used to calculate the Chi-square test for the linear trend for the discrete numerical variables (age and education). For all analy-ses, the signiicance level was ≤ 0.05.f In addition, the
moving averages of the state MMR were used for trend analysis. The averages were calculated in an overlap-ping sequence, gathering data triennially. This procedure decreased any potential information loss and maximized
d Ministério da Saúde. Secretaria de Atenção a Saúde. Departamento de Ações Programáticas Estratégicas. Área Técnica de Saúde da Mulher.
Pré-Natal e puerpério: atenção qualificada e humanizada – manual técnico. Brasília (DF); 2006.
e Rosenberg D. trend analysis and interpretation. Key concepts and methods for maternal and child health professionals. Maryland: Division of
Science, Education and Analysis Maternal and Child Health Information Resource Center; 1997.
f Ministério da Saúde. Departamento de Informática em Saúde – DATASUS. Óbitos de mulheres em idade fértil e óbitos maternos – Notas
the sample size in each period, since there was no sig-niicant number of maternal deaths per year.f The use
of moving averages decreased the random variation.4
Spatial distribution analysis can be used in ecological studies that have an interest in identifying the distribu-tion of morbidities or mortalities in a given populadistribu-tion.10
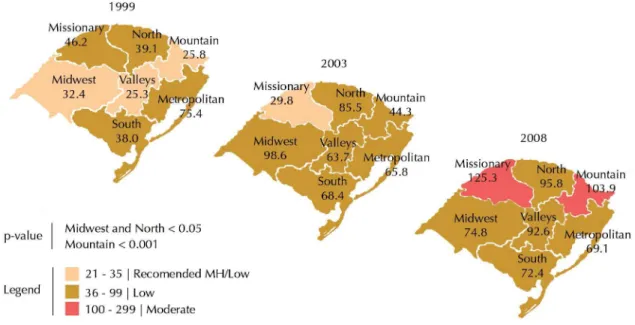
This study presents a visualization of how the MMR of both the state and its seven macro-regions evolved; the years 1999, 2003, and 2008 were chosen as the irst, ifth, and inal years of the study. It was thus possible to observe how maternal deaths occurred in the irst ive years of the study (before the PHPN existed) and in the last ive years (with the program’s implementation). A map was constructed for each year, using the program CorelDraw X3, version 13.0.0.576, 2005. Each map includes the MMR and a legend with different colors representing the WHO and Ministry of Health’s classi-ication for the risk of maternal death, considering only the classiication of the MMR in the State: “low, rec-ommended, and moderate”. Following the recommen-dations by the Ministry of Health, the “low” category was increased to an MMR of less than 35 per 100,000 live births, in an effort to reduce the acceptable param-eters of maternal death by 2015.g
This study was approved by the Research Ethics Committee at the Centro Universitário Univates, under protocol 057/11, of July 18, 2011, and the authors followed ethical procedures according to National Health Council Resolution 196/1996.
RESULTS
In Rio Grande do Sul, the SIM registered 845 maternal deaths in the analyzed period, with an average MMR of 55 per 100,000 live births. In the Poisson regres-sion analysis, an increase of 2.0% was observed in the 10 year period (95%CI 1.00;1.04), showing that there was no signiicant change in the MMR’s magnitude. Thus, the risk of maternal death remained almost the same, a inding that is statistically signiicant (p = 0.01) (Table 1). An analysis of the moving averages of mater-nal mortality showed a change in the MMR’s trend, with a mild elevation of maternal death in the period stud-ied, in particular between the irst and last (Figure 1).
With regard to the state’s macro-regions, three macro-regions with a statistically signiicant increase in MMR were identified: Mountain (1.15; 95%CI 1.08;1.21; p < 0.001), Midwest (1.07; 95%CI 1.00;1.15; p = 0.04) and North (1.06; 95%CI 1.01;1.11; p = 0.01). The Metropolitan, Missionary, South, and Valleys macro-regions did not achieve statistical signiicance in the temporal analysis, but all presented an upward trend in MMR (Table 1).
In the Mountain macro-region, the MMR showed a luc-tuation in its values, with an upward trend: in 1999, it was 25.8 per 100,000 live births; and in 2008, it was 103.9 per 100,000 live births. In the North macro-region, the values also increased over the years. The lowest MMR value was 39.1 per 100,000 live births in 1999; in 2008, it was 95.8 per 100,000 live births. The Midwest macro-region presented a variation in MMR values. The lowest MMR of this macro-region was recorded in 1999, with 32.4 per 100,000 live births; in 2006, the MMR was one of the highest, with 116.2 per 100,000 live births (Table 1).
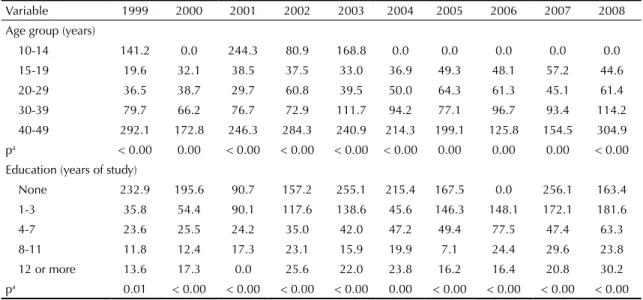
With regard to sociodemographic analysis, at the state level, there was an increase in mortality over the course of the 10 year study that corresponded with a rise in women’s ages. The age group with the highest SMMR was 40-49, with statistical signiicance (p < 0.0001). In six years of the study, there were no maternal deaths for the 10-14 age group registered in the SIM. However, in the years with registered deaths, the SMMR was always high, reaching 244.3 per 100,000 live births in 2001, a value corresponding to the WHO’s classiication of “moderate.” With regard to education, it was observed that an increase in education reduced the SMMR, with statistical signiicance throughout the analyzed period. The highest SMMR, 256.1 per 100,000 live births, was found in 2007 among women with no education (Table 2). White women presented a high and increasing SMMR throughout the period; in 2008, the SMMR reached 44.4 per 100,000 live births. In black and mulatto women, there was a luctuation in the SMMR over the years.
In the analysis of obstetric variables, a predominance of maternal deaths was observed “during pregnancy, childbirth, or abortion” and in the “postpartum period up to 42 days after the baby’s birth”. There is a note-worthy increase in the number of deaths in the “post-partum period from 43 days to one year” category, beginning in 2005.
With regard to the causes of obstetric maternal deaths, the SMMR always showed higher values for direct causes. The SMMR for direct obstetric causes was highest in 2003, with 36.3 per 100,000 live births. There was an upward trend among indirect obstetric causes of mater-nal death; in 1999, the SMMR was 11.9 per 100,000 live births, reaching its highest value in 2003, with 22.1 per 100,000 live births, and in 2008, with 18.5 per 100,000 live births. The differences were statistically signiicant (p < 0.00) in all the years. Hypertension and hemorrhage were among the leading direct causes. With regard to hypertension, the highest SMMR value found was 10.6 per 100,000 live births, in 2001 and 2006. However, in the last two years of the study, hemorrhage presented higher SMMR values, with 8.2 and 8.9 per 100,000 live births, respectively. Maternal deaths due to puerperal
infection were also important, compared with hyper-tension and hemorrhage.
In the spatial analysis, the MMR’s temporal evolution was observed over the years. None of the three maps presented an MMR of less than 20 per 100,000 live births, which the WHO considers to be an acceptable ratio. From 1999 to 2008, the Mountain macro-region moved from the “low” to “moderate” classiication, the Midwest moved from “low/recommended by the Ministry of Health” to “low” and the North’s classi-ication remained “low,” although with values above those that were recommended. In the 2008 map, the Missionary and Mountain macro-regions present a “moderate” classiication for risk of maternal death according to the WHO, surpassing an MMR of 100 per 100,000 live births. This map shows that no MMR of less than 35 per 100,000 live births was registered, which illustrated a negative trend in the state’s MMR indicator when macro-regions were observed (Figure 2).
DISCUSSION
The results showed that maternal death in Rio Grande do Sul experienced little change over the ten year period that was analyzed, and presented values above those recommended by the WHO.9 Three of the seven
macro-regions in Rio Grande do Sul were identiied as having the highest MMR values (Midwest, North, and Mountain). The women under analysis who suffered from maternal death had the following sociodemo-graphic characteristics: white women over 30 years, with little education, less than three years of study. Among the obstetric characteristics of death, it was found that the period of greatest risk is up to 42 days after preg-nancy/childbirth/abortion, and direct obstetric causes are predominant. Among these causes, hypertension and hemorrhage are some of the principal reasons for maternal death in Rio Grande do Sul.
MMR: Maternal mortality ratio
Figure 1. Moving averages of the maternal mortality ratio every
three years. Rio Grande do Sul, Southern Brazil, 1999-2008.
Mo
ving a
ver
ages of the MMR
Moving averages of the MMR (3 years)
Period 70 60 50 40 30 20 10
1999-20012000-20022001-20032002-20042003-20052004-20062005-20072006-2008
0
Table 1.
Maternal mortality and maternal mortality r
atio in the state’
s sev
en macro-regions. Rio Gr
ande do Sul, Southern Br
azil, 1999-2008. V ariable 1999 2000 2001 2002 2003 2004 2005 2006 2007 2008 Trend Coef. IC95% p n MMR n MMR n MMR n MMR n MMR n MMR n MMR n MMR n MMR n MMR State 94 50.9 83 47.0 73 45.5 100 64.4 90 60.3 87 56.9 82 55.7 84 59.4 70 52.5 82 60.7 1.020 1.004;1.036 a 0.013 Macro-regions Mid west 7 32.4 10 48.7 9 48.2 16 87.6 17 98.6 10 58.2 17 103.2 18 116.2 7 48.6 11 74.8 1.074 1.004;1.149 a 0.039 Metropolitan 62 75.4 35 44.2 37 51.6 41 58.8 44 65.8 45 65.2 41 62.0 34 52.9 48 78.4 43 69.1 1.017 0.0972;1.065 0.456 Missionary 8 46.2 8 48.7 7 48.0 19 136.0 4 29.8 10 72.7 8 61.6 8 66.9 7 63.5 14 125.3 1.066 0.997;1.140 0.061 North 7 39.1 11 63.3 7 45.6 7 47.8 12 85.5 11 77.3 12 86.5 8 61.0 6 50.1 12 95.8 1.061 1.012;1.113 a 0.014 Mountain 4 25.8 6 40.3 5 35.7 5 36.5 6 44.3 2 14.2 5 35.8 10 73.3 9 68.6 14 103.9 1.146 1.085;1.210 b 0.000 South 7 38.0 7 40.4 16 99.4 9 59.9 10 68.4 17 115.1 9 64.1 16 118.1 6 46.6 9 72.4 1.052 0.975;1.135 0.191 V alleys 3 5.3 9 81.9 4 39.5 7 70.1 6 63.7 5 50.4 9 92.3 6 64.2 4 5.5 8 92.6 1.056 0.972;1.146 0.198
The three ratio trend analyses show that maternal mortal-ity did not decrease during the period. In both the Poisson Regression and the analysis of the macro-regions’ spatial distribution, there was a statistically signiicant increase in the risk for maternal death in the Midwest, North, and Mountain macro-regions. Similarly, some macro-regions moved from “low risk” to “moderate risk,” according to the WHO classiication for maternal death, such as Missionary and Mountain. The MMR’s spatial distri-bution in the macro-regions facilitated a visualization of maternal death’s evolution, which had its greatest increase in the northern part of Rio Grande do Sul.
The highest SMMR were found in women aged 40-49 years, in both the state and macro-regions. Studies show increased risk with respect to the older age groups.11,12
In the city of Porto Alegre, RS, Southern Brazil, in the period 1999-2001, maternal deaths up to one year post-partum of women 10-49 years old presented a greater risk in women under the age of 15 or over the age of 35, with the older women being more susceptible to hyper-tensive disorders or hemorrhage because of multiparity.12
The highest SMMR was found in women with less edu-cation, in particular those with less than seven years of study. This scenario was observed in both the state and its macro-regions. Among women with eight or more years of study, the MMR were below the levels recommended by the WHO. Thus, education revealed the relationship between maternal mortality and socio-economic conditions. In a 2002 ecological study con-ducted in 26 Brazilian capital cities, with 339 maternal deaths registered in the SIM, it was found that 61.0% had seven or less years of education.14
The highest SMMR were observed among white women, followed by black women and mulatto women, for both the state and its seven macro-regions. In a study con-ducted in Porto Alegre, RS, from 1999 to 2001, 61.5% of maternal deaths were white women and 17.9% were black women.12 This result may be due to the fact
that the population of RS is largely white, because of European colonization. However, regardless of race, women should receive special attention in healthcare services; social inequalities may be relected in dificul -ties while accessing healthcare services, the low quality of care received and the lack of actions and training of healthcare professionals on the speciic risks to which women are exposed.11,12
With regard to the obstetric variables, most deaths in the state occurred “during childbirth” and “immediately after delivery”, indicating that an adequate number of healthcare professionals should be present at these crit-ical moments, including specialists to assist in labor, which may ensure better quality care to women and prevent maternal death. Studies have revealed that in addition to puerperium, this is the most vulnerable time of pregnancy, as it involves administrative and techni-cal issues such as access to health services, professional qualiications, and appropriate intervention measures.5,13
However, the increase in the number of deaths “during the postpartum period, from 43 days to one year” may be the result of work carried out by committees inves-tigating the deaths.a A study conducted in the Brazilian
capitals found that 22.6% of the deaths occurred during pregnancy; 32.6% during childbirth or up to 48h post-partum; 28.9% between 48h and 42 days in the puer-perium; 13.8% between 43 days and one year postpar-tum; and 2.1% after one year postpartum.6
Table 2. Specific maternal mortality ratio (per 100,000 live births) by age group, education level and race/color. Rio Grande
do Sul, Southern Brazil, 1999-2008.
Variable 1999 2000 2001 2002 2003 2004 2005 2006 2007 2008
Age group (years)
10-14 141.2 0.0 244.3 80.9 168.8 0.0 0.0 0.0 0.0 0.0
15-19 19.6 32.1 38.5 37.5 33.0 36.9 49.3 48.1 57.2 44.6
20-29 36.5 38.7 29.7 60.8 39.5 50.0 64.3 61.3 45.1 61.4
30-39 79.7 66.2 76.7 72.9 111.7 94.2 77.1 96.7 93.4 114.2
40-49 292.1 172.8 246.3 284.3 240.9 214.3 199.1 125.8 154.5 304.9
pa < 0.00 0.00 < 0.00 < 0.00 < 0.00 < 0.00 0.00 0.00 0.00 < 0.00 Education (years of study)
None 232.9 195.6 90.7 157.2 255.1 215.4 167.5 0.0 256.1 163.4
1-3 35.8 54.4 90.1 117.6 138.6 45.6 146.3 148.1 172.1 181.6
4-7 23.6 25.5 24.2 35.0 42.0 47.2 49.4 77.5 47.4 63.3
8-11 11.8 12.4 17.3 23.1 15.9 19.9 7.1 24.4 29.6 23.8
12 or more 13.6 17.3 0.0 25.6 22.0 23.8 16.2 16.4 20.8 30.2
With regard to late maternal mortality, a period which can compromise a women’s health, the Ministry of Health has criticized the “high” priority of pre-natal care, lead -ing to a lack of outpatient monitor-ing at the end of preg-nancy, when obstetric complications are more likely.a
An inverse relationship was observed between mater-nal mortality from direct and indirect causes; however, direct causes still predominated in 2007. Hypertension and hemorrhage were the main causes of deaths. These causes are mostly preventable with pre-natal monitor-ing and an adequate quality of care durmonitor-ing labor/birth.
In a study evaluating the types of causes of maternal deaths between 1997 and 2002, emerging countries presented 21.3% of the causes as direct and 14.4% as indirect. In Latin America and the Caribbean countries, the proportion was 3.8% for direct causes and 3.9% for indirect causes.3 In countries where the MMR is
accept-able according to the WHO’s classiication, indirect causes of maternal death predominated.7
In regard to the obstetric causes of maternal death, according to a study in the ive regions of Brazil, in 2007, 15.1% in the South region were from direct causes and 24.0% were from indirect causes. Among the direct causes, 14.6% were due to hypertensive preg-nancy disorders, 10.4% to sepsis, 8.9% to hemorrhage and 7.3% to abortion. Among the indirect causes, 7.3% of the deaths were due to HIV.2
Brazil has presented values above the international parameters recommended by the WHO. In a study on maternal mortality in the Brazilian capitals, in 2002, the MMR was 54.3 per 100,000 live births, while in the south of the country it was 42 per 100,000 live births 6
This study showed that the state of Rio Grande do Sul pre-sented lower values than Brazil, although they were still higher than those recommended by the WHO.9 The results
of the Poisson regression coeficients and their respective conidence intervals showed small differences in the 10 years studied. The risk classiication for maternal death, according to the WHO,9 placed the state in a “low” risk classiication.
However, in all the years analyzed, the MMR values were still above those “recommended” by the Ministry of Health.a
The limitations of the study are the under-reporting and under-registration of information systems in Brazil, and the aggregation of data prevents the control of confound-ing factors. However, maternal mortality in Rio Grande do Sul is an event that is threatening the health of women of a reproductive age, because of an upward trend in the MMR.
Maternal mortality, in the ield of health and reproductive rights, is of great magnitude and transcendence, and should be perceived by many health professionals and manag-ers as a fact that can be avoided. From this pmanag-erspective, maternal death should become a sentinel event; it should be possible to visualize the dificulties and conditions of women’s health care, triggering rapid and effective actions that qualify the population’s health services and healthcare. Source: Carreno I 2012, adapted from Health’s Reach in the Macro-Regions, Department of Ambulatory and Hospital Care/ State Department of Health/RS (2004).
MH: Ministry of Health
Figure 2. Spatial distribution of maternal mortality ratios in the state’s macro-regions. Rio Grande do Sul, Southern Brazil,
REFERENCES
1. Alves MR, Alves SV, Antunes MC, Santos DP. Causas externas e mortalidade materna: proposta de classificação. Rev Saude Publica. 2013;47(2):283-91. DOI:10.1590/S0034-8910.2013047003642
2. Barros FC, Matijasevich A, Requejo JH, Giugliani E, Maranhão AG, Monteiro CA, et al. Recent trends in maternal, newborn, and child health in Brazil: progress toward Millennium development goals 4 and 5. Am J Public Health. 2010;100(10):1877-89. DOI:10.2105/AJPH.2010.196816
3. González RP. Salud materno-infantil en las américas.
Rev Chil Obstet Ginecol. 2010;75(6):411-21.
DOI:10.4067/S0717-75262010000600011
4. Latorre MRDO, Cardoso MRA. Análises de séries temporais em epidemiologia: uma introdução sobre os aspectos metodológicos.
Rev Bras Epidemiol. 2001;4(3):145-52.
DOI:10.1590/S1415-790X2001000300002
5. Laurenti R, Mello-Jorge MHP, Gotlieb SLD. Reflexões sobre a mensuração da mortalidade materna. Cad Saude Publica. 2000;16(1):23-30. DOI:10.1590/S0102-311X2000000100003
6. Laurenti R, Mello-Jorge MHP, Gotlieb SLD. A mortalidade materna nas capitais brasileiras: algumas características e estimativas de um fator de ajuste. Rev Bras Epidemiol. 2004;7(4):449-60. DOI:10.1590/S1415-790X2004000400008
7. Laurenti R, Mello Jorge MH, Gotlieb LD. Mortes por doenças infecciosas em mulheres: ocorrências no ciclo gravídico-puerperal.
Rev Assoc Med Bras. 2009;55(1):64-9.
DOI:10.1590/S0104-42302009000100018
8. Magalhães MC, Bustamante-Teixeira MT. Morbidade materna extremamente grave: uso do Sistema de Informação Hospitalar. Rev Saude Publica. 2012;46(3):472-8.
DOI:10.1590/S0034-89102012005000029
9. Organização Mundial da Saúde, Estadísticas Sanitarias Mundiales 2012. Geneva; 2012.
10. Poole C. Ecologic analysis as outlook and method. Am J Public Health. 1994;84(5):715-6. DOI:10.2105/AJPH.84.5.715
11. Ramos JGL, Martins-Costa S, Vettorazzi-Stuczynski J, Brietzke E. Morte materna em hospital terciário do Rio Grande do Sul - Brasil: um estudo de 20 anos. Rev Bras Ginecol Obstet. 2003;25(6):431-6. DOI:10.1590/S0100-72032003000600008 12. Riquinho DL, Correia SG. Mortalidade
materna: perfil sócio-demográfico e causal. Rev Bras Enferm. 2006;59(3):303-7. DOI:10.1590/S0034-71672006000300010 13. Rosenstein MG, Romero M, Ramos S. Maternal
mortality in Argentina: a closer look at woman who die outside of the health system. Matern Child Health J.
2008;12(4):519-24. DOI:10.1007/s10995-007-0268-2 14. Souza MH, Cecatti JG, Hardy EE, Serruya SJ.
Morte materna declarada e o relacionamento de sistemas de informações em saúde.
Rev Saude Publica. 2007;41(2):181-9.
DOI:10.1590/S0034-89102007000200003 15. Victora CV, Aquino EML, Leal MC, Monteiro CA,
Barros FC, Szwarcwald CL. Saúde de mães e crianças no Brasil: progressos e desafios. Lancet. 2011;32-46. 16. World Health Organization. Trends in Maternal
Mortality: 1990 to 2008, estimates developed by WHO, UNICEF, UNFPA and The World Bank. Geneva; 2010.
This article is based on the doctoral thesis of Carreno I, entitled: “Mortalidade materna no Estado do Rio Grande do Sul, Brasil, no período de 1999 a 2008”, presented to the Programa de Pós-Graduação em Enfermagem at the Escola de
Enfermagem of the Universidade Federal do Rio Grande do Sul, in 2012.
HIGHLIGHTS
The objective of this study was to analyze the maternal mortality ratio’s temporal evolution and its spatial distri-bution in the seven microregions of Rio Grande do Sul (RS), Southern Brazil from 1999 to 2008 to evaluate the impact of public policies on maternal health in this indicator.
Maternal mortality is an undesirable and avoidable event. During the 10 years of the study, the public policies in place at that time were found not to have a major impact on maternal mortality. It remained almost unchanged in RS, apart from an increase in several macroregions, three of them with values exceeding limits set by WHO.
With regard to the state’s macroregions, mortality was found to be the highest in the Serra region. In relation to the maternal deaths’ proile, most deaths occurred in white women > 40 years, with a low level of education. Delivery/ abortion and the immediate postpartum period presented the highest maternal risk, with direct causes – hyperten-sion and hemorrhage – having the most negative impact.
These results should serve as a justiication for rethinking public policies on women’s health, and furthermore, rethinking the way they are implemented. Despite the fact that these policies exist, the actions seem to have been ineffective.