HESSD
12, 5841–5893, 2015Spatiotemporal variability of oxygen isotope compositions
in Greenland
J. C. Yde et al.
Title Page
Abstract Introduction
Conclusions References
Tables Figures
◭ ◮
◭ ◮
Back Close
Full Screen / Esc
Printer-friendly Version
Interactive Discussion
Discussion
P
a
per
|
Discussion
P
a
per
|
Discussion
P
a
per
|
Discussion
P
a
per
Hydrol. Earth Syst. Sci. Discuss., 12, 5841–5893, 2015 www.hydrol-earth-syst-sci-discuss.net/12/5841/2015/ doi:10.5194/hessd-12-5841-2015
© Author(s) 2015. CC Attribution 3.0 License.
This discussion paper is/has been under review for the journal Hydrology and Earth System Sciences (HESS). Please refer to the corresponding final paper in HESS if available.
Spatiotemporal variability of oxygen
isotope compositions in three contrasting
glacier river catchments in Greenland
J. C. Yde1, N. Tvis Knudsen2, J. P. Steffensen3, J. L. Carrivick4, B. Hasholt5, T. Ingeman-Nielsen6, C. Kronborg2, N. K. Larsen2, S. H. Mernild7, H. Oerter8, D. H. Roberts9, and A. J. Russell10
1
Faculty of Engineering and Science, Sogn og Fjordane University College, Sogndal, Norway
2
Department of Geoscience, University of Aarhus, Aarhus, Denmark
3
Centre for Ice and Climate, University of Copenhagen, Copenhagen, Denmark
4
School of Geography, University of Leeds, Leeds, UK
5
Department of Geosciences and Natural Resource Management, University of Copenhagen, Copenhagen, Denmark
6
Arctic Technology Centre, Technical University of Denmark, Kgs. Lyngby, Denmark
7
Glaciology and Climate Change Laboratory, Center for Scientific Studies/Centro de Estudios Cientificos (CECs), Valdivia, Chile
8
Alfred Wegener Institute, Helmholtz Center for Polar and Marine Research, Bremerhaven, Germany
9
HESSD
12, 5841–5893, 2015Spatiotemporal variability of oxygen isotope compositions
in Greenland
J. C. Yde et al.
Title Page
Abstract Introduction
Conclusions References
Tables Figures
◭ ◮
◭ ◮
Back Close
Full Screen / Esc
Printer-friendly Version
Interactive Discussion
Discussion
P
a
per
|
Discussion
P
a
per
|
Discussion
P
a
per
|
Discussion
P
a
per
|
10
School of Geography, Politics and Sociology, Newcastle University, Newcastle-upon-Tyne, UK
Received: 15 April 2015 – Accepted: 19 May 2015 – Published: 18 June 2015
Correspondence to: J. C. Yde ([email protected])
HESSD
12, 5841–5893, 2015Spatiotemporal variability of oxygen isotope compositions
in Greenland
J. C. Yde et al.
Title Page
Abstract Introduction
Conclusions References
Tables Figures
◭ ◮
◭ ◮
Back Close
Full Screen / Esc
Printer-friendly Version
Interactive Discussion
Discussion
P
a
per
|
Discussion
P
a
per
|
Discussion
P
a
per
|
Discussion
P
a
per
Abstract
Analysis of stable oxygen isotope (δ18O) characteristics is a useful tool to investigate water provenance in glacier river systems. In order to attain knowledge on the diversity of spatio-temporalδ18O variations in glacier rivers, we have examined three glacierized catchments in Greenland with different areas, glacier hydrology and thermal regimes. 5
At Mittivakkat Gletscher River, a small river draining a local temperate glacier in south-east Greenland, diurnal oscillations in δ18O occur with a three-hour time lag to the diurnal oscillations in runoff. Throughout the peak flow season the δ18O composition is controlled by the proportion between snowmelt and ice melt with episodic inputs of rainwater and occasional storage and release of a specific water component due 10
to changes in the subglacial drainage system. At Kuannersuit Glacier River on the is-land Qeqertarsuaq, theδ18O characteristics were examined after the major 1995–1998 glacier surge event. Despite large variations in the δ18O values of glacier ice on the newly formed glacier tongue, there were no diurnal oscillations in the bulk meltwater emanating from the glacier in the post-surge years 2000–2001. In 2002 there were 15
indications of diurnal oscillations, and in 2003 there were large diurnal fluctuations in δ18O. At Watson River, a large catchment at the western margin of the Greenland Ice Sheet, the spatial distribution ofδ18O in the river system was applied to fingerprint the relative runoffcontributions from sub-catchments. Spot sampling indicates that during the early melt season most of the river water (64–73 %) derived from the Qinnguata 20
Kuussua tributary, whereas the water flow on 23 July 2009 was dominated by bulk meltwater from the Akuliarusiarsuup Kuua tributary (where 7 and 67 % originated from the Russell Glacier and Leverett Glacier sub-catchments, respectively). A comparison of theδ18O compositions from glacial river water in Greenland shows distinct diff er-ences between water draining local glaciers (between−17.4 and−13.7 ‰), large ice
25
HESSD
12, 5841–5893, 2015Spatiotemporal variability of oxygen isotope compositions
in Greenland
J. C. Yde et al.
Title Page
Abstract Introduction
Conclusions References
Tables Figures
◭ ◮
◭ ◮
Back Close
Full Screen / Esc
Printer-friendly Version
Interactive Discussion
Discussion
P
a
per
|
Discussion
P
a
per
|
Discussion
P
a
per
|
Discussion
P
a
per
|
1 Introduction
Stable oxygen isotopes are natural conservative tracers in low-temperature hydrolog-ical systems (e.g. Moser and Stichler, 1980; Gat and Gonfiantini, 1981; Haldorsen et al., 1997; Kendall et al., 2013). Consequently, oxygen isotopes can be applied to determine the timing and origin of changes in water sources and flow paths because 5
different water sources often have isotopically different compositions due to their expo-sure to different isotopic fractionation processes. Since the 1970s, this technique has been widely used for hydrograph separation (Dinçer et al., 1970). Most often a con-ceptual two-component mixing model is applied, where anold watercomponent (e.g. groundwater) is mixed with a new water component (e.g. rain or snowmelt), assum-10
ing that both components have spatial and temporal homogeneous compositions. The general mixing model is given by the equation
QC=Q1C1+Q2C2+. . ., (1)
where the discharge Q and the isotopic value C are equal to the sum of their com-ponents. This simplified model has limitations when a specific precipitation event is 15
analysed because the water isotope composition in precipitation (new water) may vary considerably during a single event (e.g. McDonnell et al., 1990) and changes in contri-butions from secondaryold waterreservoirs may occur (e.g. Hooper and Shoemaker, 1986). Nevertheless, water isotope mixing models still provide valuable information on spatial differences in hydrological processes on diurnal to annual timescales (Kendall 20
et al., 2013).
A region where there is an urgent need for improving our understanding of the con-trols on water sources and flow paths is in Greenland. As in other parts of the Arc-tic, glacierized catchments in Greenland are highly sensitive to climate change (Milner et al., 2009; Blaen et al., 2014). In recent decades freshwater runofffrom the Greenland 25
HESSD
12, 5841–5893, 2015Spatiotemporal variability of oxygen isotope compositions
in Greenland
J. C. Yde et al.
Title Page
Abstract Introduction
Conclusions References
Tables Figures
◭ ◮
◭ ◮
Back Close
Full Screen / Esc
Printer-friendly Version
Interactive Discussion
Discussion
P
a
per
|
Discussion
P
a
per
|
Discussion
P
a
per
|
Discussion
P
a
per
GrIS contributes with 0.33 mm sea level equivalent yr−1to global sea level rise (1993–
2010; Vaughan et al., 2013). In addition, ice mass loss from local glaciers (i.e. glaciers and ice caps peripheral to the GrIS; Weidick and Morris, 1998) has resulted in a global sea level rise of 0.09 mm sea level equivalent yr−1(1993–2010; Vaughan et al., 2013).
The changes in runoff are coupled to recent warming in Greenland (Hanna et al., 5
2012, 2013; Mernild et al., 2014), an increasing trend in precipitation and changes in precipitation patterns (Bales et al., 2009; Mernild et al., 2015a), and a decline in albedo (Bøggild et al., 2010; Tedesco et al., 2011; Box et al., 2012; Yallop et al., 2012; Mernild et al., 2015b). Also, extreme surface melt events have occurred in recent years (Tedesco et al., 2008, 2011; van As et al., 2012) and in July 2012 more than 97 % of the 10
GrIS experienced surface melting (Nghiem et al., 2012; Keegan et al., 2014). In this cli-mate change context, detailed catchment-scale studies on water source and water flow dynamics are urgently needed to advance knowledge of the potential consequences of future hydrological changes in Greenlandic river catchments. This knowledge has relevance on a local scale too because it will assist with water management such as 15
flood control and hydropower production.
In glacier-fed river systems, the principal water sources to bulk runoffderive from ice melt, snowmelt, rainfall and groundwater components. Depending on the objectives of the study and on the environmental setting, hydrograph separation of glacial rivers has been based on assumed end-member isotope-mixing between two or three prevail-20
ing components (Behrens et al., 1971, 1978; Fairchild et al., 1999; Mark and Seltzer, 2003; Theakstone, 2003; Yde and Knudsen, 2004; Mark and McKenzie, 2007; Yde et al., 2008; Bhatia et al., 2011; Kong and Pang, 2012; Ohlanders et al., 2013; Blaen et al., 2014; Dahlke et al., 2014; Hindshaw et al., 2014; Meng et al., 2014; Penna et al., 2014; Rodriguez et al., 2014; Zhou et al., 2014). As glacierized catchments deviate in 25
HESSD
12, 5841–5893, 2015Spatiotemporal variability of oxygen isotope compositions
in Greenland
J. C. Yde et al.
Title Page
Abstract Introduction
Conclusions References
Tables Figures
◭ ◮
◭ ◮
Back Close
Full Screen / Esc
Printer-friendly Version
Interactive Discussion
Discussion
P
a
per
|
Discussion
P
a
per
|
Discussion
P
a
per
|
Discussion
P
a
per
|
such as ice melt into several ice facies sub-components (Yde and Knudsen, 2004). However, in highly glacierized catchments the variability in oxygen isotope composition is generally controlled by seasonal snowmelt and ice melt with episodic inputs of rain-water, whereas contributions from shallow groundwater flow may become important in catchments, where glaciers comprise a small proportion of the total area (e.g. Blaen 5
et al., 2014).
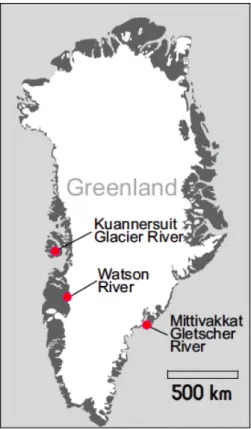
In this study, we examine the oxygen isotope composition in three Greenlandic glacier river systems, which are selected for this study because they are draining very different glaciological environments (Fig. 1): Mittivakkat Gletscher River (13.6 km2) drains a local glacier in southeast Greenland; Watson River (∼9743 km2) drains a
sec-10
tor of the GrIS in West Greenland; and Kuannersuit Glacier River (258 km2) drains a local glacier on the island Qeqertarsuaq, West Greenland, that recently experienced a major glacier surge event. Our aim is to determine the magnitude and variability of the hydrological processes that govern the oxygen isotope composition in contrast-ing glacierized catchments with land-terminatcontrast-ing glaciers. First, we present the results 15
and interpretations from each glacier river setting. Then, we compare our findings with previous investigations to characterize the oxygen isotope composition in Greenlandic glacier rivers.
2 Study sites
2.1 Mittivakkat Gletscher River, Ammassalik Island, southeast Greenland
20
Mittivakkat Gletscher (65◦41′N, 37◦50′W) is the largest glacier complex on Ammas-salik Island, southeast Greenland (Fig. 2a). The entire glacier covers an area of 26.2 km2 (in 2011; Mernild et al., 2012a) and has an altitudinal range between 160 and 880 m a.s.l. (Mernild et al., 2013a). Bulk meltwater from the glacier drains primarily westwards to the proglacial Mittivakkat Valley and emanates into the Sermilik Fjord. 25
HESSD
12, 5841–5893, 2015Spatiotemporal variability of oxygen isotope compositions
in Greenland
J. C. Yde et al.
Title Page
Abstract Introduction
Conclusions References
Tables Figures
◭ ◮
◭ ◮
Back Close
Full Screen / Esc
Printer-friendly Version
Interactive Discussion
Discussion
P
a
per
|
Discussion
P
a
per
|
Discussion
P
a
per
|
Discussion
P
a
per
subglacial meltwater portal and defines a hydrological catchment area of 13.6 km2, of which 9.0 km2 are glacierised (66 %). The maritime climate is Low Arctic with annual precipitation ranging from 1400 to 1800 mm water equivalent (w.e.) yr−1 (1998–2006)
and a mean annual air temperature at 515 m a.s.l. of −2.2◦C (1993–2011) (updated
from Mernild et al., 2008a). There are no observations of contemporary permafrost in 5
the area, and the proglacial vegetation cover is sparse.
The glacier has undergone continuous recession since the end of the Little Ice Age (Knudsen et al., 2008; Mernild et al., 2011a). In recent decades the recession has ac-celerated and the glacier has lost approximately 29 % of its volume between 1994 and 2012 (Yde et al., 2014a), and surface mass balance measurements indicate a mean 10
thinning rate of 1.01 m w.e. yr−1 between 1995/1996 and 2011/2012 (Mernild et al., 2013a). Similar to other local glaciers in the Ammassalik region, Mittivakkat Gletscher is severely out of contemporary climatic equilibrium (Mernild et al., 2012a, 2013b) and serves as a type location for studying the impact of climate change on glacierized river catchments in southeast Greenland (e.g. Mernild et al., 2008b, 2015b; Bárcena et al., 15
2010, 2011; Kristiansen et al., 2013; Lutz et al., 2014).
2.2 Kuannersuit Glacier River, Qeqertarsuaq, West Greenland
Kuannersuit Glacier (69◦46′N, 53◦15′W) is located in central Qeqertarsuaq (formerly Disko Island), West Greenland (Fig. 2b). It is an outlet glacier descending from the Ser-mersuaq ice cap and belongs to the Qeqertarsuaq–Nuussuaq surge cluster (Yde and 20
Knudsen, 2007). In 1995, the glacier started to surge down the Kuannersuit Valley with a frontal velocity up to 70 m day−1(Larsen et al., 2010). By the end of 1998 or beginning
of 1999, the surging phase terminated and the glacier went into its quiescent phase, which is presumed to last more than hundred years (Yde and Knudsen, 2005a). The 1995–1998 surge of Kuannersuit Glacier is one of the largest land-terminating surge 25
HESSD
12, 5841–5893, 2015Spatiotemporal variability of oxygen isotope compositions
in Greenland
J. C. Yde et al.
Title Page
Abstract Introduction
Conclusions References
Tables Figures
◭ ◮
◭ ◮
Back Close
Full Screen / Esc
Printer-friendly Version
Interactive Discussion
Discussion
P
a
per
|
Discussion
P
a
per
|
Discussion
P
a
per
|
Discussion
P
a
per
|
Kuannersuit Glacier River emanates from a portal at the western side of the glacier terminus and the sampling site is located 200 m down-stream (Yde et al., 2005a). The catchment area covers 258 km2 of which Kuannersuit Glacier constitutes 103 km2 of the total glacierized area of 168 km2 with an altitude range of 100–1650 m a.s.l. (Yde and Knudsen, 2005a). The valley floor consists of unvegetated outwash sediment, 5
dead-ice deposits and ice-cored, vegetated terraces. The proglacial area of the catch-ment is situated in the continuous permafrost zone (Yde and Knudsen, 2005b), and the climate is polar continental (Humlum, 1999). There are no meteorological obser-vations from the area, but at the coastal town of Qeqertarsuaq (formerly Godhavn) located 50 km to the southwest the MAAT were−2.7 and−1.7◦C in 2011 and 2012,
10
respectively (Cappelen, 2013).
2.3 Watson River, West Greenland
Watson River (67◦00′N, 50◦41′W) drains a sector of the Greenland Ice Sheet (GrIS) in central West Greenland (Fig. 2c). Hasholt et al. (2013) recently estimated the catch-ment area to 9743 km2, but the dynamic nature of drainage flow-paths in ice sheets 15
makes an accurate estimation difficult. The proglacial part of the river system is 25– 35 km in length and consists of two tributaries: Akuliarusiarsuup Kuua to the north and Qinnguata Kuussua to the south. While Akuliarusiarssuup Kuua comprises the most well-examined land-terminating GrIS outlet glaciers (Russell Glacier and Leverett Glacier), no glacio-hydrological studies have yet been conducted in Qinnguata Kuus-20
sua.
The primary sampling site is located after the junction of the tributaries and∼500 m from where Watson River drains into the fjord Kangerlussuaq (Søndre Strømfjord) (Yde et al., 2014b). Other sampling sites are situated along the river in Akuliarusiar-suup Kuua and at a site in Qinnguata Kuussua ∼700 m upstream from the junction 25
HESSD
12, 5841–5893, 2015Spatiotemporal variability of oxygen isotope compositions
in Greenland
J. C. Yde et al.
Title Page
Abstract Introduction
Conclusions References
Tables Figures
◭ ◮
◭ ◮
Back Close
Full Screen / Esc
Printer-friendly Version
Interactive Discussion
Discussion
P
a
per
|
Discussion
P
a
per
|
Discussion
P
a
per
|
Discussion
P
a
per
permafrost is continuously distributed in the proglacial area (van Tatenhove and Olsen, 1994; Christiansen et al., 2010). The climate is characterized as a polar desert with a mean annual precipitation of only 149 mm at the river mouth (1961–1990; Cappelen, 2013) and even drier conditions further inland (van den Broeke et al., 2009).
This sector of the ice sheet margin experienced a period of frontal advance between 5
1968 and 1999 (van Tatenhove, 1996; Knight et al., 2000). Since then, the ice sheet periphery has thinned without receding. Recently, several studies have examined the hydrology, hydrochemistry and glacial microbiology of the catchment (Bartholomew et al., 2010; Hodson et al., 2010; Mernild et al., 2010, 2011b, 2012b; Wimpenny et al., 2010, 2011; Cook et al., 2012; Cowton et al., 2012; Rennermalm et al., 2012, 2013; 10
Ryo and Jacobson, 2012; Stibal et al., 2012a–d; Telling et al., 2012; van As et al., 2012; Yallop et al., 2012; Bellas et al., 2013; Chandler et al., 2013; Hasholt et al., 2013; Meierbachtol et al., 2013; Dieser et al., 2014; Graly et al., 2014; Hawkings et al., 2014; Hindshaw et al., 2014; Lawson et al., 2014; Yde et al., 2014b; Clason et al., 2015). In particular, jökulhlaups from ice-dammed lakes in the Akuliarusiarsuup Kuua tributary 15
have received attention (Sugden et al., 1985; Russell and de Jong, 1988; Russell, 1989, 1993a, b, 2007, 2009; Russell et al., 1990, 1995, 2011; Česnulevičius et al., 2009; Mernild and Hasholt, 2009; Carrivick et al., 2013; Mikkelsen et al., 2013). Hence, the Watson River catchment and its sub-catchments are key locations for studies that provide significant improvements of our knowledge of hydrological, glaciological and 20
ecosystem processes occurring at the GrIS margin.
3 Sampling and analysis
All water samples were collected manually in 20 mL vials. Snow and ice samples were collected in 250 mL polypropylene bottles or plastic bags before being slowly melted at room temperature and decanted to 20 mL vials. The vials were stored in cold (∼5◦C)
25
HESSD
12, 5841–5893, 2015Spatiotemporal variability of oxygen isotope compositions
in Greenland
J. C. Yde et al.
Title Page
Abstract Introduction
Conclusions References
Tables Figures
◭ ◮
◭ ◮
Back Close
Full Screen / Esc
Printer-friendly Version
Interactive Discussion
Discussion
P
a
per
|
Discussion
P
a
per
|
Discussion
P
a
per
|
Discussion
P
a
per
|
The relative deviations (δ) of wter isotope compositions (18O/16O and D/H) were expressed in per mil (‰) relative to Vienna Standard Mean Ocean Water (0 ‰) (Coplen, 1996). The stable oxygen isotope analyses of all samples from Mittivakkat Glacier River and Kuannersuit River and most samples from Watson River were performed at the Niels Bohr Institute, University of Copenhagen, Denmark, using mass spectrometry 5
with an instrumental precision of±0.1 ‰ in the oxygen isotope ratio (δ18O) value. The
1992 samples from Watson River were analyzed at the Alfred Wegener Institute in Bremerhaven, Germany.
In this study, we focused on δ18O, but it should be kept in mind that hydrograph separations based onδ18O or δD may not necessarily produce similar results (Lyon 10
et al., 2009), despite their mutual relations to the local meteoric water line (Craig, 1961; Dansgaard, 1964). This deviation is likely to occur in dry environments such as in the Watson River catchment, where kinetic effects during evaporation and sublimation pro-cesses may cause deviations in the isotopic fractionation of δ18O and δD (Johnsen et al., 1989). This issue with different results obtained by using different isotopes has 15
not been addressed for glacier-fed river systems and the potential discrepancy is there-fore not known.
Stage–discharge relationships were used to determine runoffat each study site. For details on runoffmeasurements we refer to Hasholt and Mernild (2006) for Mittivakkat Gletscher River and Yde et al. (2005) for Kuannersuit Glacier River. The accuracy of 20
individual runoffmeasurements is within±10–15 %.
4 Results and discussion
4.1 Mittivakkat Gletscher River
The Mittivakkat Gletscher River catchment makes an ideal site for investigating tempo-ral variations in the oxygen isotope composition of glacial river water due to the poten-25
HESSD
12, 5841–5893, 2015Spatiotemporal variability of oxygen isotope compositions
in Greenland
J. C. Yde et al.
Title Page
Abstract Introduction
Conclusions References
Tables Figures
◭ ◮
◭ ◮
Back Close
Full Screen / Esc
Printer-friendly Version
Interactive Discussion
Discussion
P
a
per
|
Discussion
P
a
per
|
Discussion
P
a
per
|
Discussion
P
a
per
on δ18O is valuable for validating the proportional contributions of snowmelt and ice melt in dynamic glacier models, which aim to elucidate future climate-driven changes in glacier volume and runoffgeneration. On Mittivakkat Gletscher, three snow pits were excavated at different altitudes in May 1999, showing a mean δ18O composition of
−16.5±0.6 ‰ in winter snow (Dissing, 2000). Also, two ice-surface δ18O records of
5
2.84 and 1.05 km in length (10 m sampling increments) were obtained from the glacier terminus towards the equilibrium line (Boye, 1999). The glacier iceδ18O ranged be-tween−15.0 and−13.3 ‰ with a meanδ18O of−14.1 ‰, and the theoretical altitudinal
effect (Dansgaard, 1964) of higherδ18O towards the equilibrium line altitude (ELA) was not observed. The reasons for an absence of aδ18O lapse rate are most likely due to 10
the limited size and altitudinal range of Mittivakkat Gletscher, but ice dynamics, ice age and meteorological conditions, such as frequent inversion (Mernild and Liston, 2010), may also have an impact. Based on these observations it is evident that end-member snowmelt has a relatively lowδ18O compared to end-member ice melt and that these two water source components can be separated. The δ18O of summer rain has not 15
been determined in this region, but at the coastal village of Ittoqqortoormiit, located
∼840 km to the north of Mittivakkat Gletscher, observations show monthly meanδ18O
in rainwater of −12.8, −9.1 and −8.8 ‰ in June, July and August, respectively (data
available from the International Atomic Energy Agency database WISER).
Oxygen isotope samples were collected from Mittivakkat Gletscher River during the 20
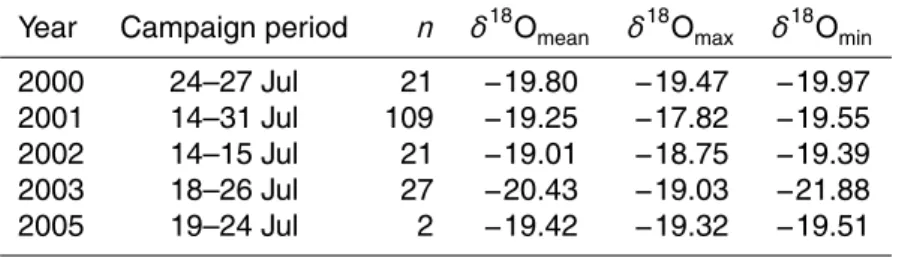
years 2003–2009 (Table 1). Most of the sampling campaigns were conducted in August at the end of the peak flow period (i.e. the summer period with relative high runoff), where the mean annual δ18O value was −14.68±0.18 ‰ (here and elsewhere the
uncertainty of δ18O is given by the standard deviation). We conducted three multi-sample tests at 14:00 LT (local time) on 9, 15 and 21 August 2004 to determine the 25
HESSD
12, 5841–5893, 2015Spatiotemporal variability of oxygen isotope compositions
in Greenland
J. C. Yde et al.
Title Page
Abstract Introduction
Conclusions References
Tables Figures
◭ ◮
◭ ◮
Back Close
Full Screen / Esc
Printer-friendly Version
Interactive Discussion
Discussion
P
a
per
|
Discussion
P
a
per
|
Discussion
P
a
per
|
Discussion
P
a
per
|
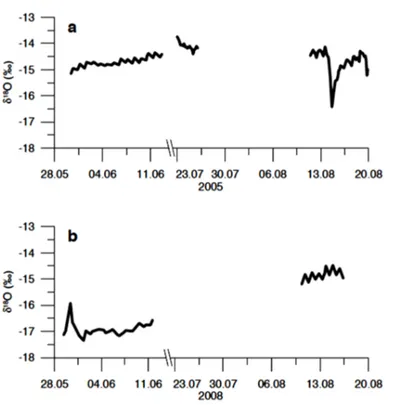
In the years 2005 and 2008, meltwater was also collected during the early melt season (i.e. the period before the subglacial drainage system is well-established) to evaluate the seasonal variability in theδ18O signal. In 2005, the onset of ice melt had commenced before the early melt season sampling campaign, as reflected in δ18O ranging from−15.16 ‰ in late May to−14.35 ‰ in mid-June (Fig. 3a). During this
pe-5
riod δ18O increased by 0.04 ‰ per day, which is equal to a daily increase of 1.7 in the ice melt-to-snowmelt ratio, assuming end-memberδ18O compositions of snowmelt and ice melt as observed in snow and ice samples. In contrast, the 2008 onset of ice melt was delayed and snowmelt totally dominated the bulk composition of the river water, except on 30 May 2008 where a rainfall event (19 mm in the nearby town of Tasi-10
ilaq; Cappelen, 2013) caused a positive peak inδ18O of∼1 ‰ (Fig. 3b). Episodic
ef-fects onδ18O by precipitation seem common. For instance, another short-term change occurred on 14–15 August 2005 (Fig. 3a), where a negative peak inδ18O of ∼2 ‰ coincided with a snowfall event (14 mm in Tasiilaq; Cappelen, 2013) and subsequent elevated contribution from snowmelt.
15
The most intensively sampled period was from 8 to 22 August 2004, where sam-pling was conducted with a 4 h frequency supplemented by short periods of higher fre-quency sampling. We use these 2004 data to assess oxygen isotope dynamics in the Mittivakkat Gletscher River during the peak flow period when the subglacial drainage system is assumed to be well-established, transporting the majority of meltwater in 20
a channelized network. In Fig. 4, the 2004 δ18O time-series is shown together with runoff(at the hydrometric station), air temperature (at a nunatak at 515 m a.s.l.) and electrical conductivity (at the hydrometric station; corrected to 25◦C). There was no precipitation during the entire sampling period, except for some drizzle on 8 August prior to the collection of the first sample. The time-series shows characteristic diurnal 25
in-HESSD
12, 5841–5893, 2015Spatiotemporal variability of oxygen isotope compositions
in Greenland
J. C. Yde et al.
Title Page
Abstract Introduction
Conclusions References
Tables Figures
◭ ◮
◭ ◮
Back Close
Full Screen / Esc
Printer-friendly Version
Interactive Discussion
Discussion
P
a
per
|
Discussion
P
a
per
|
Discussion
P
a
per
|
Discussion
P
a
per
creasing values. The runoffstayed almost constant until a rapid 39 % increase in runoff occurred at 13:00 LT on 12 August, accompanied by an increase inδ18O and decrease in electrical conductivity. Thereafter, runoffremained at an elevated level for more than two days before retaining the diurnal oscillation pattern again. Hydrograph separation of water sources is a helpful tool to elucidate the details of this event.
5
We apply time-series cubic spline interpolation to estimateδ18O at one-hour time-step increments, matching the temporal resolution of the runoffobservations. This ap-proach allows a better assessment of the diurnalδ18O signal. For instance, it shows that theδ18O signal lags three hours behind runoff(r2=0.66; linear correlation without
lag showsr2=0.58), indicating the combined effect of the two primary components,
10
snowmelt and ice melt, on theδ18O variations. The diurnal amplitude inδ18O ranged between 0.11 ‰ (11 August 2004) and 0.49 ‰ (16 August 2004). However, there was no statistical relation between diurnalδ18O amplitude and daily air temperature am-plitude (r2=0.28), indicating that other forcings than variability in surface melting may have a more dominant effect on the responding variability inδ18O.
15
Based on the assumption that snowmelt and ice melt reflect their end-member δ18O compositions, a hydrograph showing contributions from snowmelt and ice melt is constructed for the 2004 sampling period (Fig. 5). The ice melt component con-stitutes 82±5 % of the total runoff and dominates the observed variations in total
runoff(r2=0.99). This is expected late in the peak flow season, where the subglacial 20
drainage mainly occurs in a channelized network in the lower part of the glacier. The slightly decreasing trend in the daily snowmelt component is likely a consequence of the diminishing snow cover on the upper part of the glacier. The snowmelt component peaks around 10:00–13:00 LT each day, reflecting the long distance from the melting snowpack to the proglacial sampling site and the existence of an inefficient distributed 25
subglacial drainage network in the upper part of the glacier.
HESSD
12, 5841–5893, 2015Spatiotemporal variability of oxygen isotope compositions
in Greenland
J. C. Yde et al.
Title Page
Abstract Introduction
Conclusions References
Tables Figures
◭ ◮
◭ ◮
Back Close
Full Screen / Esc
Printer-friendly Version
Interactive Discussion
Discussion
P
a
per
|
Discussion
P
a
per
|
Discussion
P
a
per
|
Discussion
P
a
per
|
channel. The hydrograph separation (Fig. 5) shows that the proportion between ice melt and snowmelt remains almost constant after the event commenced, indicating that the bulk water derived from a well-mixed part of the drainage system, which is unaffected by the large diurnal variation in ice melt generation. This suggests that the functioning drainage network transports meltwater from the upper part of the glacier 5
with limited connection to the drainage network on the lower part. Meanwhile, ice melt is stored in a dammed section of the subglacial network located in the lower part of the glacier, and suddenly released when the dam breaks at 13:00 LT on 12 August (Fig. 5). In the following hours ice melt comprised up to 94 % of the total runoff. On 13 Au-gust the snowmelt component peaked at noon but then dropped markedly and in the 10
evening it only constituted 4 % of the total runoff. On 14 August there were still some minor disturbances in the lower drainage network, but from 15 August the drainage system had stabilized and the characteristic diurnal glacionival oscillations had taken over (Figs. 4 and 5).
4.2 Kuannersuit Glacier River
15
During five field seasons in July 2000, 2001, 2002, 2003 and 2005, oxygen isotope samples were collected from Kuannersuit Glacier River (Table 2). The observed mean annualδ18O was−19.58±0.55 ‰ (the uncertainty is given by the standard deviation).
A consequence of the surge event was that the glacier front was relocated from a posi-tion at an altitude of∼500 to 100 m a.s.l., while a significant part of the glacier surface
20
in the accumulation area was lowered by more than 100 m to altitudes below the ELA (∼1100–1300 m a.s.l.). A helicopter survey in July 2002 revealed that the post-surge accumulation area ratio was less than 20 % (Yde et al., 2005a). Hence, we assume that the primary post-surge water source during the peak flow period is ice melt, partic-ularly from ablation of the new glacier tongue. However, longitudinal and transverse ice 25
HESSD
12, 5841–5893, 2015Spatiotemporal variability of oxygen isotope compositions
in Greenland
J. C. Yde et al.
Title Page
Abstract Introduction
Conclusions References
Tables Figures
◭ ◮
◭ ◮
Back Close
Full Screen / Esc
Printer-friendly Version
Interactive Discussion
Discussion
P
a
per
|
Discussion
P
a
per
|
Discussion
P
a
per
|
Discussion
P
a
per
which was sampled 3250 m up-glacier with 50 m increments, showed a more system-atic trend where relatively highδ18O values were observed along both lateral margins. From the centre towards the western margin an increasing trend of 0.46 ‰ per 100 m prevailed, whereas the eastern central part showed large fluctuations inδ18O between
−22.69 and−20.08 ‰. The total range of measuredδ18O in glacier ice along the
trans-5
verse transect was 4.14 ‰. A possible explanation of this marked spatial variability may be that the ice forming the new tongue derived from different pre-surge reservoirs on the upper part of the glacier. If so, it is very likely that the marginal glacier ice was formed at relatively low elevations (highδ18O signal), whereas the glacier ice in the western central part mainly derived from high elevation areas of Sermersuaq ice cap 10
(low δ18O signal). At present, there are no comparable studies on transverse varia-tions inδ18O across glacier tongues. It is therefore unknown whether a high variability inδ18O is a common phenomenon or related specific circumstances such as surge activity or present of tributary glaciers.
During the surge event, a thick debris-rich basal ice sequence was formed beneath 15
the glacier and exposed along the glacier margins and at the glacier terminus (Yde et al., 2005b; Roberts et al., 2009; Larsen et al., 2010). The basal ice consisted of various genetic ice facies, where different isotopic fractionation processes during the basal ice formation resulted in variations in theδ18O composition. Theδ18O in massive stratified ice was−16.6±1.9 ‰ (n=10); in laminated stratified ice it was−19.6±0.7 ‰
20
(n=9) and in dispersed ice it was −18.8±0.6 ‰ (n=41) (Larsen et al., 2010). The
glacier ice above the profiles showedδ18O of−19.4±0.9 ‰ (n=20; lower section with debris layers formed by thrusting) and −19.8±1.1 ‰ (n=37; upper section without
debris layers) (Larsen et al., 2010). Also, during the termination of the surge event in the winter 1998/1999 proglacial naled (extrusive ice assemblage formed in front of 25
the glacier by rapid freezing of winter runoff and/or proglacial upwelling water mixed with snow) was stacked into ∼3 m thick sections of thrust-block naled at the glacier
HESSD
12, 5841–5893, 2015Spatiotemporal variability of oxygen isotope compositions
in Greenland
J. C. Yde et al.
Title Page
Abstract Introduction
Conclusions References
Tables Figures
◭ ◮
◭ ◮
Back Close
Full Screen / Esc
Printer-friendly Version
Interactive Discussion
Discussion
P
a
per
|
Discussion
P
a
per
|
Discussion
P
a
per
|
Discussion
P
a
per
|
−20.05±0.52 ‰ (n=60; excluding a outlier polluted by rainwater; Yde and Knudsen,
2005b). In general, the basal ice and incorporated naled showed higher δ18O than glacier ice at the central part of the tongue, butδ18O of basal ice and naled were within theδ18O range of marginal glacier ice. Hence, the ice melt component in bulk runoff comprised water from several ice facies sub-component sources with various δ18O 5
values and spatial variability. It was not possible to access snow on the upper part of the glacier, so noδ18O values on snowmelt were measured. Rainwater was collected during rainfall events in July 2002, showing a wide range inδ18O between−18.78 and
−6.57 ‰ and a medianδ18O of−10.32±4.49 ‰ (n=7).
With the large δ18O variations from different sources in mind, it is interesting to 10
analyse the post-surge diurnal δ18O signal. Figure 7 shows the diurnal δ18O varia-tions during four July days in the years 2000–2003. There was no diurnal oscillation in 2000 and 2001, but a tendency appeared in 2002 with low δ18O (∼ −19.4 ‰)
be-tween 09:00 and 15:00 LT and highδ18O (∼ −18.8 ‰) in the evening (20:00–02:00 LT).
In 2003, the fluctuations were much larger than in the preceding years, but the high-15
est δ18O (−19.03 ‰) was measured at 21:00 LT and low δ18O prevailed during the
night (∼21.0 ‰). The trend in diurnal variability was also evident in the standard
devi-ations, which increased from±0.07 ‰ in 2000 to±0.11,±0.23 and±0.70 ‰ in 2001, 2002 and 2003, respectively. In comparison, multi-sampling tests were conducted in 2001, 2002 and 2003, showing a standard deviation variability of ±0.16 ‰ (n=5),
20
±0.13 ‰ (n=17) and ±0.44 ‰ (n=22), respectively. This indicates that the glacier
runoff was not well-mixed in 2003, probably because different parts of the drainage system merged close to the glacier portal.
Based on the available data, it is not possible to conduct hydrograph separation in the years following the surge event. The lack of strong diurnal oscillations indicates ei-25
HESSD
12, 5841–5893, 2015Spatiotemporal variability of oxygen isotope compositions
in Greenland
J. C. Yde et al.
Title Page
Abstract Introduction
Conclusions References
Tables Figures
◭ ◮
◭ ◮
Back Close
Full Screen / Esc
Printer-friendly Version
Interactive Discussion
Discussion
P
a
per
|
Discussion
P
a
per
|
Discussion
P
a
per
|
Discussion
P
a
per
(unknown δ18O composition) or precipitation (higher δ18O composition than runoff). We therefore hypothesize that the presence of a well-mixed drainage network is the most likely reason for the observed δ18O signal in the bulk runoff from Kuannersuit Glacier.
During the surge event the glacier surface became heavily crevassed and the pre-5
existing drainage system collapsed (Yde and Knudsen, 2005a). It is a generally ac-cepted theory that the drainage system of surging glaciers transform into a distributed network where meltwater is routed via a system of linked cavities (Kamb et al., 1985; Kamb, 1987), but little is known about how subglacial drainage systems evolve into dis-crete flow systems in the years following a surge event. In the initial quiescent phase 10
at Kuannersuit Glacier, ongoing changes in the drainage system were evident by fre-quent loud noises from roof collapses inside the drainage system and episodic export of ice blocks from the portal. A consequence of these processes is also visible on the glacier surface, where circular collapse chasms formed above marginal parts of the subglacial drainage system (Yde and Knudsen, 2005a). In Fig. 8, some of the episodic 15
damming and meltwater release events are seen as peaks on the runoffcurve from July 2001. The 2001 runoffmeasurements showed diurnal oscillations with minimums around 10:00–12:00 LT and maximums at 19:00–20:00 LT, correlating with reversed oscillations in solutes (Yde et al., 2005a) and poorly with suspended sediment concen-trations (Knudsen et al., 2007). However, the variability ofδ18O did not correlate with 20
any of these variables.
4.3 Watson River
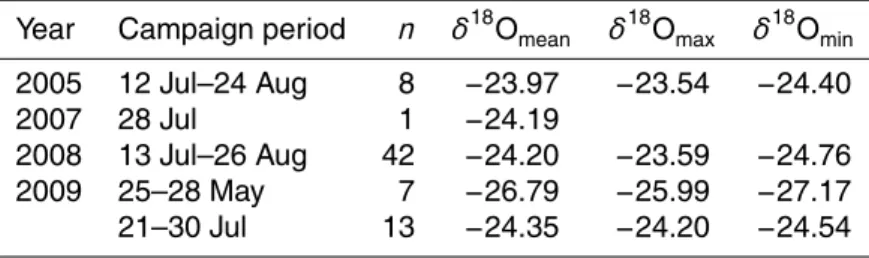
Sampling at Watson River was conducted in May, July and August in the years 2005, 2007 (a single sample), 2008 and 2009 (Table 3). In the peak flow period (e.g. July– August), the interannual meanδ18O was−24.17±0.20 ‰. The peak flowδ18O deviated
25
HESSD
12, 5841–5893, 2015Spatiotemporal variability of oxygen isotope compositions
in Greenland
J. C. Yde et al.
Title Page
Abstract Introduction
Conclusions References
Tables Figures
◭ ◮
◭ ◮
Back Close
Full Screen / Esc
Printer-friendly Version
Interactive Discussion
Discussion
P
a
per
|
Discussion
P
a
per
|
Discussion
P
a
per
|
Discussion
P
a
per
|
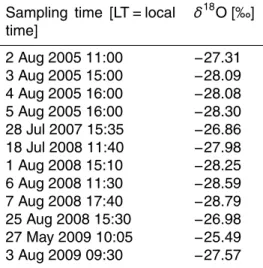
to have higherδ18O than ice melt, as indicated by the meanδ18O of−10.65±1.24 ‰ in 14 local lakes (Yde, unpublished data) andδ18O values ranging between−18.7 and −15.5 ‰ and −16 and −11 ‰ in ice-marginal snow samples collected at Paakitsup
Akuliarusersua (275 km to the north; Reeh and Thomsen, 1993) and at “N Glacier” (117 km to the north; Bhatia et al., 2011), respectively. A potential provenance for 5
meltwater with low δ18O is the marginal zone of the ice sheet, which consists of an exposed basal ice sequence and an outer 300–400 m band of dark Pleistocene ice (lo-cally referred to as velvet ice). The basal ice comprises various ice facies, which cover a wide range ofδ18O values between −32.7 and −24.6 ‰ (Knight, 1987, 1989; Yde
et al., 2010). Reeh et al. (2002) compiled an 880 m ice-surfaceδ18O record (2–10 m 10
sampling increments) from the ice sheet margin in the Watson River catchment. The record showed an outer band of Pleistocene ice with aδ18O of−33.0±0.5 ‰ followed
by an abrupt transition after 350 m to Holocene ice with aδ18O of−28.0±0.1 ‰ (Reeh et al., 2002). Theδ18O values of the Pleistocene ice in this record were consistent with a short ice-surface record sampled by Knight (1989), which showed theδ18O values 15
of Pleistocene ice ranging between−34.5 and−32.3 ‰. Based on the δ18O compo-sitions of these potential water sources and the fact that the catchment is located in a dry climate, where local summer precipitation is unlikely to contribute significantly to bulk runoff, we propose that river water in the early melt season derived from mixed proglacial snowmelt and ice-marginal ice melt. As the snowline rises towards the ELA, 20
theδ18O value in progressively exposed surface ice is expected to increase, while the δ18O value in snowmelt above the snowline progressively decreases (Reeh and Thom-sen, 1993). In combination, the altitudinal effect and a continental effect infer that as a precipitating cloud moves further inland on the GrIS, the δ18O value of precipitat-ing snow decreases (Dansgaard et al., 1973). The consequence of changprecipitat-ingδ18O in 25
HESSD
12, 5841–5893, 2015Spatiotemporal variability of oxygen isotope compositions
in Greenland
J. C. Yde et al.
Title Page
Abstract Introduction
Conclusions References
Tables Figures
◭ ◮
◭ ◮
Back Close
Full Screen / Esc
Printer-friendly Version
Interactive Discussion
Discussion
P
a
per
|
Discussion
P
a
per
|
Discussion
P
a
per
|
Discussion
P
a
per
Based on a strategy of two samples per day (morning and evening), there were no distinct diurnal oscillations inδ18O during the peak flow periods of 2008 and 2009 in Watson River. However, in July 1992 two diurnal time-series from the river in front of Russell Glacier (sampling site #4) and one diurnal time-series from the Qinnguata Ku-ussua tributary were obtained with a two-hour sampling frequency (Fig. 9). The 15/16 5
July 1992 time-series from Qinnguata Kuussua showed a diurnal signal inδ18O with an amplitude of 2.71 ‰. At the sub-catchment of Russell Glacier, a diurnalδ18O amplitude of 1.75 ‰ was observed on 30/31 July 1992, whereas no distinct signal was present on 22/23 July 1992. Also, Hindshaw et al. (2014) observed weak diurnal oscillations of 0.21±0.15 ‰ in the sub-catchment of Leverett Glacier (based on two samples per
10
day). It is likely that diurnal oscillations inδ18O exist periodically in sub-catchment wa-ters, but at the Watson River outlet mixing of water masses from sub-catchments with differences in transit time may obliterate the δ18O signal, or theδ18O signal may not have been captured by the time of sampling.
In the Watson River system the most useful application of stable water isotope anal-15
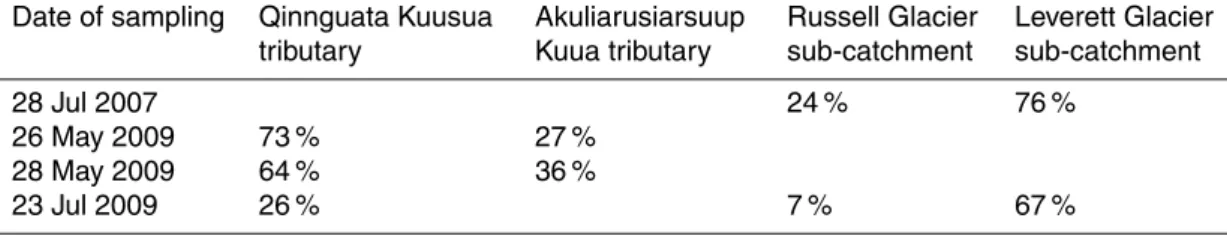
ysis is likely to estimate the relative contributions from major sub-catchments. On three days in 2009 δ18O samples were collected from Watson River and its two tributaries Akuliarusiarsuup Kuua (sampling site #7) and Qinnguata Kuussua (sampling site #8) all within a couple of hours of each other. Calculations of the relative contributions indi-cate that during the early melt season most of the water in Watson River (73 and 64 % 20
on 26 and 28 May 2009, respectively) derived from the Qinnguata Kuussua system, whereas during the peak flow period most water (74 % on 23 July 2009) derived from the Akuliarusiarsuup Kuua system (Table 4). It must be emphasized that these results are based on a few spot samples and are therefore unlikely to show the full story of the seasonal dynamics in the river system. However, the results indicate that large varia-25
HESSD
12, 5841–5893, 2015Spatiotemporal variability of oxygen isotope compositions
in Greenland
J. C. Yde et al.
Title Page
Abstract Introduction
Conclusions References
Tables Figures
◭ ◮
◭ ◮
Back Close
Full Screen / Esc
Printer-friendly Version
Interactive Discussion
Discussion
P
a
per
|
Discussion
P
a
per
|
Discussion
P
a
per
|
Discussion
P
a
per
|
hydro-meteorological or hydrological episodic events such as extreme ablation on the ice sheet and catastrophic drainage of ice-marginal lakes.
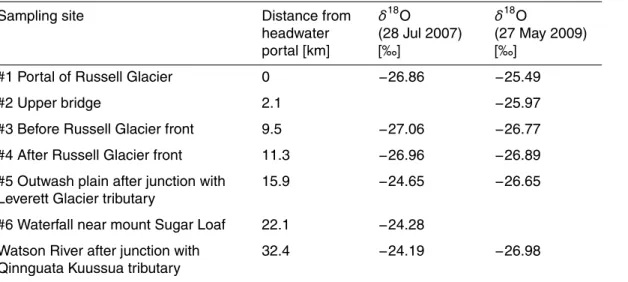
The Akuliarusiarsuup Kuua tributary system consists of two major sub-catchments: the Russell Glacier and Leverett Glacier sub-catchments. The headwaters of the Russell Glacier sub-catchment (sampling site #1) had δ18O values ranging between 5
−28.79 and −26.86 ‰ during the peak flow period (Table 5), indicating that the
domi-nating meltwater provenance was near-marginal melting of basal ice, Pleistocene ice and early Holocene ice (for details on this sampling site see Dieser et al., 2014). Two transects of the spatial variations inδ18O downstream along the river in Akuliarusiar-suup Kuua show that during the early melt season (27 May 2009) theδ18O values of 10
the Akuliarusiarsuup Kuua tributaries were similar to theδ18O value of Watson River after the junction with the Qinnguata Kuussua (Table 6). In contrast, there was a large discrepancy of 2.31 ‰ between the lowδ18O of the Russell Glacier tributary (sampling site #4) and the higherδ18O after the junction with the Leverett Glacier tributary (sam-pling site #5) in the peak flow transect (28 July 2007). Assuming that theδ18O value of 15
the Leverett Glacier tributary was similar to the meanδ18O of−23.90±0.16 ‰ (n=74) in July 2009 measured by Hindshaw et al. (2014), 76 % of the water in the Akuliarusiar-suup Kuua tributary derived from the Leverett Glacier sub-catchment on 28 July 2007 (Table 4). We can make a similar hydrograph separation for 23 July 2009 by using the morningδ18O of−23.85 ‰ from the Leverett Glacier sub-catchment (Hindshaw et al.,
20
2014), theδ18O of −24.18 ‰ from the Akuliarusiarsuup Kuua tributary (Table 4) and
assuming that theδ18O of the Russell Glacier sub-catchment was similar to measured δ18O of−27.19 ‰ on 4 August 2009. This calculation indicates that on 23 July 2009 the
Leverett Glacier sub-catchment contributed with 67 % of the total water in the Watson River, whereas the Russell Glacier sub-catchment contributed with 7 % and the Qin-25
HESSD
12, 5841–5893, 2015Spatiotemporal variability of oxygen isotope compositions
in Greenland
J. C. Yde et al.
Title Page
Abstract Introduction
Conclusions References
Tables Figures
◭ ◮
◭ ◮
Back Close
Full Screen / Esc
Printer-friendly Version
Interactive Discussion
Discussion
P
a
per
|
Discussion
P
a
per
|
Discussion
P
a
per
|
Discussion
P
a
per
The contribution from the proglacial area to Watson River is negligible compared to the contribution from bulk glacial meltwater. The largest input of non-glacial water comes from the lake Aajuitsup Tasia to the river in front of Russell Glacier (Fig. 2c). Although water from Aajuitsup Tasia had a highδ18O of −11.94 ‰ on 27 May 2009,
it did not cause any downstream changes in bulkδ18O of the meltwater sampled up-5
stream and downstream of the input source (Table 6). Also, field observations indicate that in recent years the discharge from Aajuitsup Tasia has ceased during the peak flow period.
4.4 Variability ofδ18O in glacier rivers
It is clear from the results above that glacier rivers in Greenland may have different 10
δ18O compositions. The bulk meltwater from Mittivakkat Gletscher has a δ18O com-position similar to the water draining the nearby local glacier Hobbs Gletscher and to waters from studied valley and outlet glaciers in Scandinavia, Svalbard, European Alps, Andes and Asia (Table 7). Meltwater in the early melt season is dominated by snowmelt with relatively highδ18O, whereas diurnal oscillations with an amplitude be-15
tween 0.11 and 0.49 ‰ exist during the peak flow period due to mixing of a domi-nant ice melt component and a secondary snowmelt component. Diurnal oscillations inδ18O are common in meltwater from small, glacierized catchments; for instance, at Austre Okstindbreen, Norway, the average diurnal amplitude is approximately 0.2 ‰ (Theakstone, 1988; Theakstone and Knudsen, 1989, 1996a, b; Theakstone, 2003). 20
However, at Glacier de Tsanfleuron, Switzerland, sampling in the later melt season (23–27 August 1994) showed no diurnal variations inδ18O, which was interpreted by Fairchild et al. (1994) as a consequence of limited altitudinal range (less than 500 m) of the glacier. An alternative explanation may be that snowmelt only constituted so small a proportion of the meltwater in the late melt season that backscattering rendered water 25
source discrimination impossible.
HESSD
12, 5841–5893, 2015Spatiotemporal variability of oxygen isotope compositions
in Greenland
J. C. Yde et al.
Title Page
Abstract Introduction
Conclusions References
Tables Figures
◭ ◮
◭ ◮
Back Close
Full Screen / Esc
Printer-friendly Version
Interactive Discussion
Discussion
P
a
per
|
Discussion
P
a
per
|
Discussion
P
a
per
|
Discussion
P
a
per
|
results from 2005 indicate a progressive trend from isotopic homogeneous conditions in the emanating bulk meltwater towards the development of diurnalδ18O oscillations. This is likely a consequence of stabilization of both the structure of the subglacial drainage system and a more permanent supraglacial routing of meltwater as the glacier surface changes from chaotically crevassed to a smooth surface (Yde and Knudsen, 5
2005a). The observed interannual variability at Kuannersuit Glacier River was larger than at the two other study sites, showing an interannual meanδ18O of−19.58±0.55 ‰
during the peak flow period. This may be explained by annual differences in the propor-tion of snowmelt. The large variability inδ18O values in the transverse profile across the glacier tongue is another observation that requires more attention. The preliminary in-10
terpretation is that it is due to ice movement from different up-glacier reservoirs, but it is unknown whether this is a common phenomenon on large glacier with lateral tributary glaciers. At present, there are no similar stable water isotope studies of surge-type or large outlet glaciers. However, theδ18O composition of Kuannersuit Glacier is similar to theδ18O composition of the glacier Killersuaq, an outlet glacier from the ice cap Amit-15
sulooq, which is located c. 100 km south of Watson River (Table 7). Here, Andreasen (1984) found that diurnal oscillations inδ18O were prominent during the relatively warm summer of 1982, whereas no diurnalδ18O oscillations were observed in 1983 because the glacier was entirely snow-covered throughout the ablation season, due to low sum-mer surface mass balance caused by the 1982 El Chichón eruption (Ahlstrøm et al., 20
2007).
From the margin of the GrIS in West Greenland, we now have several studies on δ18O dynamics in river water (Reeh and Thomsen, 1986, 1993; Yde and Knudsen, 2004; Bhatia et al., 2011; Hindshaw et al., 2014). In general, theδ18O composition in bulk meltwaters from the ice sheet is much lower than in meltwaters draining glaciers 25
HESSD
12, 5841–5893, 2015Spatiotemporal variability of oxygen isotope compositions
in Greenland
J. C. Yde et al.
Title Page
Abstract Introduction
Conclusions References
Tables Figures
◭ ◮
◭ ◮
Back Close
Full Screen / Esc
Printer-friendly Version
Interactive Discussion
Discussion
P
a
per
|
Discussion
P
a
per
|
Discussion
P
a
per
|
Discussion
P
a
per
temporal variations inδ18O during the peak flow period are small and may be linked to episodic events, such as jökulhlaups or extreme ablation, or to long-term trends related to altitudinal increase of the snowline (Reeh and Thomsen, 1993).
5 Conclusions
In this study, we have examined the oxygen isotope hydrology in three of the most 5
studied glacierized river catchments in Greenland to improve our understanding of the prevailing differences between contrasting glacial environments.
Diurnal oscillations in δ18O were most conspicuous at the small-scale Mittivakkat Gletscher River catchment. This was due to the presence of an efficient subglacial drainage system and diurnal variation in the ablation rates of snow and ice that had 10
distinguishable oxygen isotope compositions. Diversions from the prevailing diurnal pattern occurred due to episodic inputs of rainwater or minor changes within the sub-glacial drainage system, which caused storage and release of a specific water source component that may control the variability of the δ18O composition for some days. A hydrograph separation revealed that diurnal oscillations inδ18O lagged the diurnal 15
oscillations in runoffby approximately three hours.
In contrast to the observations at Mittivakkat Gletscher River, no diurnal oscillations inδ18O were observed at the medium-scale Kuannersuit Glacier River catchment in the years following a major glacier surge event. The most likely reason for this lack of diurnal oscillations was that meltwater was routed through a tortuous subglacial conduit 20
network of linked cavities that was exposed to frequent damming by roof collapse. Five to six years after the surge event the subglacial drainage system had evolved into a more channelized system and stabilized enough to provide a weak isotopic signal of diurnal-scale changes in the proportional contributions between two components; most likely between a background signal from snowmelt on the upper part of the glacier 25
HESSD
12, 5841–5893, 2015Spatiotemporal variability of oxygen isotope compositions
in Greenland
J. C. Yde et al.
Title Page
Abstract Introduction
Conclusions References
Tables Figures
◭ ◮
◭ ◮
Back Close
Full Screen / Esc
Printer-friendly Version
Interactive Discussion
Discussion
P
a
per
|
Discussion
P
a
per
|
Discussion
P
a
per
|
Discussion
P
a
per
|
tongue caused diurnal oscillations in runoff, solute export, and suspended sediment concentrations, but not inδ18O.
At the large-scale Watson River catchment, which drains a sector of the GrIS, diurnal oscillations in δ18O appeared in sub-catchment waters, however, a higher sampling frequency (>twice per day) and additional sampling sites are required to determine 5
whether diurnal oscillations are obliterated after mixing of tributary river water.
On seasonal scale, snowmelt dominated in the early melt season at Mittivakkat Gletscher River, but as the snowline increased in altitude ice melt subsequently be-came the dominant water source. At Watson River, the climate is dry and meltwater in the early melt season primarily derived from melting of near-marginal basal ice, Pleis-10
tocene ice and early Holocene ice with relatively lowδ18O values. During the peak flow period, ice melt dominated at all three locations.
Spatial variability inδ18O was observed along a proglacial river transect in the Wat-son River system. Hydrograph separation based on spot sampling on 23 July 2009 indicated that on this particular date approximately two-thirds of the water in Watson 15
River derived from the Leverett sub-catchment of the Akuliarusiarsuup Kuua tributary and one-fourth from the Qinnguata Kuussua tributary. This is contrast to spot sam-pling in the early melt season, which indicates that the majority of water derives from Qinnguata Kuussua tributary, and encourages further research on the water flow dy-namics of the river system. This study also revealed a systematic variability in δ18O 20
along a transverse transect on the tongue of Kuannersuit Glacier that calls for more attention.
This study has showed that environmental and physical contrasts in glacier river catchments influence the spatio-temporal variability of theδ18O compositions. In GrIS waters (between−29.9 and −23.2 ‰) and water from large Greenland ice caps
(be-25
tween −23.0 and −17.8 ‰), the δ18O compositions differ markedly from the δ18O
compositions in water draining small local glaciers in Greenland (between−17.4 and
HESSD
12, 5841–5893, 2015Spatiotemporal variability of oxygen isotope compositions
in Greenland
J. C. Yde et al.
Title Page
Abstract Introduction
Conclusions References
Tables Figures
◭ ◮
◭ ◮
Back Close
Full Screen / Esc
Printer-friendly Version
Interactive Discussion
Discussion
P
a
per
|
Discussion
P
a
per
|
Discussion
P
a
per
|
Discussion
P
a
per
The results of this study reinforce that analysis of stable water isotopes is a useful tool to discriminate between temporal variations in meltwater production from snowmelt and ice melt in glacier river water emanating from small glaciers. It is therefore likely that snowmelt and ice melt estimates based on isotope hydrology have the potential to validate modelled snowmelt and ice melt estimates. However, this study finds that 5
for large catchments along the margin of the GrIS it is more useful to applyδ18O to estimate the proportional contributions from sub-catchments, which may be linked to large-scale runoffand mass balance modelling.
Acknowledgements. We thank all the students who have participated in the fieldwork over the years. We are also grateful to the University of Copenhagen for allowing us use the
facili-10
ties at the Arctic Station and Sermilik Station, to Kangerlussuaq International Science Support (KISS) for providing logistic support and to the Niels Bohr Institute, University of Copenhagen, and the Alfred Wegener Institute for Polar and Marine Research, Bremerhaven, for processing the isotope samples. Fieldwork in 1992 (AJR) was funded by The Royal Geographical Soci-ety, The Royal Scottish Geographical SociSoci-ety, Gino Watkins memorial Fund and the Gilchrist
15
Educational Trust. We thank Andreas Peter Bech Mikkelsen for valuable comments on the manuscript.
References
Ahlstrøm, A. P., Bøggild, C. E., Olesen, O. B., Petersen, D., and Mohr, J. J.: Mass balance of the Amitsulôq ice cap, West Greenland, IAHS-AISH P., 318, 107–115, 2007.
20
Andreasen, J.-O.: Ilt-isotop undersøgelse ved Kidtlessuaq, Vestgrønland, PhD dissertation, Uni-versity of Aarhus, Aarhus, p. 33, 1984.
Bárcena, T. G., Yde, J. C., and Finster, K. W.: Methane flux and high-affinity methanotrophic diversity along the chronosequence of a receding glacier in Greenland, Ann. Glaciol., 51, 23–31, 2010.
25
HESSD
12, 5841–5893, 2015Spatiotemporal variability of oxygen isotope compositions
in Greenland
J. C. Yde et al.
Title Page
Abstract Introduction
Conclusions References
Tables Figures
◭ ◮
◭ ◮
Back Close
Full Screen / Esc
Printer-friendly Version
Interactive Discussion
Discussion
P
a
per
|
Discussion
P
a
per
|
Discussion
P
a
per
|
Discussion
P
a
per
|
Bartholomew, I., Nienow, P., Mair, D., Hubbard, A., King, M. A., and Sole, A.: Seasonal evolution of subglacial drainage and acceleration in a Greenland outlet glacier, Nat. Geosci., 3, 408– 411, 2010.
Behrens, H., Bergmann, H., Moser, H., Rauert, W., Stichler, W., Ambach, W., Eisner, H., and Pessl, K.: Study of the discharge of Alpine glaciers by means of environmental isotpes and
5
dye tracers, Z. Gletscherk. Glazialgeol., 7, 79–102, 1971.
Behrens, H., Moser, H., Oerter, H., Rauert, W., and Stichler, W.: Models for the runofffrom a glaciated catchment area using measurements of environmental isotope contents, in: Pro-ceedings of the International Symposium on Isotope Hydrology, International Atomic Energy Agency, Vienna, 829–846, 1978.
10
Bellas, C. M., Anesio, A. M., Telling, J., Stibal, M., Tranter, M., and Davis, S.: Viral impacts on bacterial communities in Arctic cryoconite, Environ. Res. Lett., 8, 045021, doi:10.1088/1748-9326/8/4/045021, 2013.
Bhatia, M. P., Das, S. B., Kujawinski, E. B., Henderson, P., Burke, A., and Charette, M. A.: Sea-sonal evolution of water contributions to discharge from a Greenland outlet glacier: insight
15
from a new isotope-mixing model, J. Glaciol., 57, 929–941, 2011.
Blaen, P. J., Hannah, D. M., Brown, L. E., and Milner, A. M.: Water source dynamics of high Arctic river basins, Hydrol. Process., 28, 3521–3538, 2014.
Bøggild, C. E., Brandt, R. E., Brown, K. J., and Warren, S. G.: The ablation zone in Northeast Greenland: ice types, albedos and impurities, J. Glaciol., 56, 101–113, 2010.
20
Box, J. E., Fettweis, X., Stroeve, J. C., Tedesco, M., Hall, D. K., and Steffen, K.: Greenland ice sheet albedo feedback: thermodynamics and atmospheric drivers, The Cryosphere, 6, 821–839, doi:10.5194/tc-6-821-2012, 2012.
Boye, B.: En undersøgelse af variationer i δ18O-indholdet i prøver indsamlet på Mittivakkat gletscheren i Østgrønland, Ms thesis, Aarhus University, Aarhus, p. 101, 1999.
25
Cappelen, J.: Weather observations from Greenland 1958–2012, Danish Meteorological Insti-tute Technical Report 13-11, Danish Meteorological InstiInsti-tute, Copenhagen, p. 23, 2013. Carrivick, J. L., Turner, A. G. D., Russell, A. J., Ingeman-Nielsen, T., and Yde, J. C.: Outburst
flood evolution at Russell Glacier, western Greenland: effects of a bedrock channel cascade
with intermediary lakes, Quaternary Sci. Rev., 67, 39–58, 2013.
30
Česnulevičius, A.,Šeiren ˙e, V., Kazakauskas, V., Baltr ¯unas, V.,Šink ¯unas, P., and Karmaza, B.:
HESSD
12, 5841–5893, 2015Spatiotemporal variability of oxygen isotope compositions
in Greenland
J. C. Yde et al.
Title Page
Abstract Introduction
Conclusions References
Tables Figures
◭ ◮
◭ ◮
Back Close
Full Screen / Esc
Printer-friendly Version
Interactive Discussion
Discussion
P
a
per
|
Discussion
P
a
per
|
Discussion
P
a
per
|
Discussion
P
a
per
Chandler, D. M., Wadham, J. L., Lis, G. P., Cowton, T., Sole, A., Bartholomew, I., Telling, J., Nienow, P., Bagshaw, E. B., Mair, D., Vinen, S., and Hubbard, A.: Evolution of the subglacial drainage system beneath the Greenland Ice Sheet revealed by tracers, Nat. Geosci., 6, 195– 198, 2013.
Christiansen, H. H., Etzelmüller, B., Isaksen, K., Juliussen, H., Farbrot, H., Humlum, O.,
Jo-5
hansson, M., Ingeman-Nielsen, T., Kristensen, L., Hjort, J., Holmlund, P., Sannel, A. B. K., Sigsgaard, C., Åkerman, H. J., Foged, N., Blikra, L. H., Pernosky, M. A., and Ødegård, R. S.: The thermal state of permafrost in the Nordic area during the International Polar Year 2007– 2009, Permafrost Periglac., 21, 156–181, 2010.
Clason, C. C., Mair, D. W. F., Nienow, P. W., Bartholomew, I. D., Sole, A., Palmer, S., and
10
Schwanghart, W.: Modelling the transfer of supraglacial meltwater to the bed of Leverett Glacier, Southwest Greenland, The Cryosphere, 9, 123–138, doi:10.5194/tc-9-123-2015, 2015.
Cook, J. M., Hodson, A. J., Anesio, A. M., Hanna, E., Yallop, M., Stibal, M., Telling, J., and Huy-brechts, P.: An improved estimate of microbially mediated carbon fluxes from the Greenland
15
ice sheet, J. Glaciol., 58, 1098–1108, 2012.
Coplen, T. B.: New guidelines for reporting stable hydrogen, carbon, and oxygen isotope-ratio data, Geochim. Cosmochim. Acta, 60, 3359–3360, 1996.
Cowton, T., Nienow, P., Bartholomew, I., Sole, A., and Mair, D.: Rapid erosion beneath the Greenland ice sheet, Geology, 40, 343–346, 2012.
20
Craig, H.: Isotopic variations in meteoric waters, Science, 133, 1702–1703, 1961.
Dahlke, H. E., Lyom, S. W., Jansson, P., Karlin, T., and Rosquist, G.: Isotopic investigation of runoffgeneration in a glacierized catchment in northern Sweden, Hydrol. Process., 28,
1383–1398, 2014.
Dansgaard, W.: Stable isotopes in precipitation, Tellus, 16, 436–468, 1964.
25
Dansgaard, W., Johnsen, S. J., Clausen, H. B., and Gundestrup, N.: Stable isotope glaciology, Meddelelser om Grønland, 197, 1–53, 1973.
Dieser, M., Broemsen, E. L. J. E., Cameron, K. A., King, G. M., Achberger, A., Choquette, K., Hagedorn, B., Sletten, R., Junge, K., and Christner, B. C.: Molecular and biogeochemical ev-idence for methane cycling beneath the western margin of the Greenland Ice Sheet, ISME J.,
30
8, 2305–2316, 2014.