BGD
9, 12019–12046, 2012
Oxygen isotope ratios in the shell of
Mytilus edulis E. A. A. Versteegh et al.
Title Page
Abstract Introduction
Conclusions References
Tables Figures
◭ ◮
◭ ◮
Back Close
Full Screen / Esc
Printer-friendly Version
Interactive Discussion
Discussion
P
a
per
|
Dis
cussion
P
a
per
|
Discussion
P
a
per
|
Discussio
n
P
a
per
|
Biogeosciences Discuss., 9, 12019–12046, 2012 www.biogeosciences-discuss.net/9/12019/2012/ doi:10.5194/bgd-9-12019-2012
© Author(s) 2012. CC Attribution 3.0 License.
Biogeosciences Discussions
This discussion paper is/has been under review for the journal Biogeosciences (BG). Please refer to the corresponding final paper in BG if available.
Oxygen isotope ratios in the shell of
Mytilus edulis
: archives of glacier
meltwater in Greenland?
E. A. A. Versteegh1, M. E. Blicher2, J. Mortensen2, S. Rysgaard2,3, T. D. Als4, and A. D. Wanamaker Jr.5
1
Department of Geography and Environmental Science, University of Reading, Reading, UK
2
Greenland Climate Research Centre, Greenland Institute of Natural Resources, Nuuk, Greenland
3
Centre for Earth Observation Science, University of Manitoba, Winnipeg, Manitoba, Canada
4
National Institute of Aquatic Resources, Technical University of Denmark, Silkeborg, Denmark
5
Department of Geological and Atmospheric Sciences, Iowa State University, Ames IA, USA Received: 15 August 2012 – Accepted: 16 August 2012 – Published: 5 September 2012 Correspondence to: E. Versteegh (e.a.versteegh@reading.ac.uk)
BGD
9, 12019–12046, 2012
Oxygen isotope ratios in the shell of
Mytilus edulis E. A. A. Versteegh et al.
Title Page
Abstract Introduction
Conclusions References
Tables Figures
◭ ◮
◭ ◮
Back Close
Full Screen / Esc
Printer-friendly Version
Interactive Discussion
P
a
per
|
Dis
cussion
P
a
per
|
Discussion
P
a
per
|
Discussio
n
P
a
per
|
Abstract
Melting of the Greenland Ice Sheet (GrIS) is accelerating and will contribute signifi-cantly to global sea level rise during the 21st century. Instrumental data on GrIS melt-ing only cover the last few decades, and proxy data extendmelt-ing our knowledge into the past are vital for validating models predicting the influence of ongoing climate
5
change. We investigated a potential meltwater proxy in Godth ˚absfjord (West Green-land), where glacier meltwater causes seasonal excursions with lower oxygen isotope water (δ18Ow) values and salinity. The blue mussel (Mytilus edulis) potentially records these variations, because it precipitates its shell calcite in oxygen isotopic equilibrium with ambient seawater. As M. edulis shells are known to occur in raised shorelines
10
and kitchen middens from previous Holocene warm periods, this species may be ideal in reconstructing past meltwater dynamics. We investigate its potential as a palaeo-meltwater proxy. First, we confirmed thatM. edulisshell calcite oxygen isotope (δ18Oc) values are in equilibrium with ambient water and generally reflect meltwater conditions. Subsequently we investigated if this species recorded the full range ofδ18Ow values
15
occurring during the years 2007 to 2010. Results show thatδ18Ow values were not recorded at very low salinities (<∼19), because the mussels appear to cease growing. This implies that M. edulis δ18Oc values are suitable in reconstructing past meltwa-ter amounts in most cases, but care has to be taken that shells are collected not too close to a glacier, but rather in the mid region or mouth of the fjord. The focus of future
20
BGD
9, 12019–12046, 2012
Oxygen isotope ratios in the shell of
Mytilus edulis E. A. A. Versteegh et al.
Title Page
Abstract Introduction
Conclusions References
Tables Figures
◭ ◮
◭ ◮
Back Close
Full Screen / Esc
Printer-friendly Version
Interactive Discussion
Discussion
P
a
per
|
Dis
cussion
P
a
per
|
Discussion
P
a
per
|
Discussio
n
P
a
per
|
1 Introduction
Many biomineralising organisms faithfully record environmental variability in the chem-istry of growth increments in their skeletons, e.g. corals (Watanabe et al., 2011; Swart, 1983), coralline algae (Williams et al., 2011; Halfar et al., 2008), land snails (Yanes et al., 2011; Goodfriend and Ellis, 2002), freshwater snails (Stevens et al., 2012; Abell
5
and Hoelzmann, 2000), freshwater bivalves (Versteegh et al., 2011, 2010b; Kaandorp et al., 2003) and marine bivalves (Santos et al., 2012; Jones and Quitmyer, 1996; Sch ¨one et al., 2005). The oxygen isotope composition (δ18O values) of marine bivalves is often used as a proxy for temperature (Wanamaker Jr. et al., 2011; Carr ´e et al., 2005). It can, however, also be applied to reconstructδ18Owvalues (Freitas et al., 2012; Khim,
10
2002), which usually directly relate with salinity (Ingram et al., 1996).
The marine bivalveMytilus edulis(blue mussel) produces prominent annual growth increments (Richardson et al., 1990) and precipitates its shell in oxygen isotopic equi-librium with the environment (Wanamaker et al., 2006, 2007). In combination with its wide geographic distribution, this makes the species highly suitable for reconstructing
15
pre-instrumental temperatures or salinities. These applications, however, have so far been limited. Donner and Nord (1986) showed thatM. edulisδ18Ocvalues reflect wa-ter composition, and can be used to estimate past temperatures. Ingram et al. (1996) demonstrated that the amount of freshwater discharge into San Francisco Bay is accu-rately reflected in shellδ18Oc values, and thatM. edulis shells can be used to
recon-20
struct pre-instrumental freshwater fluxes. Here we investigate the potential of δ18Oc records ofM. edulis in the reconstruction of past glacier meltwater fluxes in a Green-land fjord.
The GrIS is the world second largest ice mass. Current global warming causes accel-erated melting (Rignot and Kanagaratnam, 2006; Howat et al., 2005; Andresen et al.,
25
BGD
9, 12019–12046, 2012
Oxygen isotope ratios in the shell of
Mytilus edulis E. A. A. Versteegh et al.
Title Page
Abstract Introduction
Conclusions References
Tables Figures
◭ ◮
◭ ◮
Back Close
Full Screen / Esc
Printer-friendly Version
Interactive Discussion
P
a
per
|
Dis
cussion
P
a
per
|
Discussion
P
a
per
|
Discussio
n
P
a
per
|
is reconstructed by means of modelling studies, using instrumental data (covering the most recent decades) and proxy data (Alley et al., 2010; Israelson et al., 1994). Un-certainties in model projections are still considerable (Applegate et al., 2012; IPCC, 2007). In order to reduce these uncertainties and validate models, it is vital to col-lect proxy data on past ice sheet behaviour, such as surface mass balance and runoff
5
(Hanna et al., 2011; Applegate et al., 2012; Alley et al., 2010).
M. edulisshellδ18Ocvalues may provide additional information regarding past melt-water conditions in Greenland. Although M. edulis is common in West and South Greenland, it is currently absent north of Central East Greenland. Subfossil shells, however, can be found in kitchen middens of prehistoric people, and raised
palaeo-10
shorelines dating to 5500–8000 before present (BP) (McGovern et al., 1996; Hjort and Funder, 1974). As such there is a rich supply of shells from previous Holocene warm periods, potentially giving insight in GrIS dynamics during those time intervals.
We aim to establish if the shellδ18Occomposition ofM. eduliscan be used as a proxy for ambientδ18Ow values, reflecting the amount of meltwater, in Godth ˚absfjord, West
15
Greenland. We pose the following research questions:
1. Does the mixing of seawater and meltwater in the fjord yield a linear relationship between salinity andδ18Ow?
2. Do seasonal δ18Oc records accurately reflect the full seasonalδ18Ow cycle, in-cludingδ18Owexcursions that are coincident with glacier meltwater input?
20
2 Material and methods
2.1 Study area
The Godth ˚absfjord is situated in the sub-Arctic SW Greenland (64◦N, 51◦W; Fig. 1). The fjord system is made up of a number of fjord branches. Tidal range varies from 1 to 5 m (Richter et al., 2011). The inner part of the main fjord is in contact with three tidal
BGD
9, 12019–12046, 2012
Oxygen isotope ratios in the shell of
Mytilus edulis E. A. A. Versteegh et al.
Title Page
Abstract Introduction
Conclusions References
Tables Figures
◭ ◮
◭ ◮
Back Close
Full Screen / Esc
Printer-friendly Version
Interactive Discussion
Discussion
P
a
per
|
Dis
cussion
P
a
per
|
Discussion
P
a
per
|
Discussio
n
P
a
per
|
outlet glaciers. The distance from the mouth to the head of the fjord is 187 km. A general description of bathymetry and water masses in the fjord is provided by Mortensen et al. (2011).
2.2 Shell collection and water monitoring
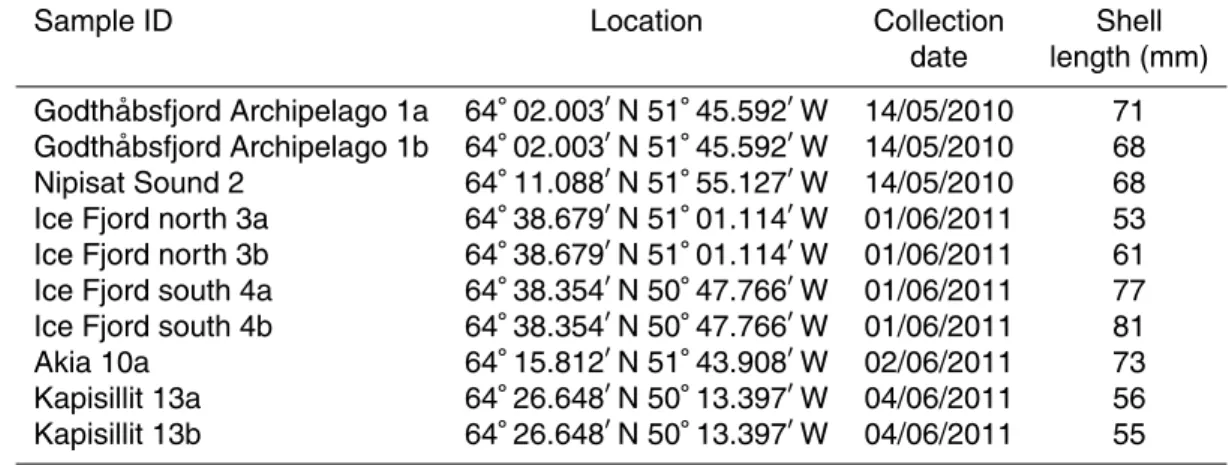
In May 2010 and June 2011, 10M. edulisspecimens were collected in the low intertidal
5
on rocky shores along a transect from the glacier to the mouth of Godth ˚absfjord. They were all adults and varied between 55 and 81 mm in length (Fig. 1, Table 1). Soft tissue was removed and the rinsed shells were dried at 50◦C for 24 h.
At time intervals of 2 to 4 weeks, water samples were collected for δ18O analyses at 1 m depth. Water temperature and salinity were measured using a Sea-Bird
Elec-10
tronics SBE19plus SEACAT Profiler CTD (conductivity, temperature and depth). The SBE19plus were calibrated by the manufacturer every 1–2 yr and uncertainties of the salinities after calibration were typically within the range 0.005–0.010. Temperature un-certainties were near to the initial accuracy of the instrument of 0.005◦C. At location GF3 monitoring started on 5 October 2005; at locations GF10 and GF5 measurements
15
started on 9 January 2009 and 16 May 2009, respectively (Fig. 1). Forδ18O analysis, 2 ml water samples from each station were collected in gas-tight vials and analysed for
δ18O values on a Picarro Isotopic Water Analyzer, L2120-I (Picarro, Sunnyvale, CA, USA). Water samples were introduced into the vaporization chamber using an attached PAL autosampler (Leap Technologies, Carrboro, NC, USA). Each sample was analysed
20
three times (three consecutive replicate injections;σ=0.005–0.007 ‰) alongside a set of three laboratory reference materials, which had previously been calibrated to the VS-MOW scale (Coplen, 1994).
2.3 Genetic identification
In the North Atlantic two species of Mytilus can be found: M. edulis and M.
trossu-25
BGD
9, 12019–12046, 2012
Oxygen isotope ratios in the shell of
Mytilus edulis E. A. A. Versteegh et al.
Title Page
Abstract Introduction
Conclusions References
Tables Figures
◭ ◮
◭ ◮
Back Close
Full Screen / Esc
Printer-friendly Version
Interactive Discussion
P
a
per
|
Dis
cussion
P
a
per
|
Discussion
P
a
per
|
Discussio
n
P
a
per
|
interbreeding (Riginos and Cunningham, 2005). Since these species cannot be dis-tinguished solely on morphological grounds, DNA fingerprinting was performed using four PCR-based nuclear markers (two RFLP markers) to determine the species of the shells collected. These markers are diagnostic forM. edulis , M. trossulus, andM. gal-loprovincialis.Prior to DNA extraction, shells were washed in sterile deionised water
5
and dried at 100◦C in an incubator for 4 h (Doherty et al., 2007). DNA was extracted using the E.Z.N.A. kit (Omega Biotek, Norcross, GA, USA) following the manufacturer’s protocol except for increased digestion time from 5 to 30 h (Doherty et al., 2007). The protocol for the two RFLP markers, Mal-1 treated with restriction enzymeSpeIand ITS followed by restriction withHhaI, is outlined in Rawson et al. (2001) and Heath et al.
10
(1995), respectively. The applications of Glu-5 and Me 15/16 markers are outlined in Rawson et al. (1996a) and Inoue et al. (1995), respectively (Table 2). For three of the PCR-based markers products were visualized on 2 % agarose gels, while Me15/16 was analysed using an automated sequencer (ABI 3130 Genetic Analyser; Applied Biosys-tems, Foster City, CA, USA) due to relatively small differences in allele sizes (Inoue
15
et al., 1995; Kijewski et al., 2009). For all four markers it was consistently confirmed, that all 10 samples belong toM. edulis.
2.4 Shell sampling andδ18Ocanalyses
One valve of each shell was embedded in epoxy resin and a slab of∼2 mm thickness was cut along the longest growth axis. Powder samples forδ18Ocanalysis were drilled
20
from the calcite outer layer, parallel to the internal growth lines, using a New Wave Micromill.. Drill bit diameter was 80 µm; sampling resolution varied between 250 and 1000 µm, and drilling depth was∼500 µm.
Samples were measured via a Finnigan MAT Delta Plus XL mass spectrometer in continuous flow mode connected to a GasBench with a CombiPAL autosampler at
25
BGD
9, 12019–12046, 2012
Oxygen isotope ratios in the shell of
Mytilus edulis E. A. A. Versteegh et al.
Title Page
Abstract Introduction
Conclusions References
Tables Figures
◭ ◮
◭ ◮
Back Close
Full Screen / Esc
Printer-friendly Version
Interactive Discussion
Discussion
P
a
per
|
Dis
cussion
P
a
per
|
Discussion
P
a
per
|
Discussio
n
P
a
per
|
used for every five samples. The average combined uncertainty (analytical uncertainty and average correction factor) forδ18O was±0.12 ‰ (VPDB).
2.5 Calculation of predictedδ18Ocvalues
Many bivalve species precipitate their shells in oxygen isotopic equilibrium with the am-bient water (Hickson et al., 1999; Freitas et al., 2012; Chauvaud et al., 2005), following
5
the equation for inorganic calcite (Kim and O’Neil, 1997):
1000 lnα(calcite−water)=18.03103T−1−32.42 (1)
ForM. edulis, a species-specific equation has been established, which is not signifi-cantly different from the above equilibrium equation (Wanamaker et al., 2007):
1000 lnα(calcite−water)=18.02103T−1−31.84 (2)
10
In both equationsT is the temperature in K andα is the isotope fractionation factor:
αc−w=
1000+δ18Oc(VSMOW)
1000+δ18O
w(VSMOW)
(3)
For calculation of predictedδ18Oc(δ18Opred) values we use the species specific Eq. (2).
2.6 Alignment ofδ18O
predandδ18Ocvalues
In order to align measuredδ18Oc values with δ18Opred values, seasonal shell δ18Oc
15
BGD
9, 12019–12046, 2012
Oxygen isotope ratios in the shell of
Mytilus edulis E. A. A. Versteegh et al.
Title Page
Abstract Introduction
Conclusions References
Tables Figures
◭ ◮
◭ ◮
Back Close
Full Screen / Esc
Printer-friendly Version
Interactive Discussion
P
a
per
|
Dis
cussion
P
a
per
|
Discussion
P
a
per
|
Discussio
n
P
a
per
|
δ18Ocrecords were first aligned, and subsequently the points in between, using point-by-point time-axis shifting ofδ18Ocvalues towardsδ18Opredvalues (Freitas et al., 2006; Goewert et al., 2007; Versteegh et al., 2010a).
3 Results
3.1 Water data
5
Water temperature varied between minima of around−1◦C and maxima of 6 to 9◦C in all three locations. Salinity and δ18Ow values are close to those of full marine condi-tions (33.5 and−0.7 ‰, respectively) during the first half of the year (January–June), and show sharp excursions towards much lower values during the following months. Salinity minimum values vary between ∼19 at GF3 and GF5, down to 4.6 at GF10.
10
Minimumδ18Ow values show a similar behaviour with −9.1 and −9.8 ‰, for GF3 and GF5 respectively, and a very low−18.6 ‰ at GF10 (Fig. 2a–c).
3.2 Measuredδ18Ocvalues in shells
Microsampling of the 2 to 3 last growth increments, counted from the ventral margin, yielded between 14 and 40 samples per shell. Bulk shell composition is shown as the
15
range of data in a box whisker diagram (Fig. 3). Shellδ18Oc values vary between 3.7 and −8.0 ‰ (VPDB). In proximity of the glacier, seasonal δ18Oc minima are ∼9.0 ‰
lower than nearer the coast (−8.0 ‰ in Ice Fjord north 3a vs. 1.0 ‰ in Godth ˚absfjord Archipelago 1a); maximumδ18Ocvalues differ by only 2.9 ‰ (0.8 ‰ in Ice Fjord north 3a vs. 3.7 ‰ in Godth ˚absfjord Archipelago 1a; Fig. 3).
20
BGD
9, 12019–12046, 2012
Oxygen isotope ratios in the shell of
Mytilus edulis E. A. A. Versteegh et al.
Title Page
Abstract Introduction
Conclusions References
Tables Figures
◭ ◮
◭ ◮
Back Close
Full Screen / Esc
Printer-friendly Version
Interactive Discussion
Discussion
P
a
per
|
Dis
cussion
P
a
per
|
Discussion
P
a
per
|
Discussio
n
P
a
per
|
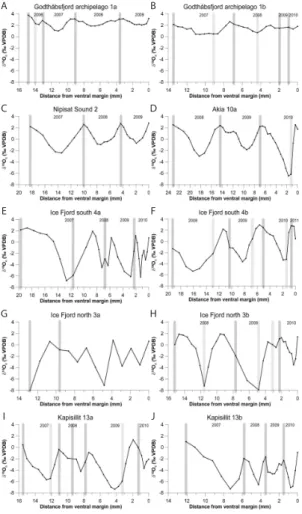
seasonally varying temperature andδ18Owvalues. Winters are represented by peaks inδ18Oc values, because of low temperatures and low meltwater input. Summers are troughs inδ18Oc values, because of higher temperatures and higher meltwater input (see also Discussion). Winter peaks are sharper than δ18Ow summer troughs, and are therefore likely truncated by seasonal growth cessation (Fig. 4a–j) (Goodwin et al.,
5
2003; Goewert et al., 2007).
Conspicuous dark lines (under reflected light) within the shells, correspond to a slow-ing down of growth prior to growth cessation, and roughly correspond to winter growth cessations in the δ18Oc records (Fig. 4a–j). The number of years counted by dark growth lines and the number of δ18Oc peaks are the same in all shells, except Ice
10
Fjord north 3a, which has insufficient resolution to discern annual cycles, and Kapisillit 13a, which appears to have one extra growth cessation during the summer of 2008 (Fig. 4g,i). Lighter growth lines than the annual ones can be seen in several specimens (Godth ˚absfjord Archipelago 1a and 1b, Ice Fjord south 4b, Ice Fjord north 3b, Kapisillit 13a; Fig. 4a, b, f, h and i). These lighter lines apparently correspond with troughs in
15
theδ18Ocrecords, and are probably caused by an additional cessation of growth dur-ing maximum meltwater input (see Discussion). Usdur-ing growth lines andδ18Oc values, calendar years can be assigned in all but one shell (Ice Fjord north 3a; Fig. 4g). This specimen is therefore excluded from subsequent analysis.
4 Discussion
20
4.1 Relationshipδ18O – salinity
Regression analysis yields a linear relationship betweenδ18Owand salinity, following:
δ18Ow=0.631·S−21.84 (4)
where S is salinity (R2=0.9778; p <0.0005; n=202). An ANOVA showed there is no significant difference in regression coefficient between locations (Fig. 5). From this
BGD
9, 12019–12046, 2012
Oxygen isotope ratios in the shell of
Mytilus edulis E. A. A. Versteegh et al.
Title Page
Abstract Introduction
Conclusions References
Tables Figures
◭ ◮
◭ ◮
Back Close
Full Screen / Esc
Printer-friendly Version
Interactive Discussion
P
a
per
|
Dis
cussion
P
a
per
|
Discussion
P
a
per
|
Discussio
n
P
a
per
|
relationship it follows that glacier meltwater has aδ18Ow value of−21.8 ‰ (VSMOW) and seawater has a salinity of∼33.5 and aδ18Owvalue of∼ −0.7 ‰ (VSMOW). From
the linear mixing of freshwater and seawater, it follows that there is a direct and simple relationship between glacier meltwater amounts and salinity (δ18Ow) at any point in the fjord.
5
4.2 Equilibrium precipitation of calcite
Although it is known from experiments thatM. edulisprecipitates its shell inδ18O equi-librium with the ambient water (Wanamaker et al., 2006, 2007), we aimed to confirm this for the specimens presented here in a field setting. A valid approach is to com-pare theδ18Ocvalue of the ventral margin withδ18Opredvalues calculated fromδ18Ow
10
and temperature on the date of shell collection (Versteegh et al., 2010a). Five shells were selected that were collected closest to the water monitoring locations.δ18Opred values were calculated using Eq. (2) andδ18Owvalues calculated from salinity (Eq. 5).
δ18Opredandδ18Ocvalues are presented in Table 3. There is a good correspondence betweenδ18Opred andδ18Oc values. They differ only by 0.1 to 0.3 ‰, with the
excep-15
tion of shell Ice Fjord north 3b, which differs by 0.7 ‰ from δ18Opred values. It is likely that this shell did not precipitate any calcite immediately before it was collected.
4.3 Predicted and measured shellδ18Oc
δ18Opred values were calculated using Eq. (2) and δ18Ow based on salinity (Eq. 4). The influence ofδ18Ow onδ18Opredis dominant over that of temperature, resulting in
20
δ18Opredcurves that are similar in shape toδ18Owcurves (Fig. 2a–c).
BGD
9, 12019–12046, 2012
Oxygen isotope ratios in the shell of
Mytilus edulis E. A. A. Versteegh et al.
Title Page
Abstract Introduction
Conclusions References
Tables Figures
◭ ◮
◭ ◮
Back Close
Full Screen / Esc
Printer-friendly Version
Interactive Discussion
Discussion
P
a
per
|
Dis
cussion
P
a
per
|
Discussion
P
a
per
|
Discussio
n
P
a
per
|
summer seasons, the shell δ18Oc records appear “dampened” and do not record low δ18Ow values (see further discussion below), suggesting and additional summer growth cessation. The δ18Opred and δ18Oc records were aligned by first matching peaks and troughs, and subsequent point-by-point time-axis shifting (Freitas et al., 2006; Goewert et al., 2007; Versteegh et al., 2010a).
5
At the locations GF3 and GF5δ18Opred and δ18Oc correspond well, with the shells faithfully recording almost the entire range ofδ18Opredvalues. In the shell Nipisat Sound 2 the meltwater peaks of 2007 and 2008 do not seem to be picked up entirely, probably due to time-averaging within one shell powder sample (Goodwin et al., 2003). The same is true for the very lowδ18Opred values at GF5 and in the shell Akia 10a during
10
2010.
This difference of up to 1.9 ‰ can alternatively be caused by a summer growth ces-sation, occurring when ambient water becomes too fresh for the mussel to thrive (Qiu et al., 2002). This certainly seems to be the case in the three shells collected near GF10. None of them recorded the very lowδ18Owduring 2010. Many shells also show
15
a faint dark line (slow growth prior to growth cessation) during periods of low δ18Oc values (Fig. 4a–j). It is known that marine bivalves, including M. edulis, have a re-duced size and growth rate in low-salinity conditions (Westerbom et al., 2002; Sch ¨one et al., 2003), and that salinities lower than 9.6 are lethal to the mussels within 10 days (Almada-Villela, 1984; Qiu et al., 2002). In response to a sudden drop in salinity,M.
20
eduliswithdraw their mantle and siphons, and close their shells (Qiu et al., 2002). It is likely that the mussels in Godth ˚absfjord show this behaviour when exposed to very low salinities and as such cease growing and fail to record large meltwater pulses.δ18Oc values suggest that the threshold salinity value for shell growth is at∼19. However, the abrupt decrease in salinity/δ18Owvalues at the beginning of the melt season,
com-25
BGD
9, 12019–12046, 2012
Oxygen isotope ratios in the shell of
Mytilus edulis E. A. A. Versteegh et al.
Title Page
Abstract Introduction
Conclusions References
Tables Figures
◭ ◮
◭ ◮
Back Close
Full Screen / Esc
Printer-friendly Version
Interactive Discussion
P
a
per
|
Dis
cussion
P
a
per
|
Discussion
P
a
per
|
Discussio
n
P
a
per
|
5 Conclusions
Observations on salinity andδ18Ow show that there is linear mixing of seawater and meltwater in Godth ˚absfjord, implying that the meltwater contributions andδ18Owvalues follow a simple and predictable relationship at any location in the fjord. This indicates that glacier meltwater is the absolutely dominant source of freshwater in the fjord
sys-5
tem.
Our results corroborate previous findings, thatM. edulis precipitates shell calcite in oxygen isotopic equilibrium with the ambient water, not only under controlled laboratory conditions (Wanamaker et al., 2006, 2007), but also under natural conditions. Oscillat-ingδ18Ow values in Godth ˚absfjord are faithfully recorded, at least at salinities∼>19,
10
below which shell growth apparently ceases.
Comparison of δ18Oc values and growth lines, visible in shell cross-section, show that conspicuous dark lines are winter growth cessations, whereas growth cessations caused by low salinities are visible as a thinner and lighter growth lines within annual bands.
15
We conclude that this species can be suitable for reconstructing past meltwater amounts in ice sheet influenced fjords, and may offer an opportunity to investigate GrIS melting during previous Holocene warm periods. Care has to be taken, however, that individuals are used that lived not too close to a glacier, but rather in the centre or mouth of a fjord, so the full amplitude of localδ18Owvariations is captured.
20
BGD
9, 12019–12046, 2012
Oxygen isotope ratios in the shell of
Mytilus edulis E. A. A. Versteegh et al.
Title Page
Abstract Introduction
Conclusions References
Tables Figures
◭ ◮
◭ ◮
Back Close
Full Screen / Esc
Printer-friendly Version
Interactive Discussion
Discussion
P
a
per
|
Dis
cussion
P
a
per
|
Discussion
P
a
per
|
Discussio
n
P
a
per
|
Acknowledgements. We would like to thank Suzanne Ankerstjerne (Iowa State University) and Yan Gao (University of Reading) for their help with carbonateδ18O analyses. We also thank Stuart Robinson and Dorinda Ostermann (University College London), and Hubert Vonhof and Suzan Warmerdam (VU University Amsterdam) for making available their Micromills. T. Juul-Pedersen, K. Arendt, T. Krogh, D. Søg ˚ard and W. Martinsen (Greenland Institute of Natural
5
Resources) are all thanked for their help with hydrographic measurements. The study was fi-nancially supported by the Greenland Climate Research Centre, the Danish Ministry of the En-vironment (Dancea), Aarhus University, the Commission for Scientific Research in Greenland, the Ministry of Education, Research and Nordic cooperation (IIN) and Aage V Jensen Charity Foundation, and is a part of the Greenland Ecosystem Monitoring program (www.g-e-m.dk).
10
References
Abell, P. I. and Hoelzmann, P.: Holocene palaeoclimates in Northwestern Sudan: stable isotope studies on molluscs, Global Planet. Change, 26, 1–12, 2000.
Alley, R. B., Andrews, J. T., Brigham-Grette, J., Clarke, G. K. C., Cuffey, K. M., Fitzpatrick, J. J., Funder, S., Marshall, S. J., Miller, G. H., Mitrovica, J. X., Muhs, D. R., Otto-Bliesner, B. L.,
15
Polyak, L., and White, J. W. C.: History of the Greenland Ice Sheet: paleoclimatic insights, Quatern. Sci. Rev., 29, 1728–1756, doi:10.1016/j.quascirev.2010.02.007, 2010.
Almada-Villela, P. C.: The effects of reduced salinity on the shell growth of smallMytilus Edulis, J. Mar. Biol. Assoc. UK, 64, 171–182, doi:10.1017/S0025315400059713, 1984.
Andresen, C. S., Straneo, F., Ribergaard, M. H., Bjork, A. A., Andersen, T. J., Kuijpers, A.,
20
Norgaard-Pedersen, N., Kjaer, K. H., Schjoth, F., Weckstrom, K., and Ahlstrom, A. P.: Rapid response of Helheim Glacier in Greenland to climate variability over the past century, Nature Geosci., 5, 37–41, 2012.
Applegate, P. J., Kirchner, N., Stone, E. J., Keller, K., and Greve, R.: An assessment of key model parametric uncertainties in projections of Greenland Ice Sheet behavior, The
25
Cryosphere, 6, 589–606, doi:10.5194/tc-6-589-2012, 2012.
Box, J. E., Bromwich, D. H., Veenhuis, B. A., Bai, L.-S., Stroeve, J. C., Rogers, J. C., Steffen, K., Haran, T., and Wang, S.-H.: Greenland Ice Sheet surface mass balance variability (1988– 2004) from calibrated polar MM5 output, J. Climate, 19, 2783–2800, doi:10.1175/jcli3738.1, 2006.
BGD
9, 12019–12046, 2012
Oxygen isotope ratios in the shell of
Mytilus edulis E. A. A. Versteegh et al.
Title Page
Abstract Introduction
Conclusions References
Tables Figures
◭ ◮
◭ ◮
Back Close
Full Screen / Esc
Printer-friendly Version
Interactive Discussion
P
a
per
|
Dis
cussion
P
a
per
|
Discussion
P
a
per
|
Discussio
n
P
a
per
|
Carr ´e, M., Bentaleb, I., Blamart, D., Ogle, N., Cardenas, F., Zevallos, S., Kalin, R. M., Or-tlieb, L., and Fontugne, M.: Stable isotopes and sclerochronology of the bivalveMesodesma donacium: potential application to Peruvian paleoceanographic reconstructions, Palaeo-geogr. Palaeoclimatol. Palaeoecol., 228, 4–25, 2005.
Chauvaud, L., Lorrain, A., Dunbar, R., Paulet, Y.-M., Thouzeau, G., Jean, F., Guarini, J.-M., and
5
Mucciarone, D.: The shell of the Great ScallopPecten maximusas a high-frequency archive of paleoenvironmental changes, Geochem. Geophy. Geosy., 6, 15, 2005.
Coplen, T. B.: Reporting of stable hydrogen, carbon, and oxygen isotopic abundances, Pure Appl. Chem., 88, 273–276, 1994.
Doherty, S., Gosling, E., and Was, A.: Bivalve ligament – a new source of DNA for historical
10
studies, Aquatic Biol., 1, 161–165, doi:10.3354/ab00020, 2007.
Donner, J., and Nord, A. G.: Carbon and oxygen stable isotope values in shells ofMytilus edulis
andModiolus modiolus from Holocene raised beaches at the outer coast of the Varanger Peninsula, North Norway, Palaeogeogr. Palaeoclimatol. Palaeoecol., 56, 35–50, 1986. Freitas, P. S., Clarke, L. J., Kennedy, H., Richardson, C. A., and Abrantes, F.: Environmental
15
and biological controls on elemental (Mg/Ca, Sr/Ca and Mn/Ca) ratios in shells of the king scallopPecten maximus, Geochim. Cosmochim. Acta, 70, 5119–5133, 2006.
Freitas, P. S., Clarke, L. J., Kennedy, H., and Richardson, C. A.: The potential of combined Mg/Ca and δ18O measurements within the shell of the bivalve Pecten
maximus to estimate seawater δ18O composition, Chem. Geol., 291, 286–293,
20
doi:10.1016/j.chemgeo.2011.10.023, 2012.
Goewert, A., Surge, D., Carpenter, S. J., and Downing, J.: Oxygen and carbon isotope ratios ofLampsilis cardium(Unionidae) from two streams in agricultural watersheds of Iowa, USA, Palaeogeogr. Palaeoclimatol. Palaeoecol., 252, 637–648, 2007.
Goodfriend, G. A., and Ellis, G. L.: Stable carbon and oxygen isotopic variations in modern Rab-25
dotusland snail shells in the southern Great Plains, USA, and their relation to environment, Geochim. Cosmochim. Acta, 66, 1987–2002, 2002.
Goodwin, D. H., Sch ¨one, B. R., and Dettman, D. L.: Resolution and fidelity of oxygen isotopes as paleotemperature proxies in bivalve mollusk shells: models and observations, Palaios, 18, 110–125, 2003.
30
BGD
9, 12019–12046, 2012
Oxygen isotope ratios in the shell of
Mytilus edulis E. A. A. Versteegh et al.
Title Page
Abstract Introduction
Conclusions References
Tables Figures
◭ ◮
◭ ◮
Back Close
Full Screen / Esc
Printer-friendly Version
Interactive Discussion
Discussion
P
a
per
|
Dis
cussion
P
a
per
|
Discussion
P
a
per
|
Discussio
n
P
a
per
|
Hanna, E., Huybrechts, P., Cappelen, J., Steffen, K., Bales, R. C., Burgess, E., McConnell, J. R., Peder Steffensen, J., Van den Broeke, M., Wake, L., Bigg, G., Griffiths, M., and Savas, D.: Greenland Ice Sheet surface mass balance 1870 to 2010 based on Twentieth Cen-tury Reanalysis, and links with global climate forcing, J. Geophys. Res., 116, D24121, doi:10.1029/2011jd016387, 2011.
5
Heath, D. D., Rawson, P. D., and Hilbish, T. J.: PCR-based nuclear markers identify alien blue mussel (Mytilusspp.) genotypes on the west coast of Canada, 12, National Research Council of Canada, Ottawa, ON, CANADA, 1995.
Hickson, J. A., Johnson, A. L. A., Heaton, T. H. E., and Balson, P. S.: The shell of the Queen Scallop Aequipecten opercularis (L.) as a promising tool for palaeoenvironmental
recon-10
struction: evidence and reasons for equilibrium stable-isotope incorporation, Palaeogeogr. Palaeoclimatol. Palaeoecol., 154, 325–337, 1999.
Hjort, C. and Funder, S.: The subfossil occurrence ofMytilus edulis L. in Central East Green-land, Boreas, 3, 23–33, 1974.
Ingram, B. L., Conrad, M. E., and Ingle, J. C.: Stable isotope and salinity systematics in
estuar-15
ine waters and carbonates: San Francisco Bay, Geochim. Cosmochim. Acta, 60, 455–467, 1996.
Inoue, K., Waite, J. H., Matsuoka, M., Odo, S., and Harayama, S.: Interspecific variations in adhesive protein sequences of Mytilus edulis, M. galloprovincialis, and M. trossulus, Biol. Bull., 189, 370–375, 1995.
20
Israelson, C., Buchardt, B., Funder, S., and Hubberten, H. W.: Oxygen and carbon isotope composition of Quaternary bivalve shells as a water mass indicator: Last Interglacial and Holocene, East Greenland, Palaeogeogr. Palaeoclimatol. Palaeoecol., 111, 119–124, 1994. Jones, D. S. and Quitmyer, I. R.: Marking time with bivalve shells: Oxygen Isotopes and season
of annual increment formation, Palaios, 11, 340–346, 1996.
25
Kaandorp, R. J. G., Vonhof, H. B., Del Busto, C., Wesselingh, F. P., Ganssen, G. M., Mar-mol, A. E., Romero Pittman, L., and van Hinte, J. E.: Seasonal stable isotope variations of the modern Amazonian freshwater bivalveAnodontites trapesialis, Palaeogeogr. Palaeocli-matol. Palaeoecol., 194, 339–354, 2003.
Khim, B.-K.: Stable isotope profiles ofSerripes groenlandicusshells, I. Seasonal and
interan-30
BGD
9, 12019–12046, 2012
Oxygen isotope ratios in the shell of
Mytilus edulis E. A. A. Versteegh et al.
Title Page
Abstract Introduction
Conclusions References
Tables Figures
◭ ◮
◭ ◮
Back Close
Full Screen / Esc
Printer-friendly Version
Interactive Discussion
P
a
per
|
Dis
cussion
P
a
per
|
Discussion
P
a
per
|
Discussio
n
P
a
per
|
Kijewski, T., Wijsman, J. W. M., Hummel, H., and Wenne, R.: Genetic composition of cultured and wild musselsMytilusfrom The Netherlands and transfers from Ireland and Great Britain, Aquaculture, 287, 292–296, doi:10.1016/j.aquaculture.2008.10.048, 2009.
Kim, S.-T. and O’Neil, J. R.: Equilibrium and nonequilibrium oxygen isotope effects in synthetic carbonates, Geochim. Cosmochim. Acta, 61, 3461–3475, 1997.
5
Krabill, W., Abdalati, W., Frederick, E., Manizade, S., Martin, C., Sonntag, J., Swift, R., Thomas, R., Wright, W., and Yungel, J.: Greenland ice sheet: high-elevation balance and peripheral thinning, Science, 289, 428–430, doi:10.1126/science.289.5478.428, 2000. McDonald, J. H., Seed, R., and Koehn, R. K.: Allozymes and morphometric characters of three
species of Mytilus in the Northern and Southern Hemispheres, Mar. Biol., 111, 323–333,
10
doi:10.1007/bf01319403, 1991.
McGovern, T. H., Amorosi, T., Perdikaris, S., and Woollett, J.: Vertebrate zooarchaeology of Sandnes V51: economic change at a chieftain’s farm in West Greenland, Arctic Anthropol., 33, 94–121, 1996.
Mortensen, J., Lennert, K., Bendtsen, J., and Rysgaard, S.: Heat sources for glacial melt in
15
a sub-Arctic fjord (Godth ˚absfjord) in contact with the Greenland Ice Sheet, J. Geophys. Res., 116, C01013, doi:10.1029/2010jc006528, 2011.
Price, S. F., Payne, A. J., Howat, I. M., and Smith, B. E.: Committed sea-level rise for the next century from Greenland ice sheet dynamics during the past decade, Proc. Natl. Acad. Sci. USA, 108, 8978–8983, doi:10.1073/pnas.1017313108, 2011.
20
Qiu, J.-W., Tremblay, R., and Bourget, E.: Ontogenetic changes in hyposaline tolerance in the musselsMytilus edulis andM. trossulus: implications for distribution, Mar. Ecol. Prog. Ser., 228, 143–152, doi:10.3354/meps228143, 2002.
Rawson, P. D., Joyner, K. L., Meetze, K., and Hilbish, T. J.: Evidence for intragenic recombina-tion within a novel genetic marker that distinguishes mussels in theMytilus edulis species
25
complex, Heredity, 77, 599–607, 1996a.
Rawson, P. D., Secor, C. L., and Hilbish, T. J.: The effects of natural hybridization on the regula-tion of doubly uniparental mtDNA inheritance in blue mussels (Mytilus spp.), Genetics, 144, 241–248, 1996b.
Rawson, P. D., Hayhurst, S., and Vanscoyoc, B.: Species composition of blue mussel
popula-30
BGD
9, 12019–12046, 2012
Oxygen isotope ratios in the shell of
Mytilus edulis E. A. A. Versteegh et al.
Title Page
Abstract Introduction
Conclusions References
Tables Figures
◭ ◮
◭ ◮
Back Close
Full Screen / Esc
Printer-friendly Version
Interactive Discussion
Discussion
P
a
per
|
Dis
cussion
P
a
per
|
Discussion
P
a
per
|
Discussio
n
P
a
per
|
Richardson, C. A., Seed, R., and Naylor, E.: Use of internal growth bands for measuring indi-vidual and population growth rates inMytilus edulisfrom offshore production platforms, Mar. Ecol. Prog. Ser., 66, 259–265, 1990.
Richter, A., Rysgaard, S., Dietrich, R., Mortensen, J., and Petersen, D.: Coastal tides in West Greenland derived from tide gauge records, OcDyn, 61, 39–49,
doi:10.1007/s10236-010-5
0341-z, 2011.
Riginos, C., and Cunningham, C. W.: Invited review: local adaptation and species segregation in two mussel (Mytilus edulis × Mytilus trossulus) hybrid zones, Mol. Ecol., 14, 381–400, doi:10.1111/j.1365-294X.2004.02379.x, 2005.
Rignot, E., and Kanagaratnam, P.: Changes in the Velocity Structure of the Greenland Ice
10
Sheet, Science, 311, 986–990, doi:10.1126/science.1121381, 2006.
Santos, S., Cardoso, J., Borges, V., Witbaard, R., Luttikhuizen, P., and van der Veer, H.: Isotopic fractionation between seawater and the shell ofScrobicularia plana(Bivalvia) and its appli-cation for age validation, Mar. Biol., 159, 601–611, doi:10.1007/s00227-011-1838-9, 2012. Sch ¨one, B. R., Flessa, K. W., Dettman, D. L., and Goodwin, D. H.: Upstream dams and
down-15
stream clams: growth rates of bivalve mollusks unveil impact of river management on estu-arine ecosystems (Colorado River Delta, Mexico), Estuar. Coast. Shelf. Sci., 58, 715–726, 2003.
Sch ¨one, B. R., Fiebig, J., Pfeiffer, M., Gleb, R., Hickson, J., Johnson, A. L. A., Dreyer, W., and Oschmann, W.: Climate records from a bivalved Methuselah (Arctica islandica, Mollusca;
20
Iceland), Palaeogeogr. Palaeoclimatol. Palaeoecol., 228, 130–148, 2005.
Stevens, R. E., Metcalfe, S. E., Leng, M. J., Lamb, A. L., Sloane, H. J., Naranjo, E., and Gonz ´alez, S.: Reconstruction of late Pleistocene climate in the Valsequillo Basin (Central Mexico) through isotopic analysis of terrestrial and freshwater snails, Palaeogeogr. Palaeo-climatol. Palaeoecol., 319–320, 16–27, doi:10.1016/j.palaeo.2011.12.012, 2012.
25
Swart, P. K.: Carbon and oxygen isotope fractionation in scleractinian corals: a review, Earth-Sci. Rev., 19, 51–80, 1983.
Varvio, S. L., Koehn, R. K., and V ¨ain ¨ol ¨a, R.: Evolutionary genetics of theMytilus eduliscomplex in the North Atlantic region, Mar. Biol., 98, 51–60, doi:10.1007/bf00392658, 1988.
Versteegh, E. A. A., Troelstra, S. R., Vonhof, H. B., and Kroon, D.: Oxygen isotopic composition
30
BGD
9, 12019–12046, 2012
Oxygen isotope ratios in the shell of
Mytilus edulis E. A. A. Versteegh et al.
Title Page
Abstract Introduction
Conclusions References
Tables Figures
◭ ◮
◭ ◮
Back Close
Full Screen / Esc
Printer-friendly Version
Interactive Discussion
P
a
per
|
Dis
cussion
P
a
per
|
Discussion
P
a
per
|
Discussio
n
P
a
per
|
Versteegh, E. A. A., Vonhof, H. B., Troelstra, S. R., Kaandorp, R. J. G., and Kroon, D.: Season-ally resolved growth of freshwater bivalves determined by oxygen and carbon isotope shell chemistry, Geochem. Geophy. Geosy., 11, Q08022, doi:10.1029/2009GC002961, 2010a. Versteegh, E. A. A., Vonhof, H. B., Troelstra, S. R., and Kroon, D.: A molluscan perspective
on hydrological cycle dynamics in Northwestern Europe, Netherlands J. Geosci., 89, 49–58,
5
2010b.
Versteegh, E. A. A., Vonhof, H. B., Troelstra, S. R., and Kroon, D.: Can shells of freshwater mussels (Unionidae) be used to estimate low summer discharge of rivers and associated droughts?, IJEaS, 100, 1423–1432, doi:10.1007/s00531-010-0551-0, 2011.
Wanamaker Jr., A. D., Kreutz, K. J., Borns, H. W., Jr., Introne, D. S., Feindel, S., and
Bar-10
ber, B. J.: An aquaculture-based method for calibrated bivalve isotope paleothermometry, Geochem. Geophy. Geosy., 7, Q09011, 13 pp., doi:10.1029/2005GC001189, 2006.
Wanamaker Jr., A. D., Kreutz, K. J., Borns Jr., H. W., Introne, D. S., Feindel, S., Funder, S., Rawson, P. D., and Barber, B. J.: Experimental determination of salinity, temperature, growth, and metabolic effects on shell isotope chemistry ofMytilus eduliscollected from Maine and
15
Greenland, Paleoceanography, 22, 12, 2007.
Wanamaker Jr., A. D., Kreutz, K. J., Sch ¨one, B. R., and Introne, D. S.: Gulf of Maine shells reveal changes in seawater temperature seasonality during the Medieval Climate Anomaly and the Little Ice Age, Palaeogeogr. Palaeoclimatol. Palaeoecol., 302, 43–51, doi:10.1016/j.palaeo.2010.06.005, 2011.
20
Watanabe, T., Suzuki, A., Minobe, S., Kawashima, T., Kameo, K., Minoshima, K., Aguilar, Y. M., Wani, R., Kawahata, H., Sowa, K., Nagai, T., and Kase, T.: Permanent El Ni ˜no dur-ing the Pliocene warm period not supported by coral evidence, Nature, 471, 209–211, doi:10.1038/nature09777, 2011.
Westerbom, M. W., Kilpi, M. K., and Mustonen, O. M.: Blue mussels, Mytilus edulis, at the
25
edge of the range: population structure, growth and biomass along a salinity gradient in the North-Eastern Baltic Sea, Mar. Biol., 140, 991–999, doi:10.1007/s00227-001-0765-6, 2002. Williams, B., Halfar, J., Steneck, R. S., Wortmann, U. G., Hetzinger, S., Adey, W., Lebednik, P.,
and Joachimski, M.: Twentieth centuryδ13C variability in surface water dissolved inorganic carbon recorded by coralline algae in the Northern North Pacific Ocean and the Bering Sea,
30
BGD
9, 12019–12046, 2012
Oxygen isotope ratios in the shell of
Mytilus edulis E. A. A. Versteegh et al.
Title Page
Abstract Introduction
Conclusions References
Tables Figures
◭ ◮
◭ ◮
Back Close
Full Screen / Esc
Printer-friendly Version
Interactive Discussion
Discussion
P
a
per
|
Dis
cussion
P
a
per
|
Discussion
P
a
per
|
Discussio
n
P
a
per
|
Yanes, Y., Romanek, C. S., Molina, F., C ´amara, J. A., and Delgado, A.: Holocene pa-leoenvironment (∼7200–4000 cal BP) of the Los Castillejos archaeological site (SE Spain) inferred from the stable isotopes of land snail shells, Quatern. Int., 244, 67–75, doi:10.1016/j.quaint.2011.04.031, 2011.
BGD
9, 12019–12046, 2012
Oxygen isotope ratios in the shell of
Mytilus edulis E. A. A. Versteegh et al.
Title Page
Abstract Introduction
Conclusions References
Tables Figures
◭ ◮
◭ ◮
Back Close
Full Screen / Esc
Printer-friendly Version
Interactive Discussion
P
a
per
|
Dis
cussion
P
a
per
|
Discussion
P
a
per
|
Discussio
n
P
a
per
|
Table 1.Specifications of shell samples.
Sample ID Location Collection Shell
BGD
9, 12019–12046, 2012
Oxygen isotope ratios in the shell of
Mytilus edulis E. A. A. Versteegh et al.
Title Page
Abstract Introduction
Conclusions References
Tables Figures
◭ ◮
◭ ◮
Back Close
Full Screen / Esc
Printer-friendly Version
Interactive Discussion
Discussion
P
a
per
|
Dis
cussion
P
a
per
|
Discussion
P
a
per
|
Discussio
n
P
a
per
|
Table 2.PCR-based nuclear markers forMytilus.
Marker Enzyme Fragment sizes (bp) References
M. edulis M. trossulus M.
gallopro-vincialis
Mal-1 SpeI ∼650 ∼425/350/275 Rawson et al. (1996b, 2001)
ITS HhaI 200 200/450 200 Heath et al. (1995)
Glu-5′
− 350/380 240 300/500 Rawson et al. (1996a)
Me 15/16 − 180 168 126 Inoue et al. (1995),
BGD
9, 12019–12046, 2012
Oxygen isotope ratios in the shell of
Mytilus edulis E. A. A. Versteegh et al.
Title Page
Abstract Introduction
Conclusions References
Tables Figures
◭ ◮
◭ ◮
Back Close
Full Screen / Esc
Printer-friendly Version
Interactive Discussion
P
a
per
|
Dis
cussion
P
a
per
|
Discussion
P
a
per
|
Discussio
n
P
a
per
|
Table 3.Comparison of ventral marginδ18Ocandδ 18
Opredvalues.
Sample ID Collection Station δ18Opred Ventral marginδ 18
Oc
date (‰ VPDB) (‰ VPDB)
Nipisat Sound 2 14/05/2010 GF3 2.50 2.82
Akia 10a 02/06/2011 GF5 1.85 1.73
BGD
9, 12019–12046, 2012
Oxygen isotope ratios in the shell of
Mytilus edulis E. A. A. Versteegh et al.
Title Page
Abstract Introduction
Conclusions References
Tables Figures
◭ ◮
◭ ◮
Back Close
Full Screen / Esc
Printer-friendly Version
Interactive Discussion
Discussion
P
a
per
|
Dis
cussion
P
a
per
|
Discussion
P
a
per
|
Discussio
n
P
a
per
|
Godthåbsfjord
Akia
Kapissillit
Ice cap
Nipisat Sound
Godthåbsfjord archipelago
Ice Fjord north Ice Fjord south
GF3 GF5
GF10
10 km
BGD
9, 12019–12046, 2012
Oxygen isotope ratios in the shell of
Mytilus edulis E. A. A. Versteegh et al.
Title Page
Abstract Introduction
Conclusions References
Tables Figures
◭ ◮
◭ ◮
Back Close
Full Screen / Esc
Printer-friendly Version
Interactive Discussion
P
a
per
|
Dis
cussion
P
a
per
|
Discussion
P
a
per
|
Discussio
n
P
a
per
|
2005 2006 2007 2008 2009 2010 2011 Date
-2 0 2 4 6 8 10
T (
oC)
-20 -16 -12 -8 -4 0
δ
18O
w
(‰ VSMOW)
GF3
2009 2010 2011 Date
GF5
2009 2010 2011
Date
0 10 20 30 40
Sa
linity
-20 -16 -12 -8 -4 0 4
Predicted
δ
18
O
c (‰ VPDB)
GF10
A B C
Fig. 2. (A–C)Environmental data at water monitoring locations. Solid grey circles and lines are temperature; open grey diamonds and dashed lines are salinity. Black diamonds areδ18Ow
measurements; dashed black lines showδ18Owvalues calculated from the linear relationship
between salinity andδ18Ow(Eq. 4). Solid black lines indicateδ 18
Opred values based on
BGD
9, 12019–12046, 2012
Oxygen isotope ratios in the shell of
Mytilus edulis E. A. A. Versteegh et al.
Title Page
Abstract Introduction
Conclusions References
Tables Figures
◭ ◮
◭ ◮
Back Close
Full Screen / Esc
Printer-friendly Version
Interactive Discussion
Discussion
P
a
per
|
Dis
cussion
P
a
per
|
Discussion
P
a
per
|
Discussio
n
P
a
per
|
Fig. 3.Box-whisker diagram ofδ18O values of all shells. Grey boxes are 50 % of data, whiskers 25 % of data each, outliers are indicated with+symbols. At the left side of the graph are the shells that were collected closest to the open ocean and show least influence of freshwater in theirδ18Oc values. At the right side are the shells collected closest to the glacier, with most
BGD
9, 12019–12046, 2012
Oxygen isotope ratios in the shell of
Mytilus edulis E. A. A. Versteegh et al.
Title Page
Abstract Introduction
Conclusions References
Tables Figures
◭ ◮
◭ ◮
Back Close
Full Screen / Esc
Printer-friendly Version
Interactive Discussion
P
a
per
|
Dis
cussion
P
a
per
|
Discussion
P
a
per
|
Discussio
n
P
a
per
|
A B
C D
E F
G H
I J
Fig. 4. (A–J)Seasonalδ18Ocgraphs of shells. In dark grey distinct dark growth lines (expected
BGD
9, 12019–12046, 2012
Oxygen isotope ratios in the shell of
Mytilus edulis E. A. A. Versteegh et al.
Title Page
Abstract Introduction
Conclusions References
Tables Figures
◭ ◮
◭ ◮
Back Close
Full Screen / Esc
Printer-friendly Version
Interactive Discussion
Discussion
P
a
per
|
Dis
cussion
P
a
per
|
Discussion
P
a
per
|
Discussio
n
P
a
per
|
Fig. 5.Scatter plot showing the relationship betweenδ18Owand salinity for the three sampling
locations:δ18Ow=0.631·S−21.84 (R 2
BGD
9, 12019–12046, 2012
Oxygen isotope ratios in the shell of
Mytilus edulis E. A. A. Versteegh et al.
Title Page
Abstract Introduction
Conclusions References
Tables Figures
◭ ◮
◭ ◮
Back Close
Full Screen / Esc
Printer-friendly Version
Interactive Discussion
P
a
per
|
Dis
cussion
P
a
per
|
Discussion
P
a
per
|
Discussio
n
P
a
per
|
A B
C
Fig. 6. (A–C)Comparison ofδ18Opredandδ 18
Oc values for three different sites. In addition to