Impact of Institutional Credit on Agricultural Output:
A Case Study of Pakistan
Nawaz AHMAD National College of Business Adrministration & Economics, Lahore [email protected]
Abstract. This paper looks at the role of credit to agricultural sector in Pakistan. It begins with an analysis of credit as indirect input to agricultural sector. It helps the farmers to buy modern and expensive inputs such as tractor, tubewel, seeds, fertilizers etc. The study covers the period from 1974 to 2008. The empirical findings show that there is a significant role of credit in agriculture sector.
Keywords: Taccavi loans; farm mechanization; stationarity; cointegration; Granger causality.
JEL Codes: G32, Q14. REL Codes: 11E, 15B.
Agriculture sector has been predominant sector in Pakistan since independence. Agricultural output has been key source of growth in Pakistan’s Gross Domestic Product (GDP) which grew about 3.6 percent a year for 25 years. The rate of economic growth in UDCs has been largely a function of the rate of growth in agriculture, which on average contributes nearly 50 percent towards their GDP (Afzal, 2004). In Pakistan’s history, share of agricultural sector to GDP was 60 percent in 1949-1950 that decreased to 30 percent in 1978-1979 and further to 20 percent in 2006-2007. But it is still the largest single component of total GDP. It absorbs nearly 43.1 percent of employed labour force. Agriculture sector has grown at an average rate of 4.1 percent per annum since 2002-2003 and experienced continuous variations from 6.5 percent to 1.1 percent from 2002-2003 to 2007-2008 as given in Table 1 (Ministry of Finance Division, 2009).
Agriculture sector has been also the great source of export earnings. Most of the economists are of the opinion that agriculture growth should be pursued within the framework of comprehensive national plan and should be integrated with the growth of other sectors. Agriculture sector is major source of food requirements of 67.5 percent rural population and 32.5 percent urban population besides provision of raw material to the industrial sector.
Table 1 Agriculture growth rate
Years Growth
(percent) Years
Growth
(percent) Years
Growth (percent) 1999-2000 6.1 2002-2003 4.1 2005-2006 6.3 2000-2001 -2.2 2003-2004 2.4 2006-2007 4.1 2001-2002 0.1 2004-2005 6.5 2007-2008 1.1
Source: Federal Bureau of Statistics.
The growth of agriculture sector in Pakistan always was low compared to developed economies. This growth has been the major component of the growth of industrial sector also. In USA, agriculture growth provided the necessary ignition to industrial development in the early period and agriculture was not sidelined as the industrial development picked up speed and momentum.
Therefore, this growth had required the use of chemical fertilizers, high yielding varieties of seeds, better irrigation, and mechanical equipments, which in turns had required the credit availability to the farmers.
strengthened as it was obvious from the import of pesticides which was reported increased more than 135 percent. Fertilizer consumption increased by 128 percent over the decade. Area irrigated by tubewell water increased from 2.56 million hectares in 1991 to 3.82 million hectares in 2007-2008 (Ministry of Finance Division, 2008).
1.1. Importance of credit
Small farmers, large farmers and non-farm population in agriculture sector all suffer from the problem of lacking in capital. After green revolution, and technological changes in this sector, the requirement of credit has increased to buy modern inputs. Large farmers also need the credit for the lumpy investment in this sector. Small farmers usually face cumbersome procedure and collateral problems in availing credit. These impediments had hardly hit the tenants and share croppers who did not own land. Other problems like providing credit to targeted farmers did not increase the number of farmers benefiting from this facility
Despite these problems, the role for financial institutions has been significant and emerged in the wake of technological changes in agriculture sector. In the past subsidized interest rate policy and share reserved for the poor farmers remained ineffective due to financial unsustainability in the loans portfolios. State Bank of Pakistan has introduced banking reforms and revised policies from time to time. Mandatory credit targets by Federal Bank for Cooperatives and by commercial banks were fixed for small farmers. Agriculture Development Bank of Pakistan established in 1961 has been playing its role to carter the need of poor farmers and non-farmers. Under the direction of government ADBP introduced special credit schemes, supervised Agricultural Credit System, and five loan windows. These loan windows provided Development Loans, Production Loans, Cottage Industry Loans, Agri-business Loans, and Off-farm Income Generating Loans. State Bank policy for giving subsidy on agriculture loans has been successful in the view of enabling the farmers to buy modern inputs and machinery and at the same time has been impediment in the efforts of Cooperative Societies and ADBP to mobilize deposits from their customers.
1.2. Impact of agricultural credit on production
The role of credit in agriculture sector has been significant. In modern agriculture, farming has become now complex and needs careful planning to achieve success, i.e. agriculture is no more a mode of life rather it has changed into commercial farming. Transformation of traditional agriculture sector to modern commercialization farming needs credit availability. Though there is a significant increase in borrowing from formal sources from 1985 onwards when mark-up free loans were made available to farmers. Rural credit reaches few rural households, and formal sources provide credit to only a small proportion of rural households. Only 32 percent of all rural households take loans, of these a mere 10 percent borrowing is from institutional sources. Not surprisingly, there is a positive correlation between wealth and access to source of credit. Richer households in the rural areas have better access to institutional sources, which are also cheaper, while poor households depend primarily on more expensive, non institutional credit.
0 40000 80000 120000 160000 200000
1975 1980 1985 1990 1995 2000 2005 Years
Tot
a
l C
redi
t S
u
ppl
y
i
n
R
s
.
m
il
l
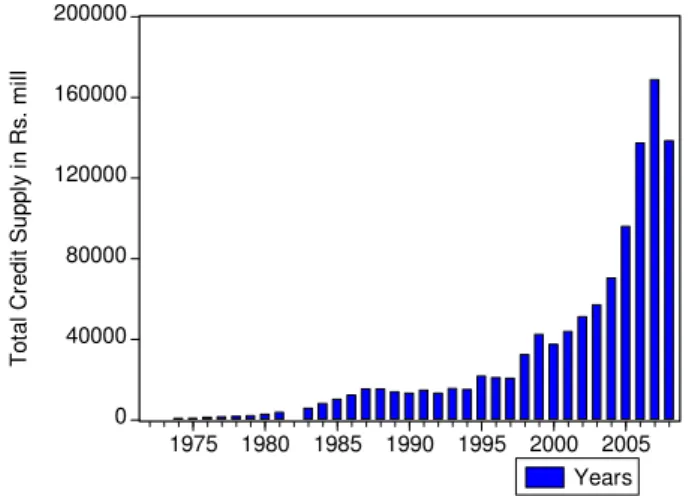
Figure 1. Total credit supply by all institutions
The share of ZTBL in supply of total agricultural credit by institutions increased and was 29.9 percent during (July- March) 2008-2009. While the share of other institutions in total credit disbursement reduced as compared to ZTBL. The performance of commercial banks, however, in providing credit has surpassed the share of ZTBL was 48.9 percent of the total credit disbursed during July-March 2008-2009 (Ministry of Finance Division, 2009).
share in supply of total agricultural credit by institutions increased and was 29.9 percent in July-March 2008-2009 (Ministry of Finance Division, 2009). The reason behind this declining percentage from the year 1983-1984 to 2008-1909 is to focus more on targeted loans to small farmers.
Tacccavi loans are provided through the Provincial Revenue Department of the Government. Provision of these loans is in the hands of provinces. In Punjab it grew at the rate of 41 percent from 1975-1976 to 2007-2008. But the situation for the rest of the provinces is entirely different. In Sindh loans are non-existent since 1993-1994. In NWFP, it was provided up till 1978-1979. In Balochistan, it has been showing non-continuous flow. The overall situation is showing declining trend from 1975-1976 till now. This kind of loans depends upon the support of federal government to the provincial governments (Ministry of Finance Division of Pakistan, 2009).
Sarwar et al. (1985) studied that there were two sources of the credit or cash for farmers, i.e. institutional and non-institutional. The non-institutional source was neither adequate nor reliable for the cash needs of the farmers. Other one source that is institutional credit that operates through its three major institutions, namely ADBP, commercial banks, and cooperatives. The credit advanced through these institutions increased since 1970s and the number of beneficiaries had also been reported to be growing till 1984-1985 but study shown its dissatisfaction regarding the rightness of these loan operations. Malik et al. (1989) studied the significance of institutional source of credit, which increased their credit facilities to the small farmers especially the credit from the ADBP, commercial banks, and cooperatives. While the non-institutional credit showed downward trend, especially loans from relatives and friends. Despite all the facts the results in this study showed, very little access of credit for small farmers. Khan et al. (1990) found that small farmers in Pakistan are 74 percent of the total number of farmers but the area they possess is only 34 percent of the total cultivable land. Malik et al. (1992) studied the disbursement of credit for improved seeds, water and tractors for the period of 1971 to 1987 and found these inputs grew at rates ranging from 3 percent to 15 percent per annum. The performance of disbursement of credit has been impressive that grew at the rate of 28 percent. This study also found the determinants of the probability of access to institutional credit.
small enough to have efficient labour supervision. Qureshi and Shah (1992) observed that the institutional credit affects agricultural output also through financing of capital investment. They found that the responsiveness of agriculture output is larger to institutional credit than that of output to fertilizer. Sarfraz and Akhtar (1992) attempted to review farm credit policy in Pakistan in relation to its impact on agricultural growth. This study found that credit is not significantly related to output but indirectly through buying inputs credit is impacting on output. This study also focused the role of commercial banks in providing loans to farmers. Udry (1994) concluded in the study the market imperfection and its failure in the agriculture sector regarding availability of credit to the farmers. This study analyzed the households in Northern Nigeria borrow more when they face an adverse shock and they lend more when they attain some positive shock. These two models of this paper analyzed Walrasian competitive model and, in second, imperfect market situation in rural credit market. Both models focused on the significance of credit payments to a farmers but a Pareto efficient risk-pooling equilibrium was not observed. Ebrahim (2000) focused the role of agriculture cooperatives in Indian’s economic development as a means of encouraging large scale agriculture production while enhancing community cooperation and equity. Khandker and Faruquee (2002) described the character of cost effectiveness in providing of farm credit provided by Agriculture Development Bank of Pakistan. Dirk (2002) analyzed one of the bottlenecks of successful transformation in many sector, and particularly the agricultural sector in Central European post-socialist countries has been and continues to be the underdevelopment of the financial sector (OECD, 2001, Rother, 1999, World Bank, 1995). Now the phase of large macroeconomic changes is followed by one of adjustment and consolidation in the micro economic sphere, banks with their financial and governance potential could play a vital role in reorganizing the agricultural sector towards a long-term viable structure. Iqbal et al. (2003) used regression analysis approach with Cobb-Douglas production function to estimate the impact of institutional credit on agriculture production in Pakistan. The study suggested the growth of institutional credit and this credit especially should be provided to small farmers.
2. Model, data and estimation
This study used annual data for the period 1972 to 2008. All the data were obtained from Ministry of Finance Division (2008), Statistical year Book of Pakistan (2008), Agriculture Statistics of Pakistan (2008), and World Development Indicators (2007). Following Iqbal et al. (2003) Aryectey (1997) and Mpuga (2004) attempted to characterize the rural financial markets, as formal and informal. Our objective is to study the impact of the credit on agricultural value added.
2.1. Variables of study
Yt = Agricultural out put (value added) measured in terms of million rupees;
Lt = Cropped land in million hectares;
Lat = Labour force in million;
Crt = Credit disbursement from all institutions in million rupees;
Wt = Water availability in million acre feet;
Dt = Dummy variable for bad years (dummy=1 for years 1974-1975,
1983-1984, 1992-1993, 2000-2001; Else=0).
2.2. Specification of model
Conventionally, agricultural output function depends upon the inputs like land, labour, capital and quantities of other inputs such as water, fertilizer, pesticides etc. However, in this study agricultural output (value added) is used as dependent variable and output is assumed to be a function of availability of credit, labour force, cropped area, water and all those inputs which are purchased with the help of credit such as seeds, fertilizers, tractors and tubewells. But, instead of taking seeds, fertilizers, tractors and tubewells, only credit was taken as this is used to buy all these inputs. Based on the above discussion the model showing the impact of institutional credit on agricultural output has been developed as:
Yt = f (Lt, Lat, Crt, Wt,t, Dt) + µt … (1)
t = 1,2,3……….
dropped and agricultural credit was used as one of the explanatory variables. Agricultural credit, in fact, indirectly affects the agricultural output through purchasing these inputs. Therefore, this study has included credit as an explanatory variable in the model on the argument of Carter (1989) and Iqbal et al. (2003) and Afzal (2005). This credit affects the performance of agricultural output in these ways:
2.3. Methodology
Our study is based on time series data. Normally time series data have the problem of non stationarity. There are two approaches to check the problem of stationarity, i.e. traditional and modern approaches. In traditional approach correlogram is used to check the stationarity of data. In modern approach Augmented Dicky Fuller test (ADF) and Phillips Perron test (PP) are used. Since credit is being disbursed in buying the expensive inputs like tractors, tube wells, seeds, and fertilizers therefore; it was better justified to just see the long run impact and causality of credit, labour, cropped area and water with agriculture output.
2.4. Unit root test
This can be done by using the Augmented Dickey-Fuller (ADF) test for the presence of unit roots under the alternative hypothesis that the time series in question is stationary around the following specifications. A first specification includes the intercept but excludes the trend term. The second specification includes both the trend term and constant term.
ADF test for unit root is based on following regression equations.
At constant
(1-L)Xt=α + Xt-1 + 1 k
i i
θ
=
∑
(1-L)xt-1 + έt… (2)At constant and trend
(1-L)Xt=α + Xt-1 + T + 1 k
i i
θ
=
∑
(1-L)xt-1 + έt… (3)where>
L is a lag operator, t denotes time trend, and έt is a white noise. For this
Ho: =0; (Yt is Non-Stationary) has a unit root
Ha: <0; (Yt is a Stationary) has not a unit root.
Reject the null hypothesis if the t-statistic is less than the critical value in real terms. If null hypothesis cannot be rejected, it implies that the time series is non-stationary at the level and therefore it requires taking first or higher order of differencing of the level data to establish stationary. The optimal lag length is also required to insure the residuals not to be correlated in the ADF regression.
2.5. ARDL model specification
There are several methods available to test for the existence of the long run equilibrium relationship among time series variables. The cointegration approach used by (Engle, Granger, 1987) to test the long run relationship, fully modified OLS procedure of (Phillips, Hansen’s, 1990) maximum likelihood based on Johansen-Juselius (1990). This approach is used when variables in the model are integrated of same order and further extended by Pesaran. This test has a problem of low power and is not good for small sample. Therefore, the ARDL was approached by Pesaran and Shin (1990) and further extended by Pesaran et al. (2001). This is used for multivariate case, for several reasons. Firstly, the bounds testing procedure is simple as opposed to other multivariate cointegration techniques such as proposed by Johansen and Juselius (1990). The ARDL approach which requires the dependent variable or regressor to be integrated at I(1) is advantageous because the explanatory variables or regressands can either be purely integrated at I(1) or I(0) or a mix of both. Secondly, the bounds testing procedure does not require the pre-testing of the variables included in the model for unit roots unlike other techniques such as the Johansen approach. Thirdly, the test is relatively more efficient in small or finite sample data sizes as is the case in this study. The procedure will, however, crash in the presence of I(2) series. Following Pesaran et al.(2001), as summarised in Choong et al. (2005), we apply the bounds test procedure by modeling the long-run equation (4) as a general vector autoregressive (VAR) model of order p, in Zt :
zt = co + α×T +
1
p
ι β
=
∑
i ×zt-i+εt , T = 1, 2……n … (4)with corepresents intercepts, and α denotes (p+1)-vector of trend coefficients.
(1-L)zt = co + α×T + βi ×zt-1+ 1
1 p
i
γ
−
=
∑
i(1-L)× zt-i+εt , … (5)T = 1, 2…, …n
where (p) is the order of autoregressive lags (n), (1-L) =Δ is a difference
ope-rator, (k +1)x(k+1)-matrices β=Ik+1 +
∑
−= 1
1 p
ι
ψ i and i = -
∑
−+ =
1
1 ρ
ι
ψ
j
j, i=1,2…, … p-1
and contains the long run multipliers and short run dynamics coefficients of VECM. Zt is the vector of variables Yt, and Xt respectively. yt is an I(1)
dependent variable defined as Yt and Xt= [Lt,,Lat,Crt,Wt]. In model vector
matrix of forcing I(0) and (1) regressors as already defined with multivariate identically and independently (i.i.d) zero mean error vector εt = ( ε1t, ε2t) and a
homoskedastic process.
3. Result and discussion
The DF/ADF (Dickey Fuller) and (Augmented Dickey Fuller) DF/ADF unit root test are employed to test the stationarity of all variables in the models. Phillips and Perron (1988) have suggested a nonparametric test as an alternative to the ADF test. The aim of this is to consider autoregressive and/or hetroskedastic error terms in relation. The test statistic for the hypotheses ρ = 1 is, however, rather adjusted by a non-parametric estimate of the variance of the estimated parametric ρ that takes the autocorrelation of the residual into account.
Table 2 DF/ADF (At level)
Variables Constant Constant & trend
lnCrt -3.6394*** (0) -5.3099*** (0)
lnLt -2.40566 (1) -2.2217 (1)
lnYt -1.22890 (1) -5.09905*** (1)
lnLat -4.20905*** (0) -0.743715 (0)
lnWt -0.1856 (0) -1.725371 (0)
Source: Author’s calculations.
Notes: The null hypothesis is that series is non-stationarity, or contains a unit root. The rejection of null hypothesis for DF/ADF test is based on the Mackinnon critical values and numbers in parentheses indicate number of lags (k) based on Schwarz information criterion (SIC).
*** Indicates the rejection of null hypothesis of non-stationary at 1%, 5%, 10% level of significance.
** Indicates the rejection of null hypothesis of non-stationary at 5%, 10% level of significance.
Table 3 Dickey Fuller/Augmented Dickey Fuller (At first difference)
Variables Constant Constant & trend
lnCrt -4.64243*** (0) -4.56701*** (0)
lnLt -9.90560*** (0) -10.3396*** (0)
lnYt -9.31607*** (0) -9.20534*** (0)
lnLat -3.57576** (0) -4.4185*** (0)
lnWt -5.40814*** (0) -5.444206*** (0)
Source: Author’s calculations. Notes: The null hypothesis is that series is non-stationarity, or contains a unit root. The rejection of null hypothesis for DF/ADF test is based on the Mackinnon critical values and numbers in parentheses indicate number of lags (k) based on Schwarz information criterion (SIC). *** Indicates the rejection of null hypothesis of non-stationary at 1%, 5%, 10% level of significance. Table 4 Phillips Perron (At level ) Variables Constant Constant & trend lnCrt -4.44023***(2) -4.9535***(3) lnLt -2.29203* (0) -4.9462***(3) lnYt 4.38518*** (2) -6.5040***(8) lnLat -4.2523*** (5) -0.65904 (6)
lnWt .394826 (6) -1.75552 (3)
Source: Author’s calculations. *** Indicates the rejection of null hypothesis of non-stationary at 1%, 5%, 10% level of significance. * Indicates the rejection of null hypothesis of non-stationary at 10% level of significance. Table 5 Phillips Perron (At first difference) Variables Constant Constant & trend lnCrt -4.43760*** (0) -4.6945*** (1)
lnLt -17.812*** (20) -28.303*** (29)
lnYt 31.5291*** (29) -30.38 *** (29)
lnLat -3.5737** (0) -4.3831*** (5)
lnWt -5.389787** (6) -5.570174*** (8) Source: Author’s calculation.
*** Indicates the rejection of null hypothesis of non-stationary at 1%, 5%, 10% level of significance.
3.1. Cointegration results
The study was aimed to analyse the impact of credit on agricultural out put. To this end, the study of the relationship among time series is essential in capturing the true impact. The cointegration is related with long run equilibrium between the two or more than two variables. The economic interpretation is that there should be link between two or more than two variables in the long run, even though series of observation of variables may deviate from the equilibrium. But they will move towards equilibrium in the long run (Harris, Sollis, 2003).
There are many approaches to conduct cointegration tests like Engle-Granger (1987), maximum likelihood based Johansen (1991, 1995) and Johansen –Juselius (1990) test.
By applying unit root test, we already had drawn the conclusion of the stationarity of variables on level and first difference. This is the justification of applying ARDL approach to cointegration, apart from this due to low power and other problems associated with Engle-Granger (1990), Johansen-Juselius (1990). The hypothesis of this study can be examined using F-statistic. The upper and lower bonds value for F-statistic in the model depends upon whether it contains trend or intercept or both or any one of them as specified by Pesaran et al. (2001). Moreover, whether they are taken as restricted intercept and trend or any one of them means that deviation of intercept and trend from its mean or unrestricted intercept and trend or any one of them means that no deviation of intercept and trend from its mean.
Table 6 Unrestricted intercept and unrestricted trend
At 0.100 At 0.050 At 0.010 VARIABLES
(when taken as a dependent)
F-Statistics
I(0) I(1) I(0) I(1) I(0) I(1)
dlnYt 7.19*** 2.38 3.45 2.69 3.83 3.34 4.63
dLLt --- 2.38 3.45 2.69 3.83 3.34 4.63
dlnCrt 2.313 2.38 3.45 2.69 3.83 3.34 4.63
dlnLat 3.77** 2.38 3.45 2.69 3.83 3.34 4.63
dlnWat 4.406*** 2.38 3.45 2.69 3.83 3.34 4.63
Source: Author’s calculation.
** Means at 5%, 10% significant levels reject the null hypotheses of no cointegration. *** Means at 1%, 5%, 10% significant level reject the null hypotheses of no cointegration.
The above Table 6 depicts the (Wald) F-statistic values to consider whether there is long run relationship or not through cointegration approach. Among the variables, when agricultural value added, cropped area and labour were shown as a dependent variable then their relative F-statistic values were FYt =7.19, Flat=3.77 and FWat =4.406, respectively. From these results it is
clear that LYt is a significant as its F-statistic values crosses the upper bound
value at 5% and 10%. This shows the long run relationship is found and witnessed the cointegration when agricultural value added was a dependent variable. While labour and water also have cointegration as their F-Statistic crossed the upper bound and significant at 1%, 5% and 10%, while the F-Statistic for dLLt is undefined due to its zero lag. On the other hand FCrt=
2.313 falls with in upper and lower bond which shows no cointegration.
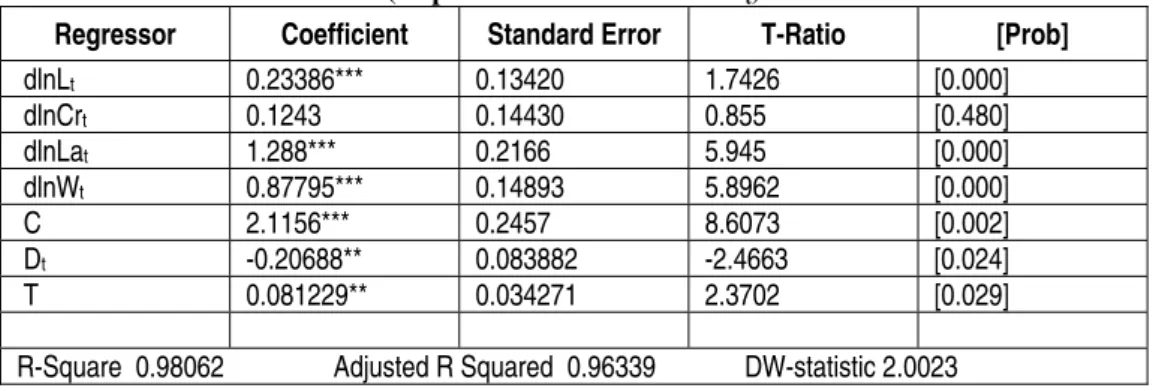
Table 7 Estimated long run coefficients using the ARDL approach ARDL (1,0,1,3,2)
selected based on Schwartz Bayesian criterion (Dependent variable is dlnYt)
Regressor Coefficient Standard Error T-Ratio [Prob]
dlnLt 0.23386*** 0.13420 1.7426 [0.000]
dlnCrt 0.1243 0.14430 0.855 [0.480]
dlnLat 1.288*** 0.2166 5.945 [0.000]
dlnWt 0.87795*** 0.14893 5.8962 [0.000]
C 2.1156*** 0.2457 8.6073 [0.002]
Dt -0.20688** 0.083882 -2.4663 [0.024]
T 0.081229** 0.034271 2.3702 [0.029]
R-Square 0.98062 Adjusted R Squared 0.96339 DW-statistic 2.0023
Source: Author’s calculation.
Table 7 presents the results for long-run coefficient estimated using the ARDL estimator. It is evident that land area (cropped area) is highly significant and showing to enhance the agricultural value added. The land as a basic input shows its coefficient 0.23386; this means 1% increase in cropped area will enhance the output almost by 0.23%. The agricultural credit is showing right positive relation with agricultural output as it is used to buy various inputs but indirectly affects the output. The credit is statistically insignificant with coefficient of 0.12431. This means 1% increase in credit will increase the agricultural output almost by 0.12%. The empirical results in this study are contradicted with the results carried out in most of the past studies such as Iqbal et al. (2003), Afzal (2005). Most of these studies in the past used OLS regression approach but this study followed ARDL approach to cointegration in order to estimate the short and long-run relationship in the model with desired variables. OLS regression approach gives spurious results in time series analysis because of stationarity problem in data. Therefore in the past studies of OLS regression approach results about the significance of credit were not much reliable. In this study the insignificant coefficient of credit is the result of many implications attached with the constraints and disbursement of this credit on the part of the poor farmers. These were discussed in detail in the next chapter. Labour in agricultural sector has a significant role as t-statistic is highly significant and the coefficient of labour shows that on average 1% increase in labour will increase the output by 1.2%. The significant and positive coefficient of water 0.87 shows that on average 1% increase in water increases the output by 0.87%. The negative coefficient of dummy variable shows that natural epidemics and bad weather conditions decreases output. In this model R square is 0.98 which explains that 0.98 percent variation in agricultural output is due to independent variables.
Table 8 Error correction representation for the selected ARDL model ARDL (1,0,1,3,2)
selected based on Schwartz Bayesian criterion (Dependent variable is dlnYt)
Regressor Coefficient Standard Error T-Ratio[Prob]
dlnLt 0.058756* 0.038051 1.867[.0175]
dlnCrt 0.015305* 0.00893 1.7138[.099]
dlnCrt-1 0.01325** 0.00607 2.1822[.039]
dlnLat 1.3397*** 0.35875 3.7343[.009]
dlnWt 0.10781* 0.05555 1.9406[.064]
dlnWt-1 0.28322*** 0.06009 4.7129[.000]
dlnWt-2 0.071630 0.04680 1.5303[.139]
C 0.53153*** 0.10821 4.912[.000]
Dt 0.26353** .096154 2.7408[.012]
T -0.10347 .045062 -2.2962[.032]
ecm(-1) -1.1539 .11523 -10.0147[.000]
Source: Author’s calculation.
When conitegration is found in the long run equations through F-Statistic, then we find short-run analysis through error correction term Bannerjee et al. (1998). The coefficient of ECTt-1 measures the speed of adjustment of the
model back to long-run equilibrium after disequilibrium which occurs due to shocks. The estimated coefficient of ECTt-1 (-1.1539) is highly significant and
correct negative sign indicates the convergence or movement back to the equilibrium within a year Bannerjee et al. (1998). This implies that time period of adjustment is approximately nine months 1/1.1539 =0.86. The estimated coefficient of ECTt-1 (-1.1539) is highly significant also shows that
cointegration is found in variables i.e. value added, labour, and water.
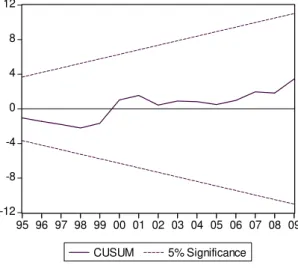
-12 -8 -4 0 4 8 12
95 96 97 98 99 00 01 02 03 04 05 06 07 08 09
CUSUM 5% Significance
Figure 2. CUSUM at 5% significance
-0.4 0.0 0.4 0.8 1.2 1.6
95 96 97 98 99 00 01 02 03 04 05 06 07 08 09 CUSUM of Squares 5% Significance
The structural stability of the equations is observed through the cumulative sum (CUSUM) and cumulative sum of squares test on recursive residuals. The diagonostic tests detect systematic changes in the regression coefficients as applied. Whereas the latter CUSUM and CUSUMQ detect sudden changes from the constancy of the regression coefficients. The results in Figures 2 and 3, show that the test statistics are within 5% confidence interval band. This suggests that estimated model is stable over time.
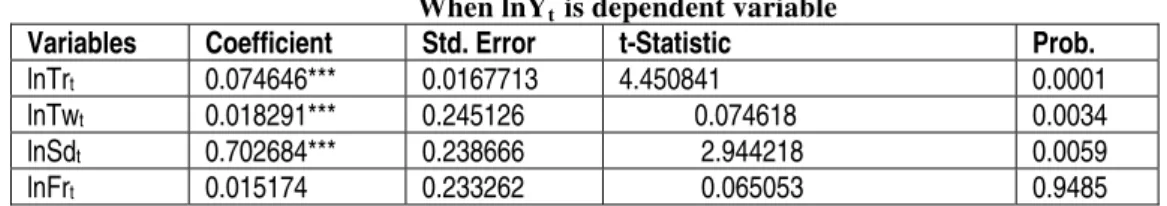
In the next step study analysis the impacts on agricultural output of those inputs which are bought by credit e.g. tubewells, tractors, fertilizers and seeds. This is represented in model form as
lnYt= 0 + 1×lnTwt+ 2× lnTrt+ 3×lnSdt+ 4× lnFrt+µ1t … (6)
The objective of this model is to check that which variable has a greater impact on agricultural output as all these are bought against credit. The results of this estimation are given in the Table 9.
Table 9 When lnYt is dependent variable
Variables Coefficient Std. Error t-Statistic Prob.
lnTrt 0.074646*** 0.0167713 4.450841 0.0001
lnTwt 0.018291*** 0.245126 0.074618 0.0034
lnSdt 0.702684*** 0.238666 2.944218 0.0059
lnFrt 0.015174 0.233262 0.065053 0.9485 Source: Author’s calculation.
Note: *, ** and *** means 10%, 5% and 1% level of significance respectively.
Table 10 Significance of model
R-Squared Adj R-Squared Durbin-watson
0.86 0.85 1.88202
inference based on augmented level VAR with integrated and cointegrated processes. The advantage of using this procedure is that it is not necessary to pretest the variables for the integration and cointegration properties and therefore avoids the possible pretest biases.
This study requires two test procedures. First step includes determination of the lag length (k) and the maximum order of integration (d) of the variables in the system. Schwartz’s Bayesian Information Criterion (BIC) is used to determine the appropriate lag structure of the VAR. Given VAR (k) selected, and the order of integration d(max) is determined, a levels VAR can then be estimated with a total of k+d(max) lags. In the second step Wald statistic is applied to the first k VAR coefficient matrix (but not all lagged coefficients) to make Granger causal inference.
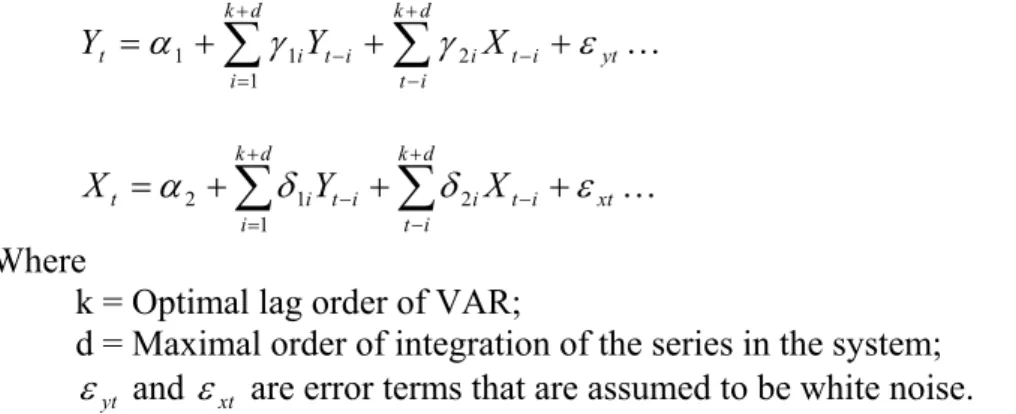
Toda and Yamamoto (1995) augmented Granger causality test by estimating a two equation system using the Seemingly Unrelated Regressions (SUR) technique. Rambaldi and Doran (1996) showed that the Wald test improves efficiency when SUR models are used in the estimation. So, the model can be specified as follows:
yt i t d k i t i i t d k i i
t Y X
Y =α + γ + γ − +ε
+ − − + =
∑
∑
2 1 11 … (7)
xt i t d k i t i i t d k i i
t Y X
X =α + δ + δ − +ε
+ − − + =
∑
∑
2 1 12 … (8)
Where
k = Optimal lag order of VAR;
d = Maximal order of integration of the series in the system;
yt
ε and εxt are error terms that are assumed to be white noise.
The results of Granger based Toda Yamamoto are given in the Table 11.
Table 11 Causality Results
Dependent variable
Independent
variable Chi-sq df Prob
lnTwt** lnCrt 7.2040 3 0.022
lnTrt* lnCrt 3.1907 3 0.075
lnSdt lnCrt 0.6245 3 0.890
lnFrt** lnCrt 9.5916 3 0.022
Source: author’s calculation.
Results in the Table 11 show that tubewells, and fertilizers have strong causality with credit at 5% and 10% level of significance, while tractor has causality at 10% level of significance. Tractors and tubewells both have also greater impact on agricultural output, therefore credit also play its indirect role to enhance agricultural output as it has strong causality with tubewells, fertilizers and tractor. While rests of the variables that have no causality were excluded from table in order to summarize it.
4. Conclusion
This study investigated the positive and significant role of credit when it is used indirectly. The study also shows that long run coefficient of cropped area is highly significant because the land is a basic input to agricultural sector. This shows as the intensity ratio of land increases it increases the output of this sector. The empirical results show in the Table 11 that directly credit has positive relation with agricultural output but has insignificant impact of credit on agricultural output and, practically, there is no sense of the direct use of credit. Credit always helps to buy various inputs for this sector, therefore it has indirect role.
The role of institutional credit is more important as it is a source of providing different agricultural inputs which has strong impact on productivity. Our study suggested that agricultural output is enhanced via three inputs tractors, tubewells, and seeds. While credit plays important role in providing tractors and tubewells to this sector. The study also shows that long run coefficient of cropped area is highly significant because the land is a basic input to agricultural sector. This shows as the intensity ratio of land increases it increases the output of this sector. The coefficients of labour and water are also highly significant and positive. These results are consistent with the previous studies.
5. Policy recommendations
On the basis of above study it can be concluded that agriculture credit itself cannot play any direct role in enhancing the output rather indirectly helps in the growth of this sector through buying various modern inputs. Therefore, following policies are suggested.
Credit is like a capital input but this is used indirectly in agriculture sector. Therefore, it is suggested to increase its supply when land, water labour is increased, there will be rising demand for the use of machinery, seeds and fertilizers which can only be bought by credit.
This is found that credit was given to either targeted groups or constraints for the poor farmers have been impediment in the way of its effective role. On these bases, study recommends to focus small farmers and to make easier conditions to avail credit from financial institutions.
The supervised credit schemes by financial institutions provided credit to the small farmers in limited quantity as it was discussed in under the head of credit disbursed by size of holding. Therefore subsidized credit should be given more to the small size holding.
To make the loan more productive special instructions and supervision should be carried out by loan issuing authorities.
As study found that tubewell and tractor play their important role in enhancing agricultural output, therefore special loans should given to the farmers to buy these inputs or it should be directly given to the farmers on easy installments.
For the sustainable growth of agricultural sector as it contributes major proportion in total GDP of Pakistan, the credit must be link with the supply of and its disbursement for agricultural inputs. Credit itself cannot affect productivity, rather through the provisions of modern inputs.
References
Afzal, M. (2005). Impact of Institutional credit on Agricultural output, unpublished mphil’s thesis G.C. University, Lahore, Pakistan
Ahmad, V., Rashid, A. (1984). The management of Pakistan’s economy, 1947-82, Karachi: Oxford University Press
Ali, S., “Total Factor Productivity Growth in Pakistan’s Agriculture 1960-1996”, The Pakistan Development Review, 43(4), 2004, pp. 493-513
Aqeel, A., Butt, M.S., “The Relationship between Energy Consumption and Economic Growth in Pakistan”, Asia Pacific DevelopmentJournal, 8(2), 2001, pp. 101-110
Aryeetey, E., “Rural Finance in Africa: Institutional Developments and Access to Poor”, Paper presented at Annual World Bank Conference on Development Economics, 1997, The World Bank
Basu, K. (1984). The Less Developed Economy: A Critique of Contemporary Theory (Indian ed.), Oxford Press, India
Basu, K. (2002). The Less Developed Economy: A Critique of Contemporary Theory(Indian ed.), Oxford Press, India
Carter, M.R., “The Impact of Credit on Peasant Productivity and Differentiation in Nicaragua”,
Journal of Development Economics 31, 1989, pp. 13-36
Chaudhry, M.G., Chaudhry, G.M., “Pakistan’s Agricultural Development Since Independence: Intertemporal Trends and Explanations”, The Pakistan Development Review, 36(4 Part-11 Winter 1997), 1997, pp. 419-466
Chaudhry, M.G., Hussain, “Mechanization and Agricultural Development in Pakistan”, The Pakistan Development Review, 25(4), 1986, pp. 431-450
Dickey, D.A., Fuller, W.A., “The likelihood Ratio Statistics for Autoregressive Time Series with a Unit Root”, Econometrica, 49, 1981, pp. 1057-1072
Dirk, J.B., “Credit Markets for Agriculture in the Czech Republic”, Journal of Europe- Asia Studies, 54(8), 2002, pp. 1301-1317
Ebrahim, A., “Agricultural Cooperatives in Gujarat, India: Agents of Equity or Differentiation?”, Development in Practice,10(2), 2000, pp. 178-188
Engel, R.F., Granger, C.W.J., “Cointegration, and Error Correction Representation, Estimation and Testing”, Econometrica, 55, 1987, pp. 251-276
Ghattak, S. (1981). Monetary Economics in Developing Countries, McMillain International College ed. London: McMillan Publishers
Ghate and Prabhu (1992). Informal Finance, Some Findings from Asia, London: Oxford University Press
Granger, C.W.J., Newbold, P., “Spurious Regression in Econometrics”, Journal of Econometrics, 2, 1974, pp. 111-120
Gurley, G.T., Shaw, S.E., “Financial Development and Economics Development”, Economic Development and Cultural Change, 15(3), 1967, pp. 257-265
Haq, M., Jameel, M.K. (1997). A Study of Formal Financial Institutions(Cooperative Credit). 324, Lahore: Punjab Economics Research Institute
Haris, R., Sollis. R. (2003). Applied Time Series Modeling and Forecasting, Wiley Publishers, West Sussex
Iqbal, M., Ahmed M., Abbas, “Impact of Institutional Credit on Agricultural Production of Pakistan”, The Pakistan Development Review, 42(4-II), 2004, pp. 469- 485
Johansen, S., Juselius, K., “Maximum Likelihood Estimation and Inference on Cointegration with Applictaion for the Demand for Money”, Oxford Bulletin of Economics and Statistics, 52, 1990, pp. 169-219
Kevane, M., “Qualitative Impact study of Credit with Education in Burkina Faso”, Paper No 3,
Conference of Freedom from Hunger, 1996, Santa Clara University
Khan, M.H., “The Structural Adjustment Process and Agricultural Change in Pakistan in the 1980s and 1990s”, The Pakistan Development Review, 33(4- II), 1994, pp. 533-591 Khan, M.H., “Agricultural Crisis in Pakistan: Some Explanation and Policy Options”, The
Pakistan Development Review, 36(1- I), 1997, pp. 419-466
Khan, R.A., “Some Operational Issues and Institutional Constraints in Lending to Small Farmers”, The Pakistan Development Review, 32(4-II), 1991, pp. 1029-1037
Khan, R.A. (1994). Farm Loan Recovery Problem in Pakistan: Its Possible Solutions. The Pakistan Development Review, 33(4- II), 1994, pp. 833-844
Khandeker, S., Farquee, R., “Impact of Farm Credit in Pakistan”, Paper presented at World Bank Policy Research, 2002, New York, USA
Khandeker, S., Farquee, R., “Financial Development and Economic Growth, Views and Agenda”, Journal of Economics Literature, 35(2), 2002, pp. 688-726
Malik, S.J., Mushtaq, M., Gill, M.A., “The Role of Institutional Credit in The Agricultural Development in Pakistan”, The PakistanDevelopment Review, 30(4-II), 1991, pp. 1039-1048
Malik, S.J., Hina N., “Rural Poverty and Credit Use, Evidence from Pakistan”, The Pakistan Development Review, 38(4-II), 1999, pp. 699-716
Malik, S.J., Mushtaq, M., Gill, M.A., “Differential Access and the Rural Credit Market in Pakistan, Some Recent Evidence”, The Pakistan Development Review, 28(4-II), 1989, pp. 687-716
Meier, G.M. (1984). Leading Issues in Economic Development, 4th Ed. NewYourk, Oxford University Press, Inc
Menakshi, R., Manojit, B., Vani. B.P., “Asymmetry in Information and Varying Rates of Interest”, The Journal of Applied Economics Research, 3(4), 2009, pp. 339-364
Meyer, R.L., Nagarajan, G. (2000). Rural Financial Markets in Asis, Policies, Paradigms and Performance, China: Asian Development Bank Publication, Oxford University Press China Ltd
Ministry of Finance Division (2008). Economic Survey of Pakistan, Federal Bureau of Statistics, Finance Division, Islamabad
Ministry of Finance Division (2009). Economic Survey of Pakistan, Federal Bureau of Statistics, Finance Division, Islamabad
Mpuga, P., “Demand for Credit in Rural Uganda, Who Cares for the Peasants?”, Conference on: Growth, Poverty Reduction and Human Development in Africa Center for the study of African Economies, 2004, Africa
Pakistan, Government of (2006). Statistical Year Book, Islamabad:Federal Bureau of Statistics, Statistics Division, Islamabad
Pesaran, H.M., Peraran B. (1987). Working with Microfit 4.0: InteractiveEconometric Analysis. Oxford: Oxford University Press
Pesaran, H.M., Smith, Shin, “Bonds testing Approaches to the Analysis of Level Relationships”, Journal of Applied Econometrics, 16(3), 2001, pp. 289-326
Phillips, P.C.B., Perron, P., “Testing for a Unit Root in Time Series Regression”, Biometrica, 75, 1988, pp. 335-446
Qureshi, A.S., Akhtar, M., Masih, I., Bilal, M., “Sustaining Groundwater Boom: Protecting Food Security and Small Holders Livelihoods in Punjab, Pakistan”, Second South Asia Water Forum, 2002, Dec 14-16, Islamabad, Pakistan
Qureshi, S.K., Akhtiar H.S., “A Critical Review of Rural Credit Policy in Pakistan”, The Pakistan Development Review, 31(4), 1992, pp. 781-801
Qureshi, S.K., “Credit for Rural Poor in Pakistan”, The Pakistan Development Review, 34(4), 1995, pp. 769-778
Quershi, S., Nabi, I., Farquee, R., “Rural Finance for Growth and Poverty Alleviation”, Policy Research Working Paper 1593, 1996, South Asia Country Department-1, Agricultural and Natural Resources Division World Bank
Rosenzweig, M.R., Wolpin, K.I., “Credit Market Constraint, Consumption Smoothing and Accumulation of Durable Production Assests in Low Income Countries: Investment in Bullocks in India”, The Journal ofPolitical Economy, 101(2), 1993, pp. 223-244
Sarwar, M., Sarwar, M., Khan, M.J., (1986). Evaluation of Cooperative Programme in Punjab
(Tech. Rep. No. 227), Lahore: Punjab Economic Research Institute
Schultz, T.W., “Noble Lecture: The Economics of Being Poor”, Journal of Political Economy,
88(4), 1980, pp. 639-651
Shahid, A., “Water and Energy Efficiency of Pumped Water System: Issues and Options”,
Seminar on Energy irrigation Nexus in Pakistan, 2003, International Water Management Institute, Lahore. Pakistan
Shearer, E., Cornheil, L. S., Mesbah, D. (1990). The Reform of Rural Land Markets in Latin America and the Caribbean: Research, Theory, and Policy Implications (Report No 141). Wisconsi, USA: Land Tenure Center, University of Wisconsin
Sidhu, R.S., Vatta, K., Kaur, A., “Dynamics of Institutional Credit and Growth in Punjab: Contribution and Demand Supply Gap”, Agricultural Economics Research Review,21, 2008, pp. 407-414
Timothy, B., “Non-Market Institutions for Credit Risk Sharing in Low Income Countries”,
Journal of Economic Perspectives, 9(3), 1995, pp. 103-114
Toda, H.Y., Yamamoto, T., “Statistical Inference in Vector Autoregressions with Possibly Integrated Processes”, Journal of Econometrics,66, 1995, pp. 225-250
Udry, Ch., “Credit Markets in Northern Nigeria: Credit as Insurance in a Rural Economy”,
World Bank Economic Review.4(3), 1990, pp. 251-269
Udry, Ch., “Risk and Insurance in a Rural Credit Market, An Empirical Investigation in Northern Nigeria”, The Review of Economic Studies. 61(3), 1994, pp. 495-526
Waqar, A., Amjad, R. (1984). The Management of Pakistan Economy, 1947-1982, Karachi: Oxford University Press, Inc
Waqar, H., Z., Sial, M.H., Ijaz, H., “Agricultural Credit Constraints and Borrowing Behaviour of Farmer in Rural Punjab”, European Journal of Scientific Research, 23(2), 2008, pp. 294-304
Zaidi, S.A. (2000). Issues in Pakistan Economy (ed 2nd), Karachi: Oxford University Press, Inc Zuberi, H.A., “Production Function, Institutional Credit and Agricultural Development in