BAR, Rio de Janeiro, v. 12, n. 2, art. 3, pp. 169-189, Apr./June 2015
http://dx.doi.org/10.1590/1807-7692bar2015140057
Moderating Effects of Sales Promotion Types
Fernando de Oliveira Santini
Escola Superior de Propaganda e Marketing – ESPM; Universidade do Vale do Rio dos Sinos – UNISINOS
Cláudio Hoffmann Sampaio
Pontifícia Universidade Católica do Rio Grande do Sul – PUCRS/FACE
Marcelo Gattermann Perin
Pontifícia Universidade Católica do Rio Grande do Sul – PUCRS/PPGAd
Lelis Balestrin Espartel
Pontifícia Universidade Católica do Rio Grande do Sul – PUCRS/PPGAd
Wagner Junior Ladeira
Universidade do Vale do Rio dos Sinos – UNISINOS
Received 5 October 2014; received in revised form 10 May 2015 (this paper has been with the author for two revisions); accepted 13 May 2015; published online 12 June 2015.
Abstract
This paper aims to analyze the influence sales promotion types have on the relationship between perception of financial risk and perception of utilitarian and hedonic value on consumer purchase intentions. To this end, an experiment was conducted involving 589 participants divided into two groups defined by distinct scenarios in which the sales promotion type (monetary vs. non-monetary) was manipulated. The working hypotheses predicted a direct and positive relationship between the perception of (hedonic and utilitarian) consumption value and purchase intention for a promoted product and a negative relationship between the perception of consumption value and the perception of financial risk. In addition, it was supposed that the sales promotion type would moderate these direct relationships and that a monetary promotion would have a stronger effect on the relationship between purchase intention and perceived product utility, whereas a non-monetary promotion would have a stronger effect on the other relationships (hedonic value and financial risk perceptions). Analysis of the outcomes supported the proposed hypotheses.
Introduction
Despite being widely used in the management sphere (Bertrand, 1998; Wierenga & Soethoudt, 2010), sales promotion has scarcely been explored in the academic field (Alvarez & Casielles, 2005; D’Astous & Landreville, 2003). In the business context, Silva (n.d.) indicated that $176 billion would be invested in such initiatives by the end of 2013, representing an increase of 33% in relation to 2011. Recently, the same organization projected investments of $24 billion in sales promotion activities only on social networks for 2015 (Paglia, 2010). This projection exceeds the forecast that advertisement will have investments of $14 billion. In the academic sphere, some gaps can be observed in the literature, especially regarding the analysis of moderators that may either enhance or minimize the impact of sales promotion on consumer behavior (Alvarez & Casielles, 2005; Freo, 2005; Low & Mohr, 2000). Therefore, inquiry into how sales promotion type results in different consumer responses becomes essential (Chandon, Wansink, & Laurent, 2000; Kwok & Uncles, 2005; Taylor & Neslin, 2005).
Aiming to reduce the aforementioned gap in the literature, this study proposes to examine the moderating effect of sales promotion type (monetary vs. non-monetary) on the relationship between perceived consumption value (hedonic and utilitarian), perceived financial risk and purchase intentions for a promoted product. To this end, an experimental study was conducted involving 589 consumers who were exposed to either monetary or non-monetary product sales promotions.
This study is expected to contribute to the literature in the following ways: (a) to stimulate discussion of the topic with a view of the scarce literature on the subject (Alvarez & Casielles, 2005; D’Astous & Landreville, 2003); (b) to deepen understanding of non-monetary sales promotion techniques, as they have been unsuccessful in relation to monetary promotions (Ailawadi, Beauchamp, Donthu, Gauri, & Shankar, 2009; Pacheco & Rahman, 2015; Reid, Thompson, Mavondo, & Brunsø,
2015); (c) to provide knowledge about consumer responses to two different sales promotion techniques (Ailawadi et al., 2009; Chandon et al., 2000; Kwok & Uncles, 2005; Taylor & Neslin, 2005); (d) to provide a better understanding of the relationship between sales promotion and purchase intention based on the inclusion of moderators (Chandon et al., 2000; Kwok & Uncles, 2005; Taylor & Neslin, 2005); and (e) to expand on the research of Chandon, Wansink and Laurent (2000) by including an independent variable (risk perception).
This study is structured as follows: the article proceeds by presenting the literature review and hypotheses in the next section. The subsequent section describes the methods used, followed by an analysis of the results and final considerations.
Literature Review and Working Hypotheses
Sales promotions are divided into two types: monetary promotions and non-monetary promotions. Monetary promotions are considered the best alternative for short-term increased sales, and these promotions play a key role in consumer choices (Alvarez & Casielles, 2005). This assumption is reinforced by Blattberg and Neslin (1990), who argued that this promotion type satisfies consumers’ desire for savings. Studies such as those of Davis, Inman and McAlister (1992) and Taylor and Neslin (2005) indicated that consumers always respond to monetary promotion campaigns, as this promotion type is based on a transactional incentive, which provides immediate rewards and utilitarian benefits (Chandon et al., 2000; Kwok & Uncles, 2005).
In general, sales promotions techniques, regardless of their type (monetary or non-monetary), constitute significant variables that influence consumers’ purchase intentions. Lee (2002), for instance, found that sales promotions are more effective than advertising in reaching company sales objectives. Nevertheless, studies conducted in the 1970s, such as Cotton and Babb (1978), and more recent studies such as Alvarez and Casielles (2005) have demonstrated the effectiveness of both monetary and non-monetary sales promotions in consumers’ responses and attitudes. For this reason, the following hypothesis is proposed:
H1: Sales promotions positively influence consumers’ purchase intentions.
In relation to the effects of promotions on consumers’ purchase intentions, the effect of monetary campaigns are believed to be even stronger. This assumption is made based on the results of studies such as Lee (2002), who found that sales campaigns focused on savings (monetary promotions) performed better than non-monetary promotions and that monetary promotions are preferred by consumers over non-monetary promotional actions. Gilbert and Jackaria (2002) found that discount promotions (monetary) have a greater influence on purchase decisions than do non-monetary promotions (e.g., prize contests). More recently, Nusair, Yoon, Naipaul and Parsa(2010) similarly found that discount promotions (monetary) were more effective than prize campaigns (non-monetary) when the purpose is to influence service acquisition. Given the above findings, the following hypothesis will be tested in this study:
H2: The effect of monetary sales promotions on consumers’ purchase intentions is stronger than that of non-monetary sales promotions.
Another assumption of the present research is that the type of sales promotion (monetary or non-monetary) influences the perceived value of the product offered.
Individuals’ motivation for consumption is generally connected with their attitudes toward brands and their utilitarian and/or hedonic nature (Crowley, Spangenberg, & Hughes, 1992; Voss, Spangenberg, & Grohmann, 2003). This fact is also considered in studies of sales promotions (Chandon et al., 2000; Kwok & Uncles, 2005; Park & Mowen, 2007; Shukla & Babin, 2013). Both the works of Chandon et al. (2000) and Kwok and Uncles (2005) have linked the benefits of hedonic and utilitarian value to sales promotions types (monetary and non-monetary).
Thus, it is believed that both types of promotional campaigns (monetary and non-monetary) will affect perceived value and, as consequence, intentions to purchase a promotional product.
H3: The utilitarian perception of the product influences, in a positive way, the product’s purchase intention on sales promotion.
H4: The hedonic perception of a product influences, in a positive way, the product’s purchase intention on sales promotion.
According to the referenced studies, monetary sales promotions foster the perception of three utilitarian benefits – savings, increased quantity and enhanced convenience – whereas non-monetary promotions improve hedonic value perceptions – such as entertainment, exploration and opportunities for value expression. Thus, it is suggested that monetary promotions are more suitable for products or services that have a rather utilitarian nature and that non-monetary promotions are better suited for hedonic products or services (Chandon et al., 2000; Kwok & Uncles, 2005).
(c) monetary promotions induce economic behaviors (Kwok & Uncles, 2005) and consequently relegate quality perceptions to second place (Martínez & Montaner, 2006), and such perceptions are associated with hedonic value perceptions (Chandon et al., 2000). Thus, the following is hypothesized:
H5: The type of sales promotion moderates the relationship between the utilitarian value perceptions and purchase intentions for a promoted product, with the perception of utilitarian value being stronger (weaker) for monetary (non-monetary) promotions.
In the sixth hypothesis, a moderating role of the sales promotion type in the relationship between hedonic product value perceptions and purchase intentions is expected. In this case, a stronger relationship is expected for consumers exposed to non-monetary promotion. This assumption is based on the following arguments: (a) consumers who are exposed to non-monetary campaigns are less sensitive to price (Ailawadi et al., 2009); (b) non-monetary promotions are effective in evoking long-term behaviors, such as those related to brand image (Aaker, 1991; Esteban-Bravo, Mugica, & Vidal-Sanz, 2009; Gupta, 1988); (c) non-monetary promotions stimulate exploration perceptions, self-expression and entertainment (Schindler, 1989), which are related to hedonic value perceptions (Chandon et al., 2000; Kwok & Uncles, 2005); and (d) non-monetary promotions are aligned with experiential purchase orientations, as demonstrated in the results of the recent research (Büttner, Florack, & Göritz, 2015). Based on these arguments, the following hypothesis is proposed:
H6: The type of sales promotion moderates the relationship between the hedonic value perceptions and purchase intentions for a promoted product, with hedonic value perceptions being stronger (weaker) for non-monetary (monetary) promotions.
Perceived risk has been proven to be an important construct in explaining consumer behavior, and its study has been widely discussed (Blackwell, Miniard, & Engel, 2005; Solomon, 2011). This issue has been debated not only in the field of marketing but also in psychology research (Dholakia, 2000; Mitchell, 1999). Dholakia (2000) generally defines perceived risk as a negative feeling that may emerge from the purchase of a product.
Studies such as those conducted by Hisrich, Dornoff and Kernan (1972) and Choi and Lee (2003) have shown that the perception of risk affects a consumer’s propensity to make a buying decision. In this sense, when consumers perceive risks, they assess those risks before making a decision (Weegels & Kanis, 2000). These authors also emphasized that the perception of risk is greater under unusual situations because the lack of prior knowledge is influenced by a number of factors that strengthen the perception of risk (Weegels & Kanis, 2000).
One dimension of perceived risk is financial risk, which occurs when a consumer perceives a risk of possible monetary loss when buying a product (Dholakia, 2000). Such a loss could be related to the depreciation of a product or to potential expenses related to repairs and maintenance (Mitchell, 1999), and it is a major dimension involved in determining risk perceptions (Agarwal & Teas, 2001; Ofir & Bechtel, 1990).
Simon and Victor (1994) claimed that sales promotion techniques are effective alternatives for reducing consumer perceptions of risk. This connection is even clearer in the study by Garretson, Burton and Clow (1999), who tested and confirmed the hypothesis proposing the use of discount coupons (monetary promotion) for reducing perceived risk associated with service consumption. However, this same study demonstrated that discount promotions have a negative effect on perceived service quality. Santini (2013) tested, among other factors, the direct effect of perceived financial risk on the intention to purchase a discount product (monetary promotion). The study confirmed the assumption of a negative relationship between these two variables. Hence, the following relationship is expected:
H7: Sales promotions negatively influence the relationship between the financial risk perception of a product and consumer purchase intentions.
utilitarian aspects presumably involved in a monetary promotion (Chandon et al., 2000; Kwok & Uncles, 2005). Non-monetary promotions, as already mentioned, do not change basic product prices and are thus expected to have a less harmful effect on the relationship between perceived financial risk and purchase intentions, as their effect is related to non-functional benefits.
In addition, unlike monetary promotions that encourage perception of the economic benefits of a promoted product or service (Ailawadi et al., 2009), non-monetary campaigns evoke perceptions of quality (Chandon et al., 2000; Martínez & Montaner, 2006). This characteristic aims to combat negative risk perceptions (Apaydin & Koksal, 2011; Shimp & Bearden, 1982). Thus, the following hypothesis is proposed:
H8: The type of sales promotion moderates the relationship between the risk perception and purchase intention of the promoted product, with the perception of risk being stronger (weaker) for monetary (non-monetary) promotions.
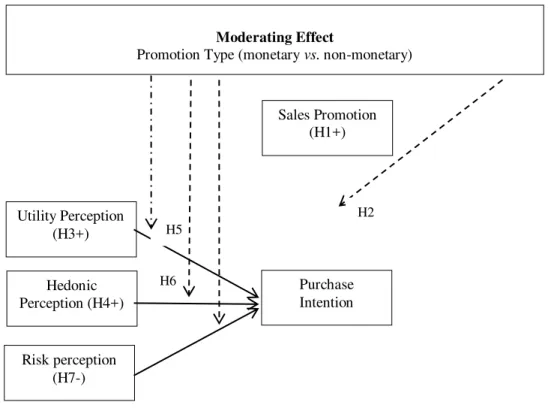
Figure 1 shows the antecedents of purchase intentions and the moderating role of promotion type interacting with the direct hypothesized relationships.
Figure 1. Proposed Conceptual Model
Method
Based on the proposed hypotheses, an experimental research design was chosen and was preceded by an exploratory and descriptive step aimed at defining the product, the discount (monetary promotion) and the awards (non-monetary promotion) to be used in the experimental stage.
Utility Perception (H3+)
Hedonic Perception (H4+)
Risk perception (H7-)
Purchase Intention Sales Promotion
(H1+)
Moderating Effect
Promotion Type (monetary vs. non-monetary)
H5
H6
Exploratory and descriptive stages
In the exploratory stage, data were collected from a secondary source, Groupon, a collective buying site whose products and offered discounts were analyzed over a period of 15 days. From this analysis, it was possible to identify the most common products and the average discounts offered on that group buying site. In the same period, in addition to the referenced site, the most frequent awards granted in prize contests promoted by the Brazilian retail market were surveyed based on information obtained from the National Operations Department of Commercial Promotions, an agency of the Brazilian Federal Savings Bank responsible for the supervision of such promotions.
After identifying the products, discounts and prizes that are most common in the market, this study conducted descriptive research that culminated in the selection of the product that was found to be the most familiar and realistic from the view of the study participants, which is essential to ensure both the internal and external validity of a laboratory experiment (Wilson, Aronson, & Carlsmith,2010).
For application in the descriptive stage, six different products were selected and applied individually by means of research instruments with response scales for the following factors: (a) interest in the product (Bruner & Hensel, 1998), (b) hedonic or utilitarian value perceptions (Voss et al., 2003), and (c) financial risk (Stone & Grønhaug, 1993). The questionnaires were administered to 182 business management students at a higher education institution located in southern Brazil.
This research aimed to analyze a single product from the perspective of the feelings that the interviewees associated with the product. For this reason, rather than considering the concepts involved in the research (value and risk perceptions) from the product perspective, we aimed to address them from the perspective of interviewed consumers. Accordingly, products that could generate extreme behaviors were excluded, as such behaviors could affect the results of the survey; for example, a product with a high perceived financial risk would tend to be associated with weaker purchase intentions regardless of whether a sales promotion was applied (Chanvarasuth, Sarin, & Sego, 2002; Teimoury, Fesharaki, & Bazyar, 2010).
The selection of the product used in the experimental stage was based on observations of behaviors that are least related to the constructs (purchase intentions, hedonic and utilitarian value perceptions, and financial risk) by analyzing the mean and the variation in participants’ responses to each behavior on the basis of standard deviations. Such an analysis identified the netbook as the product that showed the greatest variation in behaviors (purchase intentions, hedonic and utilitarian value perceptions, and financial risk). After the product to be used in the research was identified, the average discount offered for this product by the collective buying site was calculated. This information was obtained during the exploratory stage, as described above. This assessment showed an average discount of 37%, which was used in the monetary promotion experimental scenario. With this same purpose, the campaigns of prize contests authorized by the National Operations Department of Commercial Promotions were examined, revealing the predominance of contests to win brand new cars. Thus, this good was used in manipulating non-monetary sales promotion scenarios.
Experimental stage
The present study was characterized as a laboratory experiment in which two variables were manipulated – the presence of a sales promotion (with or without) and the type of promotion (monetary, discount; non-monetary, prize contests). A within-subjects design was used to analyze the presence of sales promotions, whereas the type of promotion was examined using a between-subjects design.
Once completed, the questionnaires were collected, and the participants received an advertisement for the same product again with the same features, but in this case, a price discount promotion was included (a monetary promotion). For the non-monetary promotion scenario, the participants received an advertisement for the same product showing the same characteristics and price, but this case featured a prize promotion indicating that those who purchased the product could win a brand new car. In addition to this information, the respondents’ purchase intentions, hedonic and utilitarian value perceptions, and financial risk perceptions were measured using the scales mentioned above.
Data collection
The study sample included 600 students selected by quota sampling. It is worth noting that samples of students are recommended when testing the application of a theory in which the homogeneity of respondents is essential (Calder, Philips, & Tybout, 1981). The data were collected in September and October of 2013 in a Higher Education Institute located in Rio Grande do Sul. Only business administration students participated in the research.
Research instrument
The survey instrument was composed of the following constructs: (a) the intention to purchase the product (both with and without a sales promotion) measured using a five-item scale (Bruner & Hensel, 1998), (b) perceptions of the hedonic (five items) and utilitarian (three items) value of the product (adapted from Voss et al., 2003) and (c) the perceived financial risk (three items) of the promoted product (Stone & Grønhaug, 1993). In the Appendix A you will find all the items of the scale used in the study, the average rates, standard deviations, factor loadings and reliability (simple and composite) and in the Appendix B the correlation matrix.
Strange variable control
To control for extraneous variables, none of the offered products were associated with a brand. This measure aimed to avoid the influence of this variable on the participants’ purchase intentions given that previous studies have reported such a relationship (Aaker, Kumar, & Day, 1998; Keller & Lehmann, 2006). The researcher’s personal supervision of the administration of questionnaires helped to control for interactions among respondents, which could be a variable that would interfere with the results. Another major variable that was controlled because of the artificiality of the experiment was the financial resources available to participants, as this variable is an important element of increased purchase incidence (Hausman, 2000; Iyer, 1989). Possible sociodemographic influences on the research results were also controlled, such as income, sex and age, because the use of student samples in this type of study allows for homogeneous samples and enhanced internal validity of the experiment (Peterson, 2001).
Results
Table 1
Descriptive Analysis of Sample
Gender Valid Percentage (%) Frequency
Female 58.07 341
Male 41.93 239
Income* Valid Percentage (%) Frequency
Up to R$1.000 18.04 106
From R$1.001 to R$3.000 56.4 325
From R$3.001 to R$5.000 14.9 86
From R$5.001 to R$10.000 5.7 33
Above R$10.000 4.3 25
Age Valid Percentage (%) Frequency
19 to 25 years 47.4 274
26 to 35 years 38.4 222
36 to 45 years 11.6 67
Over 45 years 2.6 15
Note. Source: The authors’ data obtained in this research. * At the time of data collection $1.00 was R$2.23.
Sales promotions and purchase intentions
First, we evaluated the experiment manipulation check. Two variables were manipulated: sales promotion (with or without) and type of sales promotion (monetary vs. non-monetary). Participants were asked if they had noticed differences between the first questionnaire (without promotion) and the second (monetary or non-monetary promotion). Respondents from non-monetary promotion scenarios mentioned that the distribution of the prizes was the discrepant element. Respondents from monetary scenario mentioned that the discount was the discrepant element.
After the manipulation check was confirmed, the first hypothesis predicted that the sales promotion techniques would positively influence consumer purchase intentions and that the discount promotion (monetary) technique would more strongly influence this behavior than the prize promotion (non-monetary) technique.
Figure 2. Analysis of Sales Promotions on Consumer Purchase Intentions
First, the results indicate that regardless of the type of sales promotion (monetary or non-monetary), these promotions affected consumers’ purchase intentions (mean without promotion = 3.01, SD = 1.18, mean with promotion = 3.38, SD = 1.24, t = -9.346; p <0.001). The results also show that the monetary promotion had a stronger influence on consumer purchase intentions than non-monetary sales promotion (mean monetary promotion = 3.61; SD = 1.26; confidence interval = 3.475 to 3.747; mean non-monetary promotion = 3.15; SD = 1.19; confidence interval = 3.013 to 3.305; F = 5.082; p <0.001), thus confirming H1 and H2. We emphasize that this analysis was conducted using GLM Anova and included gender and age covariates to determine whether they influence the behavior of the effect of sales promotion type on consumer purchase intentions. The results demonstrate that the covariates mentioned did not influence the results, given that their inclusion did not induce a change in behavior (gender: F = 3.406; p= 0.065; income: F= 0.616; p= 0.521; age: F = 2.523; p = 0.113).
This result is consistent with the findings of previous studies demonstrating a positive effect of sales promotions on consumer behavior (Alvarez & Casielles, 2005; Gupta, 1988), and it reinforces the theoretical assumption that sales promotions are a key strategy for influencing consumer buying behavior (Blattberg & Neslin, 1990), stimulating demand and encouraging brand switching (Davis, Inman, & McAlister, 1992; Gupta, 1988).
Moderating effects of promotion type and the relationship among consumption value,
perceived financial risk and purchase intentions
The parameters of the equation model presented appropriate indices: chi-square = 322.489; degrees of freedom = 101; probability level = 0.001; chi-square/degrees of freedom = 3.19; CFI = 0.967; NFI = 0.953; and RMSEA = 0.061.
Multigroup structural equation modeling was used to analyze the hypotheses predicting moderating effects. This approach allows for categorizing a variable (nominal or ordinal) into two or more groups to form a moderator hypothesis (Krull & MacKinnon, 2001). In the present case, the moderator hypothesis suggests a difference in the intention of paths between the established constructs, given the level of intensity related to the type of sales promotion. Promotion type (monetary and non-monetary) was manipulated by applying distinct scenarios in which one group was exposed to a discount (monetary) promotion and the other to a prize (non-monetary) promotion.
After the groups were separated, to test the moderating effect of promotion type, the parameters were simultaneously estimated for each group.
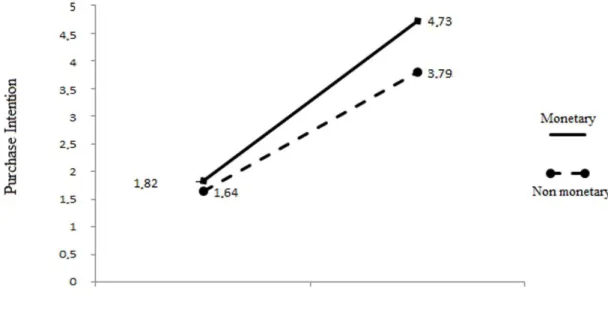
and Uncles (2005), who suggested that sales promotions can be viewed through the lens of visible (extrinsic) utilitarian benefits. Figure 3 shows the findings of the H5 tests.
Figure 3. Moderation in H5
Figure 3 indicates that the slope is greater for the monetary promotion (β = 0.712; p <0.001; confidence interval = 0.621 to 0.787) than for the non-monetary promotion (β = 0.310; p <0.001); i.e., the expected effect is observed. It should be noted that the chi-square indicator referring to the significant difference between models was significant (χ2
= 28.260; p <0.001; confidence interval = 0.186 to 0.409), which confirms H5.Considering that monetary promotions are related to price and, accordingly, to a visible and practical benefit, one could state that this relationship is associated with the utilitarian rather than hedonic aspects of the product. This assumption is reinforced when we consider the claims by Hirschman and Holbrook (1982) and Ailawadi, Beauchamp, Donthu, Gauri and Shankar (2009) that the price, which is fully linked to the discount (monetary) promotion, provides a utilitarian benefit composed of the instrumental, functional and cognitive features that generate a consumer response.
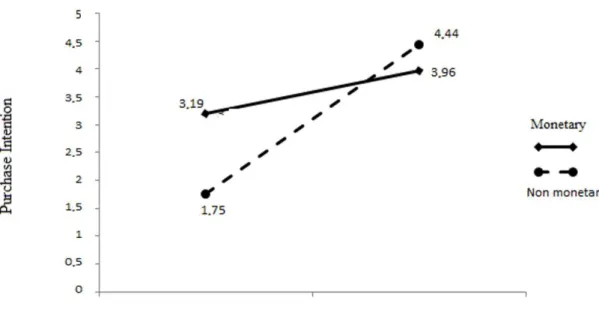
Figure 4. Moderation in H6
Figure 4 shows that the slope was positive and significant for the non-monetary sales promotion (β = 0.550; p <0.001; confidence interval = 0.457 to 0.653) and not significant for monetary promotion; i.e., the indices support H6, as there was a significant difference between the models (χ2
= 32.061; p<0.001). The results again support the assumptions of Chandon et al. (2000) and Kwok and Uncles (2005) that linked hedonic and utilitarian values to sales promotion type (monetary and non-monetary). This finding was evidenced by the confirmation of H6.
The hedonic value dimension is linked to the emotional and experiential aspects, such that hedonic goods are appreciated without consideration of their practical aspects (Chandon et al., 2000). Considering that the monetary promotion is highly connected to price and, consequently, to a visible and practical benefit of the product, this type of promotion is related to utilitarian rather than hedonic aspects of the product. Instead, hedonic perceptions are more strongly related to non-monetary (prize contest) promotions. Hence, sales promotion technique generates the perception of exploration and self-expression (Schindler, 1989). Research conducted by Büttner, Florack and Göritz (2015) showed that consumers with experiential shopping guidelines choose non-monetary campaigns when compared to task-focused consumers.
Thus, the discount promotion associated with the perception of hedonic value generates a state of discomfort in the consumer, leading to an increased sense of prudence (Davidoff, 1983) and negatively affecting the hedonic features. Conversely, non-monetary sales promotion, which adds value rather than decreasing value, is successful by offering a benefit such as a free gift or the possibility of winning a prize (Apaydin & Koksal, 2011; Shimp & Bearden, 1982), raising the purchase stimulus through the sense of entertainment (Chandon et al., 2000), a characteristic associated with hedonic perception (Voss
et al., 2003).
a product may facilitate and increase its appeal to a variety of social groups and classes. This is reduced in monetary sales promotions since the benefits offered don’t have direct benefits on the price (Alvarez & Casielles, 2005; Büttner et al., 2015).
H7 and H8 proposed a direct and negative effect from sales promotions on the relationship between the risk perception and purchase intention of the promoted product and a moderating effect from the type of sales promotion on the relationship between risk perception and purchase intentions, with monetary promotions having a stronger effect on risk perceptions. The direct relationship of these constructs was negative and significant.
The findings support H7 (β = -0.149; p <0.001), reinforcing previous observations that this perception is negatively associated with consumer purchase intentions. Similarly, the fear of monetary loss linked to the perception of financial risk is reinforced, even under the effects of sales promotions (Dholakia, 2000; Huang,Schrank, & Dubinsky, 2004).
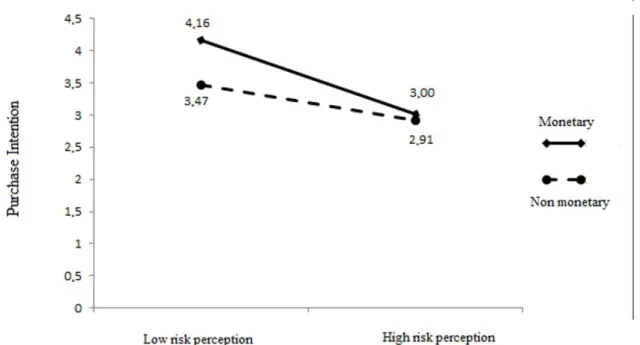
Finally, Figure 5 presents the testing of H8, which predicted a more positive relationship between perceived financial risk and consumer purchase intentions for non-monetary promotions.
Figure 5. Moderation in H8
A significant and negative relationship between financial risk and purchase intention was observed for the group exposed to a monetary promotion (β = 0.158; p = 0.36; confidence interval = -0.264 to -0.068), whereas the relationship was not significant for the group exposed to a non-monetary promotion (β = -0.028; p >0.05; confidence interval = -0.117 to 0.047). It is worth noting that there was a significant difference between the groups (χ2
= 4.395; p<0.05), thus confirming what was suggested in H8.
Final Remarks
The present study aimed to analyze consumer behavior in relation to sales promotions by examining the positive or negative relationships that could explain such behavior and by evaluating the moderating effect of promotion type (either monetary or non-monetary) on this process.
In the academic sphere, this study offers a contribution from at least three perspectives. First, the literature on sales promotions seeks works investigating moderators that may either enhance or minimize the impact of these promotions on consumer behavior (Alvarez & Casielles, 2005; Low & Mohr, 2000). Second, there is an academic demand to examine marketing actions that may be positively related to hedonic and utilitarian product value perceptions (Alzate & Guilhermo, 2003; Hightower, Brady, & Baker, 2002). Third, this study contributes to filling the gaps in the literature requiring analyses of the potential effects on the perception of risk associated with a product or service (Garretson, Burton, & Clow, 1999; Simon & Victor, 1994).
For the business context, the findings point to important guidelines for business managers. (a) The results show that sales promotions, especially monetary promotions, can be a key element in inducing the sales of stocked products as well as a tool for differentiation among highly competitive product categories (Jones, 2008). Thus, managers can consider the use of this promotional tool for encouraging consumers to try new products (Nbudisi & Moi, 2005), increasing the purchase of promoted goods (Cotton & Babb, 1978) and boosting short-term sales volume (Blattberg & Neslin, 1990). (b) The results indicate that a monetary promotion is more suitable for products that carry utilitarian value because this type of promotion establishes consistent linkages between the product and offer (Chandon et al., 2000; Kwok & Uncles, 2005), thus enhancing the effectiveness of this promotional tool in increasing product sales. (c) Non-monetary promotions are more appropriate for products with hedonic value. Therefore, we suggest that for products carrying largely hedonic attributes, monetary promotions should be avoided while non-monetary actions are encouraged. Another interesting assumption is linked to the use of this tool to launch new products, given that this feeling is related to hedonic value perceptions (Kim, 2008; Venkatraman & Price, 1990), and the findings revealed a positive relationship between this perception and the intention to purchase a promoted product. (d) Non-monetary promotions are more effective for reducing the perception of financial risk; i.e., discount promotions are not the most appropriate tools for encouraging the purchase of a product that evokes the perception of financial risk. It is emphasized that such an initiative should be considered based on the assessment of other variables related to the segment in which a company operates and the level of competitiveness of the product category, in addition to the profile of consumers served.
References
Aaker, D. A. (1991). Managing brand equity: capitalizing on the value of a brand name. New York: The Free Press.
Aaker, D. A., Kumar, V., & Day, G. (1998). Marketing research. New York: Wiley & Sons.
Agarwal, S., & Teas, R. K. (2001). Perceived value: mediating role of perceived risk. Journal of
Marketing Theory and Practice, 9(4), 1-14.
Ailawadi, K. L., Beauchamp, J. P., Donthu, N., Gauri, D. K., & Shankar, V. (2009). Communication and promotion decisions in retailing: a review and directions for future research. Journal of Retailing, 85(1), 42-55. doi: 10.1016/j.jretai.2008.11.002
Alvarez, B. A., & Casielles, R. V. (2005). Consumer evaluations of sales promotion: the effect on brand choice. European Journal of Marketing, 39(1/2), 54-70. doi: 10.1108/03090560510572016
Alzate, W., & Guilhermo, G. A. (2003). The influence of positive reinforcement and discriminative
stimuli on impulsive buying behavior: a behavioural perspective model (Doctoral dissertation).
The University of Guelph, Ontario, Canada.
Apaydin, F., & Köksal, M. E. (2011). Turkish consumers´ risk perception towards global computer brands. International Journal of Marketing Studies, 3(3), 165-173. doi: 10.5539/ijms.v3n3p165
Arnold, M. J., & Reynolds, K. E. (2003). Hedonic shopping motivations. Journal of Retailing, 79(2), 77-95.doi: 10.1016/S0022-4359(03)00007-1
Bertrand, K. (1998). Premiums prime the market. Advertising Age´s Business Marketing, 83(5), 6-11.
Blackwell, R. D., Miniard, P. W., & Engel, J. F. (2005). Comportamento do consumidor. São Paulo: Pioneira Thomson Learning.
Blattberg, R. C., & Neslin, S. (1990). Sales promotion concepts, methods, and strategies. New Jersey: Prentice-Hall.
Bruner, G. C., & Hensel, P. J. (1998). Marketing scales handbook: a compilation of multi-items
measures (Vol. 2). Chicago: American Marketing Association.
Büttner, O. B., Florack, A., & Göritz, A. S. (2015). How shopping orientation influences the effectiveness of monetary and nonmonetary promotions. European Journal of Marketing, 49(1/2), 170-189. doi: 10.1108/EJM-01-2012-0044
Calder, B. J., Philips, L. W., & Tybout, A. M. (1981). Designing research for application. Journal of
Consumer Research, 8(2), 197-207.
Chandon, P., Wansink, B., & Laurent, G. (2000). A benefit congruency framework of sales promotion effectiveness. Journal of Marketing, 64(4), 65-81.
Chanvarasuth, N., Sarin, S., & Sego, T. (2002, February). Strategic use of bundling for marketing new high-tech products: strategies for reducing consumers’ risk perception. Proceedings of AMA
Winter Educators' Conference, Austin, Texas, USA.
Choi, J., & Lee, K. H. (2003). Risk perception and e-shopping: a cross-cultural study. Journal of Fashion
Marketing and Management, 7(1), 49-64. doi: 10.1108/13612020310464368
Cotton, B. C., & Babb, E. M. (1978). Consumer response to promotion deals. Journal of Marketing,
Crowley, A. E., Spangenberg, E. R., & Hughes, K. R. (1992). Measuring the hedonic and utilitarian dimensions of attitudes toward product categories. Marketing Letters, 3(3), 239-249. doi: 10.1007/BF00994132
D´Astous, A., & Landreville, L. (2003). An experimental investigation of factors affecting consumers' perceptions of sales promotions. European Journal of Marketing, 37(11/12), 1746-1761. doi: 10.1108/03090560310495447
Davidoff, L. F. (1983). Introdução a psicologia. São Paulo: McGraw-Hill do Brasil.
Davis, S., Inman, J. J., & McAlister, L. (1992). Promotion has a negative effect on brand evaluations: or does it? Additional disconfirming evidence. Journal of Marketing Research, 29(1), 143-148. doi: 10.2307/3172499
Dhar, R., & Wertenbroch, K. (2000). Customer choice between hedonic and utilitarian goods. Journal
of Marketing Research, 37(1), 60-71. doi: 10.1509/jmkr.37.1.60.18718
Dholakia, U. M. (2000). Temptation and resistance: an integrated model of consumption impulse formation and enactment. Psychology & Marketing, 17(11), 955-982. doi: 10.1002/1520-6793(200011)17:11<955::AID-MAR3>3.0.CO;2-J
Esteban-Bravo, M., Mugica, J. M., & Vidal-Sanz, J. (2009). Magazine sales promotion. Journal of
Advertising, 38(1), 137-146.
Freo, M. (2005). The impact of sales promotions on store performance: a structural vector autoregressive approach. Statistical Methods and Applications, 14(2), 271-281. doi: 10.1007/s10260-005-0114-x
Garretson, J. A., Burton, S., & Clow, K. E. (1999). The influence of coupon face value on service quality expectations, risk perceptions and purchase intentions in the dental industry. The Journal of
Services Marketing, 13(1), 59-72. doi: 10.1108/08876049910256122
Gilbert, D. C., & Jackaria, N. (2002). The efficacy of sales promotions in UK supermarkets: a consumer view. International Journal of Retail & Distribution Management, 30(6), 315-322. doi: 10.1108/09590550210429522
Gupta, S. (1988). Impact of sales promotions on when, what, and how much to buy. Journal of
Marketing Research, 25(4), 342-355.
Hausman, A. (2000). A multi-method investigation of consumer motivations in impulse buying behavior.
Journal of Consumer Marketing, 17(5) 403-419. doi: 10.1108/07363760010341045
Hightower, R., Brady, M. K., & Baker, T. L. (2002). Investigating the role of the physical environment in hedonic service consumption: an exploratory study of sporting events. Journal of Business
Research, 55(9) 697-707.
doi:
10.1016/S0148-2963(00)00211-3Hirschman, E. C., & Holbrook, M. B. (1982). Hedonic consumption: emerging concepts, methods and propositions. Journal of Marketing, 46(3), 92-107. doi: 10.2307/1251707
Hisrich, R., Dornoff, R. J., & Kernan, J. B. (1972). Perceived risk in store selection. Journal of
Marketing Research, 9(4), 435-439. doi: 10.2307/3149311
Huang, W. Y., Schrank, H., & Dubinsky, A. J. (2004). Effect of brand name on consumers’ risk perceptions of online shopping. Journal of Consumer Behaviour, 4(1), 40-50. doi: 10.1002/cb.156
Jacoby, J., & Kaplan, L. B. (1972). The components of perceived risk. Proceedings of the Third Annual
Conference of the Association for Consumer Research, Chicago, IL, USA, 3.
Jones, J. M. (2008). An exploratory study on attitude persistence using sales promotion. Journal of
Managerial Issues, 20(3), 401-416.
Keller, K. L., & Lehmann, D. R. (2006). Brands and branding: research findings and future priorities.
Marketing Science, 25(6), 740-759.
Kim, Y.-H. (2008). An empirical examination of consumers innovation adoption: the role of innovativeness, fashion orientation, and utilitarian and hedonic consumers attitudes (Master`s thesis). University of North Carolina, Greensboro, USA. Retrieved from http://libres.uncg.edu/ir/uncg/f/KIM_uncg_0154M_10046.pdf
Krull, J. L., & Mckinnon, D. P. (2001). Multilevel modelling of individual and group level mediated
effects. Multivariate Behavioral Research, 36(2), 249-277. doi:
10.1207/S15327906MBR3602_06
Kwok, S., & Uncles, M. (2005). Sales promotion effectiveness: the impact of consumer differences at an ethnic-group level. The Journal of Product & Brand Management, 14(3), 170-186. doi: 10.1108/10610420510601049
Laroche, M., Pons, F., Zgolli, N., Cervellon, M. C., & Kim, C. (2003). A model of consumer response to two retail sales promotion techniques. Journal of Business Research, 56(7), 513-522. doi: 10.1016/S0148-2963(01)00249-1
Lee, C. W. (2002). Sales promotions as strategic communication: the case of Singapore. Journal of
Product and Brand Management, 11(2), 103-114. doi: 10.1108/10610420210423473
Low, G. S., & Mohr, J. J. (2000). Advertising vs sales promotion: a brand management perspective.
Journal of Product and Brand Management, 9(6), 389-414. doi: 10.1108/10610420010356984
Martínez, E., & Montaner, T. (2006). The effect of consumer's psychographic variables upon deal-proneness. Journal of Retailing and Consumer Services, 13(3), 157-168. doi:10.1016/j.jretconser.2005.08.001
Mitchell, V.-W. (1999). Consumer perceived risk: conceptualizations and models. European Journal of
Marketing, 33(1/2), 163-195. doi: 10.1108/03090569910249229
Nbudisi, N. O., & Moi, C. T. (2005). Customers behavioural responses to sales promotion: the role of fear of losing face. Asia Pacific Journal of Marketing and Logistics, 17(1), 32-49. doi: 10.1108/13555850510672278
Nusair, K., Yoon, H. J., Naipaul, S., & Parsa, H. G. (2010). Effect of price discount frames and levels on consumers' perceptions in low-end service industries. International Journal of Contemporary
Hospitality Management, 22(6), 814-835.doi: 10.1108/09596111011063106
Ofir, C., & Bechtel, G. G. (1990). Scaling and dimensionalizing perceived risk from ratings data: managers´ risk perception of business computers. Marketing Letters, 1(2), 171-179. doi: 10.1007/BF00435300
Pacheco, B. G., & Rahman, A. (2015). Effects of sales promotion type and promotion depth on consumer perceptions: the moderating role of retailer reputation. The International Review of Retail,
Distribution and Consumer Research, 25(1), 72-86. doi: 10.1080/09593969.2014.918047
Park, S., & Mowen, J. C. (2007). Replacement purchase decisions: on the effects of trade‐ins, hedonic versus utilitarian usage goal, and tightwadism. Journal of Consumer Behaviour, 6(2/3), 123-131. doi: 10.1002/cb.212
Peterson, R. (2001). On the use of college students in social science and research: insights from a second-order meta-analysis. Journal of Consumer Research, 28(3), 450-461.
Ramanathan, S., & Menon, G. (2006). Time-varying effects of chronic hedonic goals on impulsive behavior. Journal of Marketing Research, 43(4), 628-641. doi: 10.1509/jmkr.43.4.628
Reid, M., Thompson, P., Mavondo, F., & Brunsø, K. (2015). Economic and utilitarian benefits of monetary versus non-monetary in-store sales promotions. Journal of Marketing Management,
31(3/4), 247-268. doi: 10.1080/0267257X.2014.939216
Santini, F. O. (2013). Uma análise da influência da promoção de vendas de desconto na intenção de
compra do consumidor e os efeitos moderadores da atratividade (Tese de doutorado). Pontifícia
Universidade do Rio Grande do Sul, Porto Alegre, RS, Brasil.
Schindler, R. M. (1989). The excitement of getting a bargain: some hypotheses concerning the origins and effects of smart-shopper feelings. Advances in Consumer Research, 16(1), 447-453.
Shimp, T. A., & Bearden, W. O. (1982). Warranty and other extrinsic cue effects on consumers' risk perceptions. Journal of Consumer Research, 9(1), 38-46.
Shukla, P., & Babin, B. J. (2013). Effects of consumer psychographics and store characteristics in influencing shopping value and store switching. Journal of Consumer Behaviour, 12(3), 194-203. doi: 10.1002/cb.1411
Silva, C. (n.d.). Investimento em promoções superam gastos com anúncios locais. Tigre Net Marketing e Negócios Online. Recuperado de http://tigrenet.com.br/investimento-em-promocoes-superam-gastos-com-anuncios/
Simon, S. M. H., & Victor, T. F. N. (1994). Customers´ risk perceptions of electronic payment systems.
International Journal of Bank Marketing, 12(8), 26-38. doi: 10.1108/02652329410069029
Solomon, M. R. (2011). O comportamento do consumidor. São Paulo: Bookmann.
Spangenberg, E. R., Voss, K. E., & Crowley, A. E. (1997). Measuring the hedonic and utilitarian dimensions of attitude: a generally applicable scale. Advances in Consumer Research, 24(1), 235-241.
Stone, R. N., & Grønhaug, K. (1993). Perceived risk: further considerations for the marketing discipline.
European Journal of Marketing, 27(3), 39-50. doi: 10.1108/03090569310026637
Taylor, G. A., & Neslin, S. A. (2005). The current and future sales impact of a retail frequency reward program. Journal of Retailing, 81(4), 293-305. doi: 10.1016/j.jretai.2004.11.004
Teimoury, E., Fesharaki, M., & Bazyar, A. (2010). The relationship between mediated power asymmetry, relational risk perception, and governance mechanism in new product development relationships.
Journal of Research in Interactive Marketing, 4(4), 296-315. doi: 10.1108/17505931011092817
Venkatraman, M. P., & Price, L. P. (1990). Differentiating between cognitive and sensory innovativeness: concepts, measurement and their implications. Journal of Business Research, 20(4), 293-315. doi: 10.1016/0148-2963(90)90008-2
Weegels, M. F., & Kanis, H. (2000). Risk perception in consumer product use. Accident Analysis &
Prevention, 32(3), 365-370. doi: 10.1016/S0001-4575(99)00093-7
Wierenga, B., & Soethoudt, H. (2010). Sales promotions and channel coordination. Journal of the
Academy of Marketing Science, 38(3), 383-397. doi: 10.1007/s11747-009-0161-1
Wilson, T. D., Aronson, E., & Carlsmith, K. (2010). The art of laboratory experiment. In S. T. Fiske, D. T. Gilbert, & G. Lindzey (Eds.), Handbook of social psychology (Chapter 2, pp. 51-81). doi: 10.1002/9780470561119.socpsy001002
Authors’ Profile
s
Fernando de Oliveira Santini
Rua Guilherme Schell, 350, 90640-040, Porto Alegre, RS, Brazil. E-mail address: [email protected]
Cláudio Hoffmann Sampaio
Av. Ipiranga, 6681, Prédio 50, 90619-900, Porto Alegre, RS, Brazil. E-mail address: [email protected]
Marcelo Gattermann Perin
Av. Ipiranga, 6681, 90619-900, Porto Alegre, RS, Brazil. E-mail address: [email protected]
Lelis Balestrin Espartel
Av. Ipiranga, 6681, 90619-900, Porto Alegre, RS, Brazil. E-mail address: [email protected]
Wagner Junior Ladeira
APPENDIX A
Items of the Scales, Averages, Standard Deviation, Factorial Loads, Levels of Simple
Reliability (Alpha) and Composite Reliability
Variables Avg Standard deviation Purchase intention (without promotion) Purchase intention (with discount) Hedonic perception Utilitarian perception Risk perception
Unlikely – Likely 2.96 1.36 .796
Non-existent – Existent 3.02 1.32 .846
Improbable – Probable 3.01 1.28 .855
Impossible – Possible 3.12 1.32 .836
Uncertain – Certain 2.95 1.27 .806
Unlikely – Likely 3.40 1.38 .820
Non-existent – Existent 3.39 1.34 .848
Improbable – Probable 3.36 1.32 .842
Impossible – Possible 3.45 1.34 .826
Uncertain – Certain 3.33 1.30 .802
Not fun – Fun 3.34 1.24 .765
Dull – Exciting 3.01 1.25 .833
Enjoyable/ – Unenjoyable
3.16 1.16 .833
Not delightful - Delightful
2.82 1.25 .813
Unpleasant – Pleasant 3.28 1.25 .787
Not functional – Functional
3.76 1.22 .801
Unnecessary - Necessary
3.60 1.27 .788
Impractical -Practical 3.53 1.14 .822
If I bought it ____, I would be concerned if this was a wise investment.
3.28 1.34 .856
Buying a _______ can involve significant
losses. 2.69 1.29 .795
If I bought ____, I would be concerned if it was
worth. 3.20 1.32 .892
Cronbach’s Alpha .940 .963 .886 .815 .818
APPENDIX B
Correlation Matrix
Variables PI H U PR
Purchase Intention (PI) .894**
Hedonic perception (H) .403 .903**
Utilitarian perception (U) .557 .357 .846**
Risk Perception (PR) .,234 -.092 -.181 .885**