Physical activity indicators in adults from a state
capital in the South of Brazil: a comparison
between telephone and face-to-face surveys
Indicadores da atividade física em adultos de
uma capital do Sul do Brasil: comparação entre
pesquisas telefônicas e face a face
Indicadores de actividad física en adultos de
una capital del sur de Brasil: comparación entre
encuestas telefónicas y cara a cara
1 Programa de Pós-graduação em Educação Física, Universidade Federal de Santa Catarina, Florianópolis, Brasil.
2 Programa de Pós-graduação em Educação Física, Universidade Federal de Pelotas, Pelotas, Brasil. 3 Secretaria de Vigilância em Saúde, Ministério da Saúde, Brasília, Brasil.
4 Australian Research Centre for Population Oral Health, University of Adelaide, Adelaide, Australia.
Correspondence G. F. Del Duca
Programa de Pós-graduação em Educação Física, Universidade Federal de Santa Catarina.
Coordenadoria de Pós-graduação em Educação Física, Campus Universitário Reitor João David Ferreira Lima, Florianópolis, SC 88040-900, Brasil. [email protected]
Giovâni Firpo Del Duca 1 Markus Vinicius Nahas 1 Diego Augusto Santos Silva 1 Pedro Curi Hallal 2
Deborah Carvalho Malta 3 Marco Aurélio Peres 4
Abstract
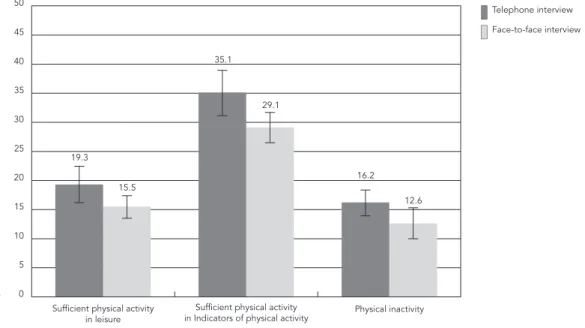
The aim of this study was to compare estimates of prevalence of physical activity indicators and associated sociodemographic factors obtained from telephone and face-to-face interviews with adults. Data from a cross-sectional population-based survey of adults living in Florianópolis, Santa Catarina State, Brazil was compared to data collected through the telephonic system VIGITEL. There was no significant difference be-tween the results from telephone interviews (n = 1,475) and face-to-face interviews (n = 1,720) with respect to prevalence of sufficient leisure time physical activity (19.3% versus 15.5%, re-spectively), sufficient leisure time and/or com-muting physical activity (35.1% versus 29.1%, respectively) and physical inactivity (16.2% ver-sus 12.6%, respectively). Some differences were observed with respect to the sociodemographic factors associated with leisure time and/or com-muting physical activity and physical inactivity. The two techniques yielded generally similar re-sults with respect to prevalence and sociodemo-graphic factors associated to physical activity indicators.
Motor Activity; Self Report; Interview; Telephone
Resumo
O objetivo do estudo foi comparar as prevalên-cias de indicadores da atividade física e fato-res sociodemográficos associados de pesquisas por entrevista telefônica e face a face. Dados de pesquisa transversal de base populacional com adultos de Florianópolis, Santa Catarina, Brasil, foram confrontados com aqueles coletados pe-lo sistema telefônico VIGITEL. As pesquisas por entrevista telefônica (n = 1.475) e entrevista face a face (n = 1.720) não apresentaram diferenças significativas nas prevalências de atividade fí-sica suficiente no lazer (19,3% vs. 15,5%), ativi-dade física suficiente no lazer e/ou deslocamento (35,1% vs. 29,1%) e inatividade física (16,2% vs. 12,6%), respectivamente. Na investigação dos fa-tores sociodemográficos associados à atividade física no lazer e/ou deslocamento e inatividade física, algumas diferenças entre as pesquisas fo-ram observadas. Conclui-se que a maioria das estimativas de prevalências e fatores associados aos diferentes indicadores da atividade física foi semelhante entre as duas pesquisas.
Introduction
The absence of a gold-standard measure for diag-nosis and monitoring of physical activity has led to the use of a variety of methodologies. Objective devices such as accelerometers and pedometers ensure greater accuracy, but are more difficult to use and more expensive than questionnaires 1.
However, self-report questionnaires also present certain limitations such as the overestimation of physical activity by participants 2.
One of the most commonly used procedures for data collection are face-to-face interviews 3,4
and self-administered questionnaires 5,6.
Tele-phone interviews are a low-cost method of data collection, especially in high income countries where practically the entire population has ac-cess to a telephone service. The Behavioral Risk Factor Surveillance System (BRFSS) 7 is a well
known monitoring system which has been upda-ted annually since 1984 to monitor health condi-tions and risk behavior, including physical inacti-vity during leisure time 8. Created by the Centers
for Disease Control and Prevention (CDC), the system collects data from adults through landli-ne and cell pholandli-ne interviews in all 50 US states as well as the Districts of Columbia, Guam, Porto Ri-co and the Virgin Islands. Telephonic surveys ha-ve also been successfully experimented in other developed countries such as Spain 9 and Israel 10.
In middle-income countries such as Brazil, the use of telephone interviews is a relatively re-cent phenomenon. In 2006, an annual survey of the frequency and distribution of the main deter-minants of chronic non-communicable diseases in Brazilian state capitals and Federal District was initiated through the Surveillance System of Protective and Risk Factors for Chronic Diseases Telephone Survey (VIGITEL) 11. Physical activity
has been measured in a number of different ways including frequency of physical activity during leisure time, physical inactivity and, more re-cently, sufficient leisure time and/or commuting physical activity 12.
Although the physical activity assessment to-ols used in Brazil appear to be reproducible and accurate 13, the methodological aspects of
resear-ch 14,15 may differ and studies generally depend
on weighted analysis to assess sample represen-tativeness of census surveys. To the best of our knowledge, studies comparing the results of tele-phone and face-to-face interviewing techniques for assessing physical activity indicators have not yet been carried out.
The objective of this study was to compare estimates of prevalence of physical activity indi-cators and associated sociodemographic factors among adults in a state capital in the South of
Brazil obtained from surveys by telephone and face-to-face interviews.
Methods
Research using face-to-face interviews consis-ted of a cross-sectional population-based study carried out between September 2009 and Janu-ary 2010 using data from the EpiFloripa study which investigated the health conditions of a re-presentative sample of adults in Florianópolis, capital of the State of Santa Catarina. Florianó-polis occupies first place in the Human Develop-ment Index (HDI) ranking in Brazil (http://www. pnud.org.br/atlas/ranking/IDH-M%2091%20 00%20Ranking%20decrescente%20(pelos%20 dados%20de%202000).htm, accessed on 18/ Aug/2011).
The following parameters were used to deter-mine the minimum sample size needed: unkno-wn prevalence of the different outcomes of the inquiry (50%); 95% confidence interval (95%CI); sampling error of plus or minus four percentage points; a design effect of two with additional 10% for losses; 15% was added for adjusted analysis for potential confounders. The sample size after rounding was 2,016.
The sampling process was carried out in two stages. The first stage consisted of organizing 420 urban areas of Florianópolis adopted by the 2000 Demographic Census (http://www.ibge.gov.br) in ascending order according to head of the hou-sehold income and randomly selecting six areas from each income decile (n = 60 census areas).
In the second stage, the number of househol-ds in each census area was updated by field su-pervisors by counting the number of occupied homes in each selected census area. The number of occupied homes in each area varied betwe-en 61 and 810. The areas were reorganized using fusion and division to reduce the coefficient of variation between areas. The initial coefficient of variation was 55% (n = 60 sectors) and decreased to 32% after adjustment (n = 63 areas comprising 16,755 households). Eighteen households were randomly selected from each census area giving a total of 1,134 households. An average of appro-ximately 32 adults from each census area partici-pated in the study. Inverse probability weighting was used to account for the inverse probability of a household being included in the sample.
The study was approved by the Human Re-search Ethics Committee of the Santa Catarina Federal University (document number 351/08).
Research using telephone interviews was performed by the Brazilian Ministry of Health through the VIGITEL. The minimum sample size needed to estimate prevalence of different risk factors was calculated as 2,000 individuals aged 18 years and over (95%CI; margin of error = 2%).
The research sample was systematically se-lected from 4,800 registered land lines informed by the telephone companies present in the city. The selected lines were then reselected and di-vided into 25 replicas, each with 200 lines and the same proportion of lines per census area. This process was performed due to difficulties in estimating the proportion of eligible (i.e.: ac-tive) land lines; estimates indicate that 69.3% of households in Florianópolis have land line te-lephones 11. Phone lines were excluded if they
belonged to a company, no longer existed, were out of service, or did not respond to ten calls ma-de at different times on different days. For each eligible line (n= 2,555), the users that agreed to participate in the study were asked to confirm the number of individuals aged 18 years and over residing in the household. A total of 1,800 adults participated in the study.
Telephone interviews were carried out from January to December 2009 by a specialized company contracted for the study with 20 inter-viewers, four supervisors and a coordinator. The team received prior training and was supervised throughout the period of data collection by a re-searcher from the University of São Paulo and professionals from the Secretary of Health Sur-veillance of the Brazilian Ministry of Health.
The following weighting procedures were performed: adjustment based on the inverse number of telephone lines in the interviewee’s home, to correct for the greater probability of se-lection of individuals living in households with more than one telephone line; adjustment based on the number of adults living in the household, to correct for the lower probability of participa-tion of individuals living in households with a lar-ger number of adult residents; sample matching based on sociodemographic characteristics. In this procedure the sample was stratified into 36 sociodemographic categories according to gen-der (male and female), age range (18-24, 25-34, 35-44, 45-54, 55-64 and ≥ 65 years) and educa-tional attainment (0-8, 9-11 and ≥ 12 complete years of study). The same classification was then carried out for the population of Florianópolis based on the 2000 Demographic Census 16. The
weighting factor consisted of the ratio between the relative frequencies of individuals from the
2000 Demographic Census and the telephone in-terview sample in each of the 36 sociodemogra-phic categories.
The VIGITEL was approved by the National Human Research Ethics Committee of the Brazi-lian Ministry of Health. Since this was a telepho-ne survey, verbal consent was obtaitelepho-ned instead of written informed consent.
The questions asked in the face-to-face and telephone interviews were identical in order and format and corresponded to the questions from the physical activity section assessed by the 2009 VIGITEL 12. Sufficient leisure time physical
ac-tivity was considered as at least 30 minutes of light to moderate activity a day, at least five days a week, or at least 20 minutes of vigorous phy-sical activity a day, at least three days a week, as recommended by the World Health Organiza-tion (WHO) at the time of the study 17. Light to
moderate physical activities included walking, walking on a treadmill, weight training, water ae-robics, general gymnastics, swimming, martial arts, cycling and volley-ball. Vigorous physical activities included running, running on a trea-dmill, gymnastic aerobics, football, basketball and tennis 12. This indicator was assessed by the
questions: “Have you done any kind of physical activity or sport in the last three months?”; “What main physical exercise or sport do you do on a regular basis?”; “Do you exercise at least once a week?”; “How many days a week do you usually do physical exercise or sport?”; and “How long do you exercise for on the days that you do physical activity?”.
Those individuals who answered within the following activity categories were considered physically inactive: had not practiced leisure ti-me physical activities in the last three months; did not carry out physically demanding tasks at work (did not walk much, did not carry weight and did not practice any equivalent physical acti-vity ); did not go to work on foot or by bicycle; and were not responsible for most of the housework.
and “Do you go to school/college or other educa-tional facility on foot or by bicycle?”.
The following sociodemographic indicators were assessed: gender (male and female); age (20-29; 30-39; 40-49 or 50-59 years); marital sta-tus (living with or without a partner) and educa-tional level (0-4; 5-8; 9-11 or ≥ 12 complete years of study).
For the purpose of comparing estimates of physical activity obtained from the face-to-face and telephone interviews, all subjects outside the 20 to 59 age range were excluded. Data analy-sis was performed using the Stata statistical sof-tware, version 11.0 (Stata Corp., College Station, USA). Descriptive statistics were used to estimate prevalence and 95%CI for categorical variables. The numerical variables were presented as ave-rages. An unadjusted analysis was performed to compare the factors associated with level of phy-sical activity using Wald tests for heterogeneity (for nominal categorical variables) and linear trend (ordinal categorical variables). Poisson re-gression with robust variation was used for the adjusted analysis to estimate prevalence ratio as effect measures. Data was analyzed separate-ly due to the different sample weighting of each
study. The “svy” command for complex data and a “backward” selection strategy with a critical le-vel of p ≤ 0.20 were used to control confounding variables. In the regression models, demographic variables (gender, age and current marital status) were initially included, followed by social varia-bles (educational level) and the outcomes were adjusted for sociodemographic variables.
Results
Face-to-face interviews were conducted with 1,720 adults from a total initial sample of 2,016 eligible subjects (85.3%), while telephone inter-views were conducted with 2,011 individuals from an initial sample of 2,555 eligible subjects (78.7%). With regard to telephone interviews, af-ter excluding individuals aged ≤ 19 and ≥ 60 years (n = 536), the final sample size was 1,475.
Table 1 shows the sociodemographic cha-racteristics of both samples. Over half of the in-terviewees were women and lived with a part-ner. The average age of the telephone interview sample and face-to-face interview sample was 36 years (95%CI: 35.1; 36.8) and 37.3 years (95%CI:
Table 1
Sociodemographic characteristics of the telephone and face-to-face interview samples. Florianópolis, Santa Catarina State, Brazil, 2009.
Variable Telephone interview (n = 1,475) Face-to-face interview (n = 1,720)
n % 95%CI n % 95%CI
Gender
Male 614 47.1 43.3; 50.9 761 44.7 42.4; 46.9
Female 861 52.9 49.1; 56.7 959 55.3 53.1; 57.6
Age (years)
20-29 331 33.5 29.3; 37.6 540 33.4 28.9; 38.1
30-39 364 27.6 24.3; 30.9 392 23.4 20.7; 26.1
40-49 428 24.4 21.6; 27.1 438 25.2 22.0; 28.4
50-59 352 14.6 12.6; 16.6 350 17.9 15.5; 20.4
Marital status *
Without a partner 694 47.4 43.5; 51.2 677 40.2 36.7; 43.8 With a partner 770 52.6 48.8; 56.5 1043 59.8 56.2; 63.3 Educational level (years) **
≤ 4 98 10.7 8.2; 13.2 161 8.0 5.8; 10.1
5-8 186 28.4 24.0; 32.8 *** 253 13.7 10.8; 16.5
9-11 483 30.2 27.2; 33.3 568 33.7 29.1; 38.4
≥ 12 708 30.7 27.9; 33.5 *** 737 44.6 37.7; 51.5
95%CI: 95% confidence interval.
36.2; 38.5), respectively. No significant statistical differences were observed between the two sam-ples. The level of education was higher among the individuals interviewed face-to-face and this difference was statistically significant. No signifi-cant difference was found between estimates for physical activity indicators (Figure 1).
Table 2 presents a description of physical ac-tivity indicators by sociodemographic characte-ristics for each sample. No significant difference was found between the sociodemographic cate-gories of the samples with respect to the preva-lence rate of sufficient leisure time physical ac-tivity and sufficient leisure time and/or commu-ting physical activity. Prevalence of physical inac-tivity in men and younger adults (20-29 year age group) without a partner and with a high level of education (≥ 12 years of study) was higher in all of the abovementioned categories in the telephone interview sample. No significant differences were observed with respect to the remaining catego-ries of age and educational level.
The adjusted analysis showed an association between sufficient leisure time physical activity and being male in both samples (telephone in-terviews: PR = 1.56; 95%CI: 1.11; 2.18 and face-to-face interviews: PR = 1.55; 95%CI: 1.23; 1.95) (Table 3). A direct association, with similar
mag-nitude of effect, was found between sufficient lei-sure time physical activity and educational level in both samples. Neither of the studies showed a significant statistical association between age and marital status and sufficient leisure time physical activity.
The prevalence of sufficient leisure time and/ or commuting physical activity was lower among younger members of the telephone interview sample (p = 0.04) and among members of the face-to-face interview sample with a partner (p = 0.003). Neither of the studies showed a signifi-cant association between leisure time and/or commuting physical activity and the remaining sociodemographic variables (Table 3).
Men in the telephone interview sample were 74% more likely to be physically inactive in the four domains, while in the face-to-face interview sample prevalence of inactivity was greater in ol-der individuals (p < 0.001) and those with a par-tner (p = 0.05).
Discussion
This study shows that the two interview tech-niques yielded generally similar results regarding physical activity indicators. After the inclusion
Figure 1
Table 2
Description of physical activity indicators by sociodemographic characteristics. Florianópolis, Santa Catarina State, Brazil, 2009.
Variable Telephone interview (n = 1,475) Face-to-face interview (n = 1,720)
n % 95CI% n % 95%CI
Sufficient leisure time physical activity
Gender
Male 143 23.9 19.3; 28.4 145 19.3 16.3; 22.2
Female 146 15.3 11.0; 19.6 117 12.5 10.2; 14.8
Age (years)
20-29 74 22.2 14.8; 29.6 89 17.1 14.0; 20.1
30-39 71 19.0 13.9; 24.1 55 14.3 10.4; 18.1
40-49 83 18.3 13.9; 22.6 60 13.6 10.2; 17.0
50-59 61 15.2 10.3; 20.0 58 17.0 12.1; 21.9
Marital status
Without a partner 156 21.5 16.2; 26.8 116 18.0 14.4; 21.6
With a partner 132 17.5 14.0; 21.1 146 13.9 11.4; 16.3
Educational level (years)
≤ 4 8 8.5 1.7; 15.3 12 7.4 2.2; 12.5
5-8 28 19.7 10.7; 28.7 29 11.0 7.1; 15.0
9-11 87 17.6 13.5; 21.6 80 13.3 10.5; 16.1
≥ 12 166 24.5 20.9; 28.2 141 20.1 16.8; 23.3
Sufficient leisure time and/or commuting physical activity Gender
Male 274 37.4 31.8; 42.9 190 28.9 25.1; 32.8
Female 208 33.1 27.9; 38.3 200 29.2 25.2; 33.1
Age (years)
20-29 131 42.4 33.8; 51.1 140 32.3 28.6; 36.1
30-39 115 32.4 26.2; 38.6 89 26.5 20.5; 32.4
40-49 131 32.4 27.0; 37.8 97 26.5 20.5; 32.5
50-59 105 28.0 21.9; 34.1 64 30.2 23.7; 36.8
Marital status
Without a partner 256 39.5 33.2; 45.9 179 34.1 29.7; 38.5
With a partner 222 31.0 26.7; 35.3 211 25.5 22.3; 28.7
Educational level (years)
≤ 4 31 29.7 19.2; 40.2 26 21.0 10.4; 31.6
5-8 65 41.4 30.9; 51.9 51 29..4 21.0; 37.8
9-11 149 31.2 26.2; 36.2 130 28.3 24.0; 32.5
≥ 12 237 35.0 30.1; 39.0 183 30.6 26.1; 35.1
Physical inactivity Gender
Male 152 20.9 17.2; 24.6 * 91 12.6 9.4; 15.9
Female 130 12.0 9.5; 14.5 112 12.5 9.1; 15.9
Age (years)
20-29 74 16.3 12.0; 20.7 * 36 6.8 3.9; 9.8
30-39 72 16.0 11.9; 20.2 50 14.1 10.1; 18.1
40-49 75 14.3 10.6; 17.9 54 13.1 9.1; 17.1
50-59 61 19.4 13.6; 25.3 63 20.5 15.3; 25.7
Marital status
Without a partner 142 17.4 13.9; 20.9 * 59 9.0 6.3; 11.7
With a partner 139 15.1 12.3; 18.0 144 14.9 11.5; 18.4
Table 2 (continued)
Physical inactivity Educational level (years)
≤ 4 9 9.3 2.7; 15.9 26 19.3 11.5; 27.2
5-8 10 4.9 1.7; 8.1 30 13.3 8.0; 18.7
9-11 73 15.9 12.0; 19.8 66 12.0 8.2; 15.8
≥ 12 190 29.3 25.4; 33.1 * 81 11.6 8.7; 14.5
95%CI: 95% confidence interval.
* Statistically significant difference between these results and the results obtained from face-to-face interviews.
Variable Telephone interview (n = 1,475) Face-to-face interview (n = 1,720)
n % 95CI% n % 95%CI
of the variable leisure time and/or commuting physical activity in 2009, the VIGITEL 12 now
adopts three indicative measures of physical ac-tivity. This initiative follows the tendency among international agencies, such as the WHO 18 and
the U.S. Department of Health and Human Ser-vices 19, to promote different domains of
physi-cal activity as a way of meeting recommended health standards.
No significant statistical differences in pre-valence of sufficient leisure time physical acti-vity, sufficient leisure time and/or commuting physical activity and physical inactivity in the four domains were found between the interview techniques. The adoption of a physically active lifestyle (commuting, occupational, household, leisure time) differs according to socioeconomic status 4,10,20 and therefore this finding may be
explained by the similarity between the sociode-mographic characteristics of the samples. Ano-ther study carried out in Brazil that compared the results of face-to-face and telephone inter-view techniques used for administering the In-ternational Physical Activity Questionnaire with a group of adults found a very high correlation between the two techniques (kappa coefficient 0.69) 21.
Research focused primarily on leisure time physical activity domains because activity in this domain is generally more intense. However, other domains of physical activity can also contribute to a significant reduction in mortality from all causes, particularly cancer and cardiovascular disease 22,23. The proportion of individuals from
the telephone and face-to-face interview sam-ples considered physically active during leisu-re time was 19.3% and 15.5%, leisu-respectively. This proportion is higher than that observed in China (10%) 24 but lower than in developed counties
such as Spain (28.8%) 25 and the United States
(41.9%) 26. These differences may be explained
by environmental and socioeconomic factors. In
the present study, the results of both interview techniques showed that men were more phy-sically active during leisure time than women and a direct association was observed between education level and sufficient physical activity. These findings are consistent with other studies
4,8,25,26 that suggest that men are more active
du-ring leisure time due to greater involvement in sports 16,26, while women carry the burden of a
double work day that hinders their engagement in recreational physical activity.
The contribution of leisure time physical activity to total energy expenditure from daily physical activity is lower than other domains 4,27.
Physical activity during commuting makes up a significant proportion of total physical activity among the population, especially in developing countries 28,29. The use of leisure time physical
activity as a sole indicator to evaluate complian-ce with recommended levels of physical activity leads to a reduction in the association between sociodemographic characteristics and preva-lence of sufficient leisure time and/or commu-ting physical activity as an indicator of the total physical activity. Estimates of prevalence of su-fficient leisure time and/or commuting physical activity based on data from telephone interviews and face-to-face interviews were similar (35.1% and 29.1%, respectively). However, these findin-gs differ considerably from those observed in studies carried out in the United States 26 and
China 24 which state that five out of 10 adults are
physically active when leisure and commuting domains are considered together. Prevalence by population subgroups was very similar, reflec-ting only small differences in rates according to sociodemographic characteristics. No significant differences were found between the two inter-view techniques.
Table 3
Sociodemographic factors associated with physical activity indicators by interview technique (telephone and face-to-face). Florianópolis, Santa Catarina State, Brazil, 2009.
Variable Telephone interview (n = 1,475) Face-to-face interview (n = 1,720)
Crude analysis Adjusted analysis * Crude analysis Adjusted analysis *
PR 95%CI p-value PR 95%CI p-value PR 95%CI p-value PR 95%CI p-value
Sufficient leisure time physical activity
Gender 0.01 ** 0.01** < 0.001** < 0.001 **
Male 1.56 1.11; 2.19 1.56 1.11; 2.18 1.54 1.22; 1.94 1.55 1.23; 1.95
Female 1.00 1.00 1.00 1.00
Age (years) 0.13 *** 0.14 *** 0.69 *** 0.73 ***
20-29 1.00 1.00 1.00 1.00
30-39 0.86 0.56; 1.31 0.84 0.55; 1.29 0.84 0.64; 1.09 0.95 0.68; 1.31 40-49 0.82 0.55; 1.24 0.83 0.55; 1.26 0.80 0.59; 1.09 0.91 0.65; 1.27 50-59 0.68 0.43; 1.08 0.68 0.43; 1.07 1.00 0.69; 1.43 1.11 0.78; 1.58
Marital status 0.21 ** 0.43 ** 0.07 ** 0.06 **
Without a partner 1.00 1.00 1.00 1.00
With a partner 0,.81 0.59; 1.12 0.88 0.64; 1.20 0.77 0.58; 1.02 0.77 0.58; 1.01
Educational level (years) 0.02 *** 0.04 *** < 0.001 *** < 0.001 ***
≤ 4 1.00 1.00 1.00 1.00
5-8 2.31 0.93; 5.74 2.02 0.82; 4.94 1.50 0.66; 3.39 1.53 0.68; 3.47
9-11 2.06 0.91; 4.69 1.83 0.81; 4.16 1.80 0.88; 3.68 1.76 0.86; 3.59
≥ 12 2.88 1.29; 6.43 2.58 1.16; 5.77 2.73 1.32; 5.66 2.67 1.29; 5.53 Sufficient leisure time and/or
commuting physical activity Gender
Male 1.13 0.91; 1.40 0.27 ** 1.12 0.90; 1.38 0.30 ** 0.99 0.81; 1.22 0.94 ** 1.01 0.82; 1.25 0.92 **
Female 1.00 1.00 1.00 1.00
Age (years) 0.008 *** 0.04 *** 0.34 *** 0.91 ***
20-29 1.00 1.00 1.00 1.00
30-39 0.76 0.58; 1.01 0.81 0.61; 1.08 0.82 0.66; 1.02 0.92 0.73; 1.15
40-49 0.76 0.59; 0.99 0.81 0.62; 1.07 0.82 0.63; 1.07 0.91 0.69; 1.20 50-59 0.66 0.49; 0.89 0.71 0.52; 0.96 0.94 0.72; 1.21 1.02 0.78; 1.34
Marital status 0.02 ** 0.14 ** 0.003 ** 0.003 **
Without a partner 1.00 1.00 1.00 1.00
With a partner 0.78 0.63; 0.97 0.85 0.69; 1.05 0.75 0.62; 0.90 0.75 0.62; 0.90
Educational level (years) 0.71 *** 0.46 *** 0.23 *** 0.32 ***
≤ 4 1.00 1.00 1.00 1.00
5-8 1.39 0.91; 2.14 1.27 0.83; 1.95 1.40 0.77; 2.55 1.44 0.79; 2.61 9-11 1.05 0.72; 1.54 0.93 0.62; 1.39 1.35 0.81; 2.23 1.32 0.81; 2.16
≥ 12 1.18 0.82; 1.70 1.07 0.73; 1.58 1.46 0.85; 2.51 1.42 0.84; 2.40 Physical inactivity
Gender < 0.001 ** < 0.001 ** 0.94 ** 0.94 **
Male 1.74 1.32; 2.30 1.74 1.32; 2.30 1.01 0.73; 1.40 1.01 0.73; 1.40
Female 1.00 1.00 1.00 1.00
Age (years) 0.73 *** 0.39 *** < 0.001 *** < 0.001 ***
20-29 1.00 1.00 1.00 1.00
30-39 0.98 0.68; 1.42 1.02 0.70; 1.49 2.06 1.31; 3.24 1.83 1.16; 2.89 40-49 0.87 0.61; 1,26 0.96 0.66; 1.39 1.90 1.24; 2.95 1.70 1.07; 2.69 50-59 1.19 0.80; 1.78 1.27 0.86; 1.87 3.00 1.86; 4.83 2.70 1.62; 4.50
Physical inactivity
Marital status 0.31 ** 0.33 ** 0.002 ** 0.05 **
Without a partner 1.00 1.00 1.00 1.00
With a partner 0.87 0.66; 1.14 0.87 0.67; 1.15 1.66 1.21; 2.28 1.41 1.00; 1.97
Educational level (years) < 0.001 *** < 0.001 *** 0.09 *** 0.45 ***
≤ 4 1.00 1.00 1.00 1.00
5-8 0.53 0.20; 1.36 0.48 0.19; 1.24 0.69 0.44; 1.07 0.75 0.48; 1.18 9-11 1.71 0.81; 3.58 1.61 0.77; 3.38 0.62 0.39; 0.97 0.77 0.49; 1.20
≥ 12 3.14 1.54; 6.39 2.91 1.43; 5.92 0.60 0.38; 0.94 0.76 0.48; 1.20
95%CI: 95% confidence interval; PR: prevalence ratio.
* Adjusted analysis for the variables sex, age, marital status (first level) and education (second level); ** Wald test for heterogeneity;
*** Wald test for linear trend. Table 3 (continued)
Variable Telephone interview (n = 1,475) Face-to-face interview (n = 1,720)
Crude analysis Adjusted analysis * Crude analysis Adjusted analysis *
PR 95%CI p-value PR 95%CI p-value PR 95%CI p-value PR 95%CI p-value
Physical inactivity was slightly higher among younger and more educated individuals in the telephone interview sample. However, the two interview techniques showed divergent results suggesting that errors occurred in estimates of associated factors. Men and more educated indi-viduals from the telephone research sample were more inactive, whereas in the face-to-face inter-view sample older individuals and those with a partner were more likely to be physically inac-tive. A literature review 30 suggests that physical
activity is generally greater in younger married men with a higher level of education. However, it should be emphasized that the majority of stu-dies included in this review focused exclusively on the physical activity in leisure time domain, where the influence of sociodemographic cha-racteristics on prevalence of physical activity is more pronounced.
In a study in China 4 that grouped activity into
commuting, occupational, household and leisure time, no significant differences in weekly energy expenditure were observed between genders.
Possible explanations for differences betwe-en the factors associated with physical activity under the two interview techniques are greater access to landline telephones among certain po-pulation subgroups 31, the long duration of the
data collection process under the telephone in-terview technique (seasonality) and the probabi-lity of the occurrence of random errors due to the numbers of variables which comprise physical inactivity.
This research is unique in that it provides previously unavailable data. Although some in-dicators evaluated by the VIGITEL system have
already been analyzed 32,33,34, no previous
com-parison of the physical activity indicators used by this monitoring system had been carried out using telephone monitoring and household in-terviews. However, the present study has certain limitations that need to be taken into account. Florianópolis has one of the highest coverage ra-tes for landline telephones among Brazilian state capitals 11. Positive results observed with regard
to prevalence estimates for physical activity indi-cators may not be repeatable in cities with lower coverage and this situation needs to be addres-sed. In addition, the time spent collecting data through telephone interviews may have been affected by the time of year that the study was carried out. Finally, data was collected in 2009 and the current scenario for physical activity in-dicators may be different.
Resumen
El objetivo de este estudio fue comparar la prevalencia de indicadores de actividad física y factores sociode-mográficos, asociados a una investigación por teléfono y entrevistas cara a cara. Los datos de la investigación transversal poblacional con adultos de Florianópolis, Santa Catarina, Brasil, se contrastaron con los recogi-dos por el sistema Vigitel. La encuesta por entrevista telefónica (1.475) y las entrevistas cara a cara (1.720) mostraron diferencias significativas en la prevalencia de una suficiente actividad física en el ámbito de ocio (15,5 vs. 19,3), suficiente actividad física en el ocio o el desplazamiento (35,1 versus 29,1) y la inactividad física (12,6 versus 16,2), respectivamente. En la inves-tigación de factores sociodemográficos, asociados con la actividad física en el ocio o el desplazamiento, y la inactividad física, se observaron algunas diferencias entre las encuestas. Se concluye que la mayoría de las estimaciones de prevalencia y factores asociados con los indicadores de actividad física diferente fueron simila-res entre las dos encuestas.
Actividad Motora; Autoinforme; Entrevista; Teléfono
Contributors
G. F. Del Duca was responsible for study conception and statistical analysis, and drafted the first version of this manuscript. M. V. Nahas supervised statistical analysis, participated in the drafting of this manuscript, and cri-tically revised this text. D. A. S. Silva, P. C. Hallal and D. C. Malta contributed to the critical revision of this text. M. A. Peres coordinated fieldwork, and critically revised a preliminary version of this text.
Acknowledgments
G. F. Del Duca is grateful to Capes for providing a schol-arship. M. V. Nahas, P. C. Hallal and M. A. A. Peres are grateful to the CNPq for providing a productive research scholarship. The authors wish to thank CNPq for fund-ing this research.
References
1. Dumith SC, Domingues MR, Gigante D. Epidemio-logia das atividades físicas praticadas no tempo de lazer por adultos do Sul do Brasil. Rev Bras Epide-miol 2009; 12:646-58.
2. Troiano RP, Berrigan D, Dodd KW, Mâsse LC, Til-ert T, McDowell M. Physical activity in the United States measured by accelerometer. Med Sci Sports Exerc 2008; 40:181-8.
3. Barnett TA, Gauvin L, Craig CL, Katzmarzyk PT. Distinct trajectories of leisure time physical activ-ity and predictors of trajectory class membership: a 22 year cohort study. Int J Behav Nutr Phys Act 2008; 5:57.
4. Nang EEK, Khoo EY, Salim A, Tai ES, Lee J, Van Dam RM. Patterns of physical activity in different domains and implications for intervention in a multi-ethnic Asian population: a cross-sectional study. BMC Public Health 2010; 10:644.
5. Ali SM, Lindstrom M. Psychosocial work condi-tions, unemployment, and leisure-time physical activity: a population-based study. Scand J Public Health 2006; 34:209-16.
6. Gast GC, Frenken FJ, van Leest LA, Wendel-Vos GC, Bemelmans WJ. Intra-national variation in trends in overweight and leisure time physical activities in The Netherlands since 1980: stratification ac-cording to sex, age and urbanisation degree. Int J Obes 2007; 31:515-20.
7. Centers for Disease Control and Prevention. Health risks in the United States: Behavioral Risk Factor Surveillance System. At a glance 2010. At-lanta: Centers for Disease Control and Prevention; 2010.
8. Centers for Disease Control and Prevention. Trends in leisure-time physical inactivity by age, sex, and race/ethnicity: United States, 1994-2004. MMWR Morb Mortal Wkly Rep 2005; 54:991-4.
10. Kahan E, Fogelman Y, Bloch B. Correlations of work, leisure, and sports physical activities and health status with socioeconomic factors: a nation-al study in Israel. Postgrad Med J 2005; 81:262-5. 11. Secretaria de Vigilância em Saúde, Ministério da
Saúde. VIGITEL 2006. Vigilância de fatores de risco e proteção para doenças crônicas por inquérito te-lefônico. Brasília: Ministério da Saúde; 2007. 12. Secretaria de Vigilância em Saúde, Ministério da
Saúde. VIGITEL 2009. Vigilância de fatores de risco e proteção para doenças crônicas por inquérito te-lefônico. Brasília: Ministério da Saúde; 2010. 13. Monteiro CA, Florindo AA, Claro RM, Moura EC.
Validade de indicadores de atividade física e se-dentarismo obtidos por inquérito telefônico. Rev Saúde Pública 2008; 42:575-81.
14. Florindo AA, Hallal PC, Moura EC, Malta DC. Prática de atividades físicas e fatores associados em adultos, Brasil, 2006. Rev Saúde Pública 2009; 43:65-73.
15. Malta DC, Moura EC, Castro AM, Cruz DKA, Morais Neto OL, Monteiro CA. Padrão de atividade física em adultos brasileiros: resultados de um inquérito por entrevistas telefônicas, 2006. Epidemiol Serv Saúde 2009; 18:7-16.
16. Salles-Costa R, Heilborn ML, Werneck GL, Faers-tein E, Lopes CS. Gênero e prática de atividade física de lazer. Cad Saúde Pública 2003; 19 Suppl 2:S325-33.
17. Francisco PMSB, Barros MBA, Segri NJ, Alves MCGP, Cesar CLG, Malta DC. Comparação de es-timativas para o auto-relato de condições crônicas entre inquérito domiciliar e telefônico – Campinas (SP), Brasil. Rev Bras Epidemiol 2011;14:5-15. 18. World Health Organization. Global
recommenda-tions on physical activity for health. Geneva: World Health Organization; 2010.
19. U.S. Department of Health and Human Services. Physical activity guidelines for Americans: be ac-tive, healthy, and happy! Washington DC: U.S. De-partment of Health and Human Services; 2008. 20. Pitanga FJG, Lessa I, Barbosa PJB, Barbosa SJO,
Costa MC, Lopes AS. Fatores sociodemográficos associados aos diferentes domínios da atividade física em adultos de etnia negra. Rev Bras Epide-miol 2012; 15:363-75.
21. Hallal PC, Simões E, Reichert FF, Azevedo MR, Ra-mos LR, Pratt M, et al. Validity and reliability of the telephone-administered International Physical Activity Questionnaire in Brazil. J Phys Act Health 2010; 7:402-9.
22. Autenrieth CS, Baumert J, Baumeister SE, Fischer B, Peters A, Döring A, et al. Association between domains of physical activity and all-cause, car-diovascular and cancer mortality. Eur J Epidemiol 2011; 26:91-9.
23. Samitz G, Egger M, Zwahlen M. Domains of physi-cal activity and all-cause mortality: systematic re-view and dose-response meta-analysis of cohort studies. Int J Epidemiol 2011; 40:1382-400.
24. Hu G, Pekkarinen H, Hanninen O, Yu Z, Tian H, Guo Z, et al. Physical activity during leisure and commuting in Tianjin, China. Bull World Health Organ 2002; 80:933-8.
25. Meseguer CM, Galan I, Herruzo R, Zorrilla B, Ro-driguez-Artalejo F. Leisure-time physical activity in a southern European mediterranean country: adherence to recommendations and determining factors. Rev Esp Cardiol. 2009; 62:1125-33. 26. Berrigan D, Troiano RP, McNeel T, Disogra C,
Bal-lard-Barbash R. Active transportation increases adherence to activity recommendations. Am J Prev Med 2006; 31:210-6.
27. Livingstone M, Robson P, McCarthy S, Kiely M, Harrington K, Browne P, et al. Physical activity patterns in a nationally representative sample of adults in Ireland. Public Health Nutr 2001; 4:1107-16.
28. Ku PW, Fox KR, McKenna J, Peng TL. Prevalence of leisure-time physical activity in Taiwanese adults: results of four national surveys, 2000-2004. Prev Med 2006; 43:454-7.
29. Trinh O, Nguyen N, Dibley M, Phongsavan P, Bau-man A. The prevalence and correlates of physical inactivity among adults in Ho Chi Minh City. BMC Public Health 2008; 8:204.
30. Trost SG, Owen N, Bauman AE, Sallis JF, Brown W. Correlates of adults’ participation in physical activity: review and update. Med Sci Sports Exerc 2002; 34:1996-2001.
31. Azevedo MR, Araújo CL, Silva MC, Hallal PC. Tracking of physical activity from adolescence to adulthood: a population-based study. Rev Saúde Pública 2007; 41:69-75.
32. Bernal R, Silva NN. Cobertura de linhas telefônicas residenciais e vícios potenciais em estudos epide-miológicos. Rev Saúde Pública 2009; 43:421-6. 33. Segri NJ, Francisco PMSB, Alves MCGP, Barros
MBA, César CLG, Goldbaum M, et al. Práticas preventivas de detecção de câncer em mulheres: comparação das estimativas dos inquéritos de saúde (ISA-Capital) e vigilância de fatores de ris-co e proteção para doenças crônicas por inquérito telefônico (VIGITEL – São Paulo). Rev Bras Epide-miol 2011; 14:31-43.
34. Ferreira AD, César CC, Malta DC, Andrade ACS, Ramos CGC, Proietti FA, et al. Validade de estima-tivas obtidas por inquérito telefônico: comparação entre VIGITEL 2008 e Inquérito Saúde em Beagá. Rev Bras Epidemiol 2011; 14:16-30.
Submitted on 03/Sep/2012